4108
Regional 17O T2* in Human Brain at 3T1Dept. of Radiology, Medical Physics, Medical Center University of Freiburg, Faculty of Medicine, University of Freiburg, Freiburg, Germany, 2Dept. of Anesthesiology and Critical Care, Medical Center University of Freiburg, Faculty of Medicine, University of Freiburg, Freiburg, Germany
Synopsis
Keywords: Data Analysis, Non-Proton
Information about T2* relaxation time plays an important role in data acquisition for 17O-MRI. In this work, we investigated the in vivo T2* relaxation time constants of 17O in regional brain tissue at 3T. Overall, regional T2* relaxation times are in a range of 1.5 - 2ms (except for CSF). Additionally, a T2* variation of 0.12ms was found from superficial to deep layers in the insular cortex. Our results indicate that short-TE acquisition strategies are favorable for 17O-MRI of the brain.Introduction
Oxygen is required to maintain the energy balance of brain tissue, which primarily depends on oxidative metabolism to support the complex function of neuronal activity [1]. Cerebral metabolic rate of oxygen consumption (CMRO2) is a measurable indicator of oxygen utilization in the brain [2]. Dynamic 17O-MRI and MRS after inhalation of isotope-enriched 17O2 have been used to measure CMRO2 in the human or mouse brain at 3T or higher [3-7]. However, the signal-to-noise ratio (SNR) of 17O MR is low due to the low MR-sensitivity and short T2* relaxation time. Information about T2* relaxation time plays an important role in data acquisition since SNR is proportional to (T2*/T1)1/2 [8]. Therefore, we determined T2* relaxation time of 17O in several brain regions including white and cortical gray matter, cerebrospinal fluid (CSF), subcortical gray matter, and cerebellum. In addition, variation of T2* across depth was also investigated in the insular cortex.Methods
In vivo 17O MRI was performed on a healthy subject (male, age: 33y) with a clinical 3 Tesla whole body MRI system (Prisma Fit; Siemens) in 12 settings, each acquiring data at one echo time (TE). 17O-MRI was carried out with natural abundance H217O concentration in the human brain using a custom-built circularly-polarized Tx/Rx 17O RF coil (f = 16.7 MHz). A 3D ultra-short echo-time (UTE) sequence with Golden-angle acquisition pattern was employed with TR = 14.3 ms, 12 echo times (TE = 0.6 ms – 8.0 ms), BW = 360 Hz/px, number of spokes = 288k, nominal resolution = (4 mm)3, acquisition time TA = 12 × 69 min. Additionally, high-resolution 1H anatomical images were acquired for tissue segmentation using a T1-weighted Magnetization Prepared Rapid Acquisition Gradient Echo (MPRAGE) sequence (resolution: (1mm)3, TI = 900ms) and a 20 channel head coil array.The 17O raw data were reconstructed with conventional Kaiser-Bessel re-gridding. Averaged 17O images were automatically co-registered to the MPRAGE data using the FLIRT algorithm of FSL (FMRIB Software Library). Using the 1H MPRAGE images, binary masks of 3D regions of interest (ROIs) including white and cortical gray matter, CSF, subcortical gray matter, and cerebellum were created manually. To investigate T2* fluctuation across depth, the insular cortex was segmented into two parts: the superficial and the deep layer. The 3D masks were then transformed into 17O image space and co-registered with the 17O images using the FLIRT algorithm and the inverse of the transformation matrix. Finally, a mono-exponential T2* decay function was fitted to the mean data in each investigated region to determine T2* values.
Results
In vivo 17O images and the co-registration of anatomical 1H and 17O image data for tissue segmentation in the T2* analysis are shown in Fig. 1. The segmented regional masks of the ROIs superimposed on the T1-weighted anatomical images are presented in Fig.2. Figure 3 displays the regional cerebral T2* measurements at 3T with H217O water at natural abundance. The T2* relaxation times are summarized in Table 1. Overall, regional T2* relaxation times are in a range of 1.5-2ms (except for CSF). A T2* variation of 0.12ms was found from superficial to deep layers in the insular cortex.Discussion and Conclusion
In this work, we investigated the in vivo T2* relaxation time constants of 17O in regional brain tissue at 3T. The T2* relaxation times were similar in cortical gray matter and white matter and were in good agreement with results reported at 7T [9]. As demonstrated by Zhu et al. in a 17O-MRI rat study [5], 17O T2* relaxation time is field-independent. T2* relaxation times in subcortical gray matter and cerebellum were lower compared to cortical gray and white matter, and T2* of the deep layers of the insular cortex was larger than that in the superficial layers indicating that the biological tissue composition may have an effect on the T2* relaxation time across depth. In general, all T2* relaxation times were found to be longer than 1.5 ms indicating that short-TE acquisition strategies are favorable for 17O-MRI of the brain.Acknowledgements
No acknowledgement found.References
1. S. P. Chong, C. W. Merkle, C. Leahy, et al. Cerebral metabolic rate of oxygen (CMRO2) assessed by combined Doppler and spectroscopic OCT. Biomed Opt Express. 2015, 6(10):3941-51.
2. S. Karthikeyan, L. Fiksenbaum, A. Grigorian, H, et al. Normal Cerebral Oxygen Consumption Despite Elevated Cerebral Blood Flow in Adolescents With Bipolar Disorder: Putative Neuroimaging Evidence of Anomalous Energy Metabolism. Front Psychiatry, 2019, 10:739.
3. Borowiak R, Groebner J, Haas M, et al. Direct cerebral and cardiac 17O-MRI at 3 Tesla: initial results at natural abundance. MAGMA, 2014, 27 (1): 95-99.
4. Kurzhunov D, Borowiak R, Hass H, et al. Quantification of oxygen metabolic rates in Human brain with dynamic (17) O MRI: Profile likelihood analysis. Magn Reson Med, 2017, 78 (3): 1157-1167.
5. X.-H. Zhu, H. Merkle, J.-H. Kwag, et al. 17O relaxation time and NMR sensitivity of cerebral water and their field dependence. Magn Reson Med, 2001, 45(4):543-9.
6. Kurzhunov D, Borowiak R, Reisert M, et al. Direct estimation of 17 O MR images (DIESIS) for quantification of oxygen metabolism in the human brain with partial volume correction. Magn Reson Med, 2018, 80 (6): 2717-2725.
7. Kurzhunov D, Borowiak R, Reisert M , et al. 3D CMRO2 mapping in human brain with direct 17O MRI: Comparison of conventional and proton-constrained reconstructions. Neuroimage, 2017, 155:612-624.
8. Hoult DI, Richards R. The signal-to-noise ratio of the nuclear magnetic resonance experiment. J Magn Reson. 2011, 213(2):329-43
9. S. H. Hoffmann, A. M. Nagel, F. M. Meise, et al. In vivo Relaxation Parameters of Oxygen-17. In: Proc ISMRM (2011), p. 19.
Figures
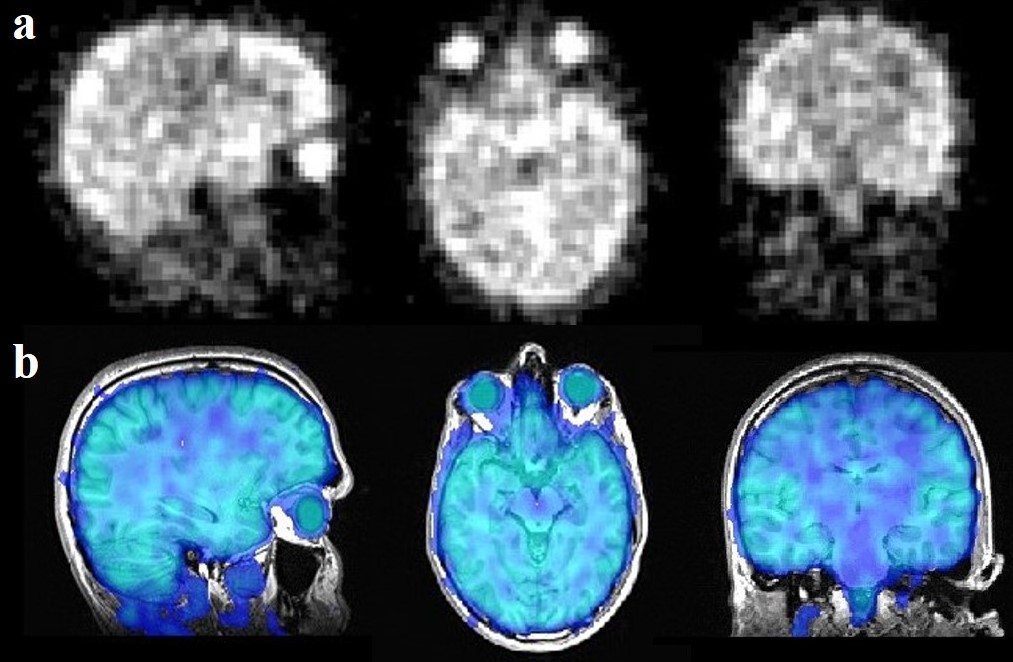
Figure 1. In vivo 17O images of the human brain (natural abundance) with an isotropic spatial resolution of (4mm)3 (a) and the co-registration of anatomical 1H and 17O imaging data for tissue segmentation (b).
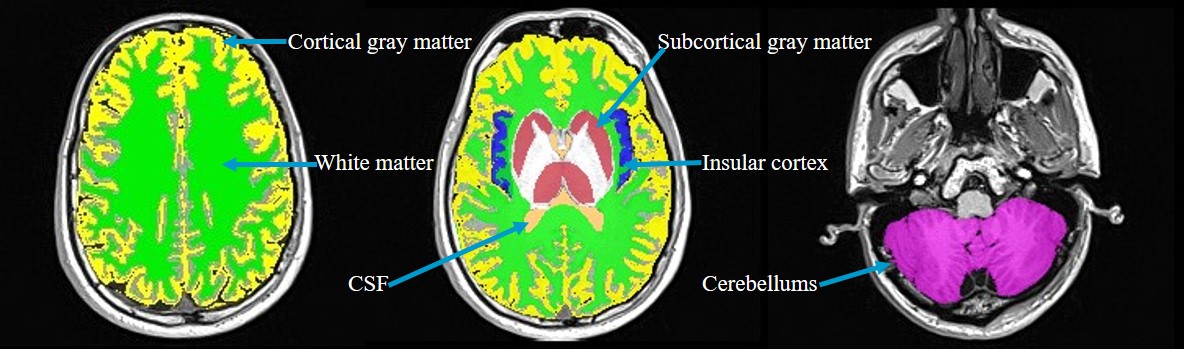
Figure 2. Segmented regional masks of the ROIs superimposed on the T1-weighted anatomical images.
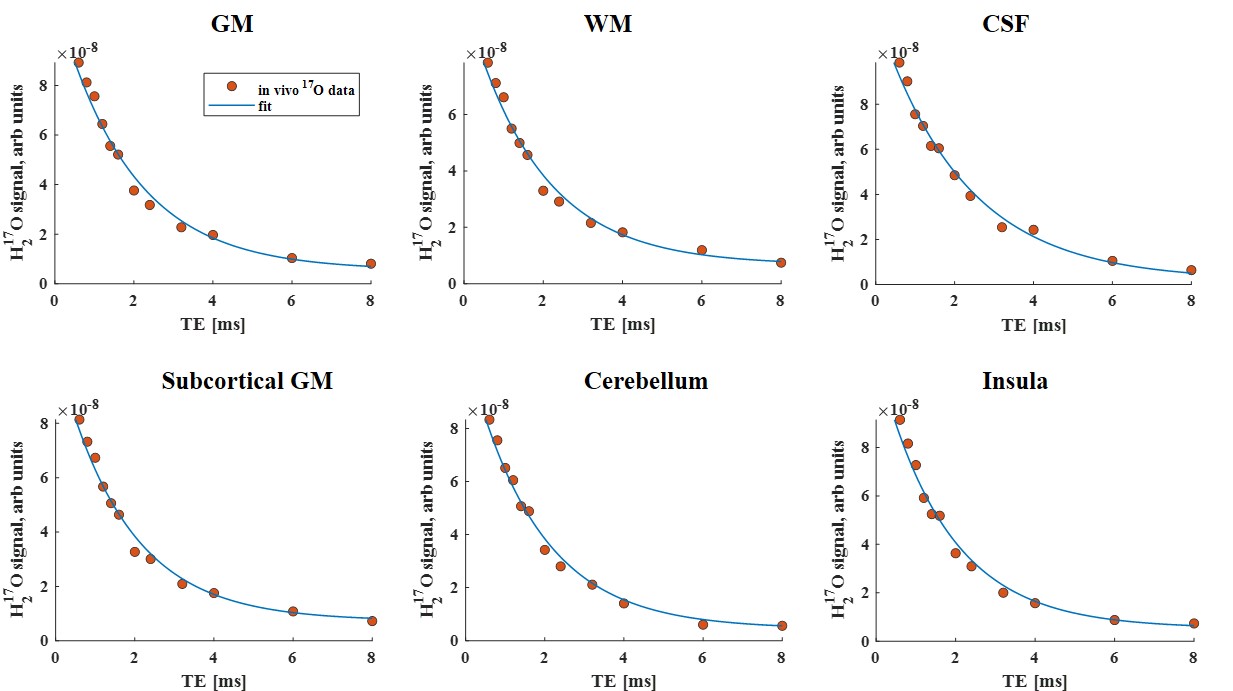
Figure 3. The fit of the T2* data as an exponential decay in the ROIs. GM, gray matter; WM, white matter.
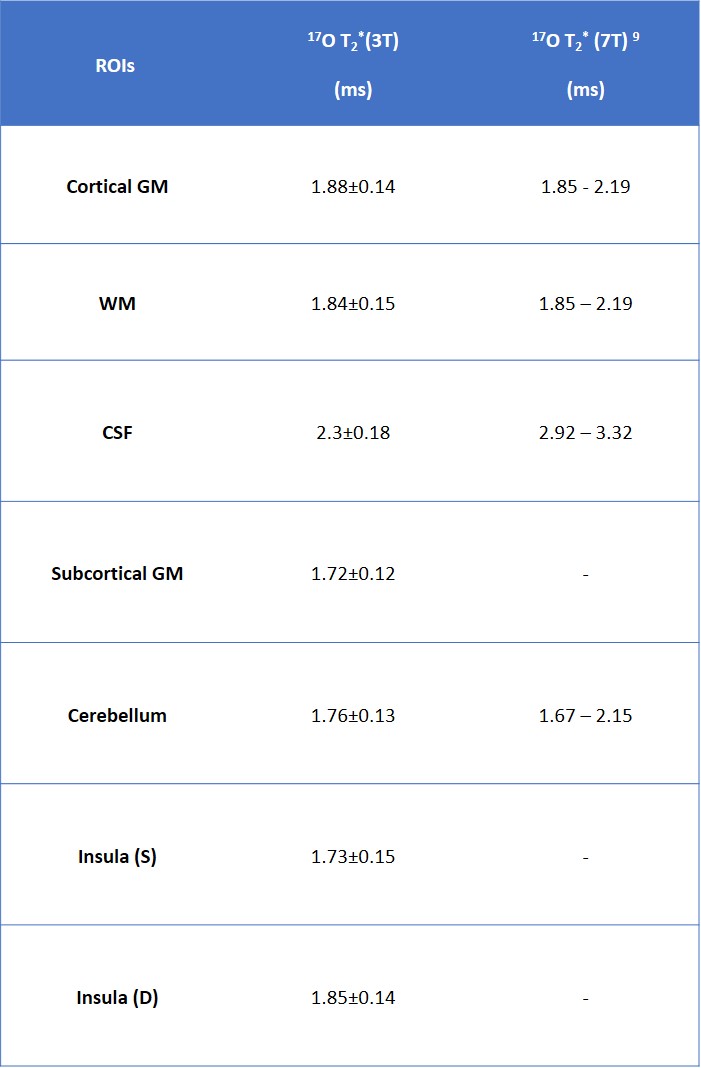
Table 1 Regional 17O T2* relaxation time of human brain tissue at 3T. GM, gray matter; WM, white matter; Insula (S), superficial layers; Insula (D), deep layers.