4105
Optimizing Hyperpolarized 129Xe MRI of cardiopulmonary oscillations using a Digital Phantom1Medical Physics, Duke University, Durham, NC, United States, 2Biomedical Engineering, Duke University, Durham, NC, United States, 3Radiology, Duke University, Durham, NC, United States, 4Cardiology, Duke University, Durham, NC, United States, 5Clinical Imaging Physics Group, Duke University, Durham, NC, United States, 6Pulmonary, Critical Care, and Sleep Medicine, University of Kansas Medical Center, Kansas City, KS, United States
Synopsis
Keywords: Data Analysis, Hyperpolarized MR (Gas), Keyhole reconstruction, Simulation
Cardiogenic red blood cell (RBC) signal oscillations in 129Xe whole-lung dynamic spectroscopy provide a promising biomarker for identifying patients with pulmonary hypertension (PH). However, to detect more complex and heterogeneous diseases, it is necessary to move from simple global metrics to spatially resolved mapping. This has been demonstrated using keyhole reconstruction methods but little work has yet been done to optimize the reconstruction and visualization of these maps. Here, we introduce a digital phantom to investigate the effects of radial views, key radius, and SNR. From these simulations, we deduce a key radius of 9 points is optimal for minimizing radial undersampling-based heterogeneity and maximizing sensitivity.
Introduction
Cardiogenic signal oscillations from hyperpolarized 129Xe dissolved in red blood cells (RBCs) are a promising biomarker for identifying patients with pre- and post-capillary pulmonary hypertension (PH)1. To date, they have been measured using whole-lung spectroscopy, but to characterize more complex and heterogeneous hemodynamics, such oscillations must be spatially resolved2. This can be achieved by exploiting cardiogenic oscillations detectable at the center of k-space (k0) of gas exchange MRI scans acquired using the 1-point Dixon technique 3,4. This approach identifies views acquired during high and low RBC signal and employs keyhole reconstruction to map the oscillations. However, significant work remains to understand how the reconstruction and post-processing steps affect the technique, including the effect of undersampling, key radius, and SNR required5. To this end, we sought to rigorously investigate these questions by introducing a digital phantom to simulate regional cardiopulmonary oscillations. From these simulations, we deduce that for the required degree of radial undersampling, a key radius of 9 points is optimal for minimizing undesirable heterogeneity and maximizing sensitivity.Methods
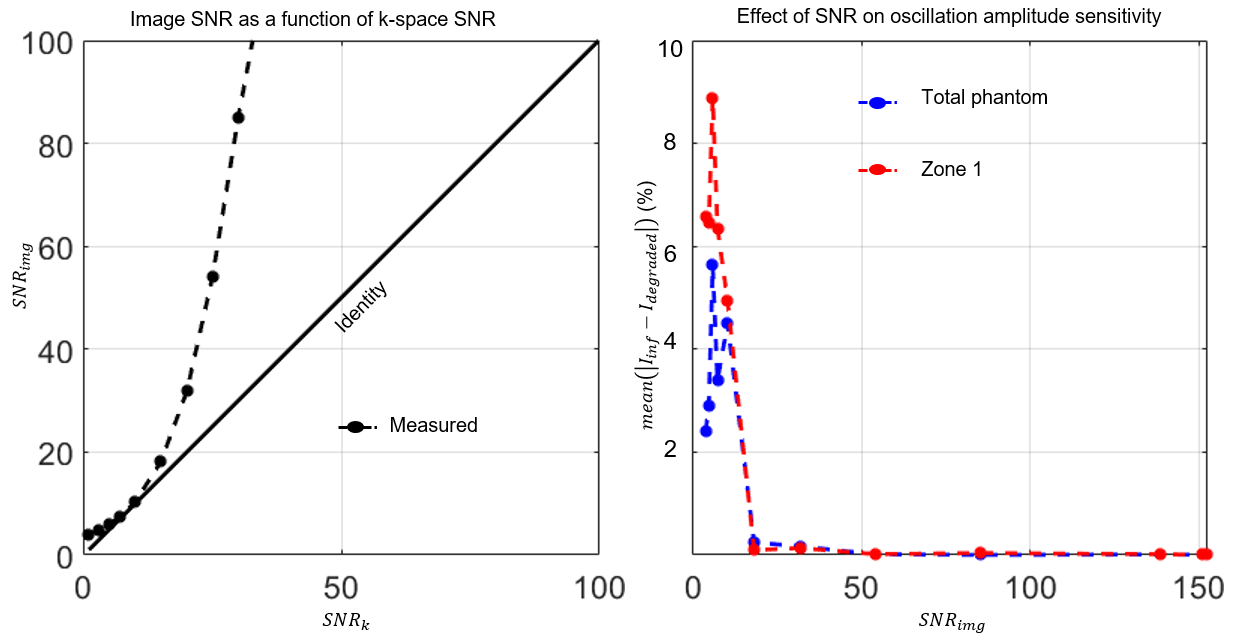
We built a 3-dimensional 6-zone digital phantom using the Michigan Image Reconstruction Toolbox.6 Zones were modeled as cylinders stacked to mimic the left and right lungs. These structures have the advantage of being amenable to rapid k-space sampling because their Fourier transform is analytically defined. The digital structure was Fourier-transformed to generate k-space data, which was radially sampled while each zone’s signal intensity was evolved according to predefined oscillation amplitudes between 0 and 20% (Figure 1). The simulation ignored longitudinal relaxation (T1= ∞) and Dixon decomposition. The phantom was radially sampled with up to 5,000 radial spokes (128 points/spoke), using a 3-D randomized Halton spiral pattern7. In addition to testing the effects of the number of radial views, n, key radius, rkey, we simulated SNR degradation by applying gaussian noise to the k-space data. The k-space SNR was related to image SNR using calibrations derived from a uniform, non-oscillating phantom.To translate these findings, they were applied to a single healthy volunteer imaged and analyzed using the standard Dixon approach with the parameters outlined in the consortium protocols8. All computation was performed in Matlab.
Results
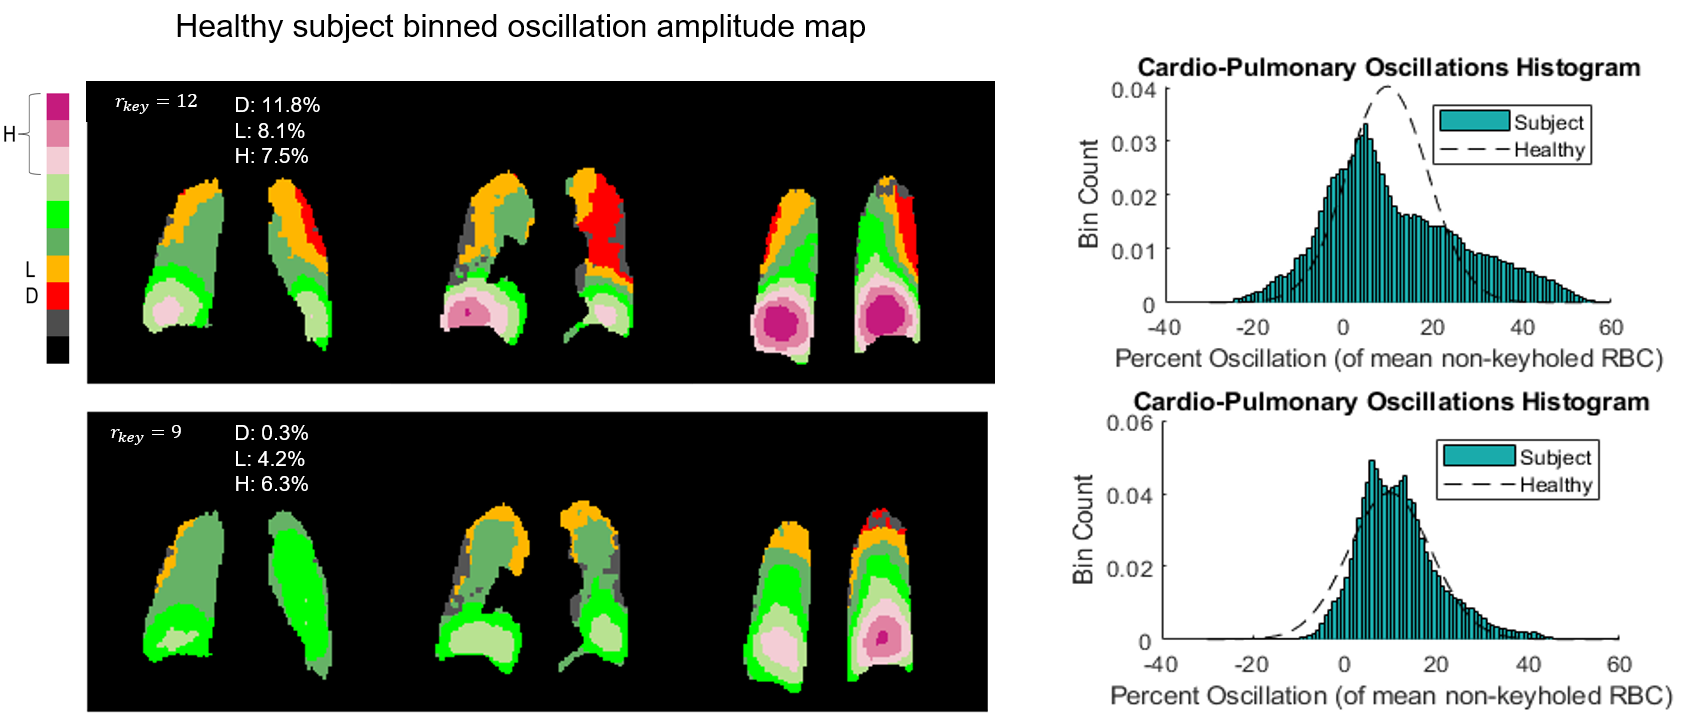
Figure 2 illustrates the effect of the number of radial views for a simple 2-sided phantom with 10% and 20% oscillation amplitudes. For 5,000 views the oscillation histograms are slightly broadened and shifted relative to ground truth but recapitulate the applied pattern well. This broadening becomes more severe and oscillation heterogeneity worsens as we move to 1000 radial views used in the current consortium protocol. Notably, while two distinct oscillation peaks are still readily detected they are significantly shifted from the applied levels.Figure 3 shows the effect of the key radius in a phantom with 0% oscillations in the top left zone and 20% in all others, sampled with 2000 radial views. The linewidth of the oscillation map histogram is clearly reduced when the key radius is reduced from 12 (calculated using a 50% sampling criterion) to 7 points. Figure 3B shows a non-uniform phantom with 0% oscillations applied in zone 1. Here, as the key radius increases, the recovered mean oscillations amplitude converges closer to the true value of 0%; however, the standard deviation inside the zone also increases. Figure 4 depicts the mean L1 norm between the degraded image and the image with infinite SNR. The value quickly falls below 5% above an SNR of 10. Figure 5 shows the effect of reducing rkey to an empirical value of 9 points compared to the calculated value of 12 points in a healthy subject, highlighting this technique’s sensitivity to rkey.
Discussion
The simulations we introduced in this work serve as means to better understand the technical factors of in vivo cardiogenic oscillation imaging. While 1,000 radial views are sufficient to map oscillation heterogeneity, the fidelity is significantly improved when the number of radial views is increased such as in “fast Dixon” imaging9. Moreover, we have shown that key radius should be carefully optimized, given the tradeoff between resolution and sensitivity, but also susceptibility to false heterogeneity at higher values. We have found that a key radius of 9 points is relatively optimal for n=2000 radial views. When this radius was used to map oscillations in a healthy human subject, the spurious heterogeneity was largely eliminated.While these simulations may guide the way to more optimal keyhole reconstruction and analysis, it is evident that radial undersampling can greatly affect the sensitivity of this method. Thus, in the future, it may be advantageous to explore other reconstruction methods such as compressed sensing10.
Acknowledgements
Funding: R01HL105643, R01HL12677, NSF GRFP DGE-1644868References
1. Bier, E.A., et al. A protocol for quantifying cardiogenic oscillations in dynamic (129) Xe gas exchange spectroscopy: The effects of idiopathic pulmonary fibrosis. NMR Biomed 32, e4029 (2019).
2. Bier, E.A., et al. Noninvasive diagnosis of pulmonary hypertension with hyperpolarised (129)Xe magnetic resonance imaging and spectroscopy. ERJ Open Res 8(2022).
3. Niedbalski, P.J., et al. Mapping cardiopulmonary dynamics within the microvasculature of the lungs using dissolved (129)Xe MRI. J Appl Physiol (1985) 129, 218-229 (2020).
4. Lethmate, R., et al. Dynamic magnetic resonance imaging with radial scanning: a post-acquisition keyhole approach. MAGMA Magnetic Resonance Materials in Physics, Biology and Medicine 16, 21-28 (2003).
5. Subashi, E., et al. A comparison of radial keyhole strategies for high spatial and temporal resolution 4D contrast-enhanced MRI in small animal tumor models. Med Phys 40, 022304 (2013).
6. Fessler, J.A. Michigan Image Reconstruction Toolbox.
7. Wang, Z., et al. Quantitative analysis of hyperpolarized (129) Xe gas transfer MRI. Med Phys 44, 2415-2428 (2017).
8. Niedbalski, P.J., et al. Protocols for multi-site trials using hyperpolarized (129) Xe MRI for imaging of ventilation, alveolar-airspace size, and gas exchange: A position paper from the (129) Xe MRI clinical trials consortium. Magn Reson Med 86, 2966-2986 (2021).
9. Niedbalski, P.J., et al. Utilizing flip angle/TR equivalence to reduce breath hold duration in hyperpolarized (129) Xe 1-point Dixon gas exchange imaging. Magn Reson Med 87, 1490-1499 (2022).
10. Hollingsworth, K.G. Reducing acquisition time in clinical MRI by data undersampling and compressed sensing reconstruction. Phys Med Biol 60, R297-322 (2015).
Figures
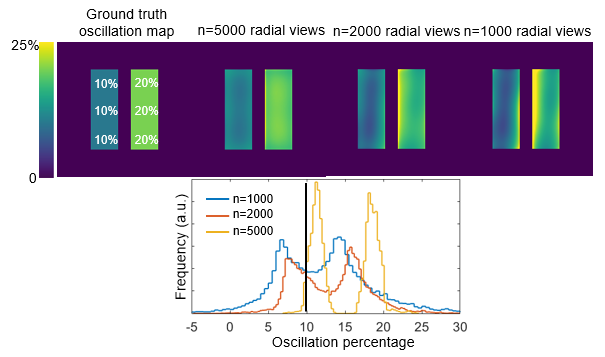
Figure 1. Six-zone cylindrical phantom design and simulation. Each zone i![]() is assigned an oscillation amplitude Ai. For each step, the signal evolves according to the function C + Ai * square(w*t) and a single radial projection is collected.
is assigned an oscillation amplitude Ai. For each step, the signal evolves according to the function C + Ai * square(w*t) and a single radial projection is collected.
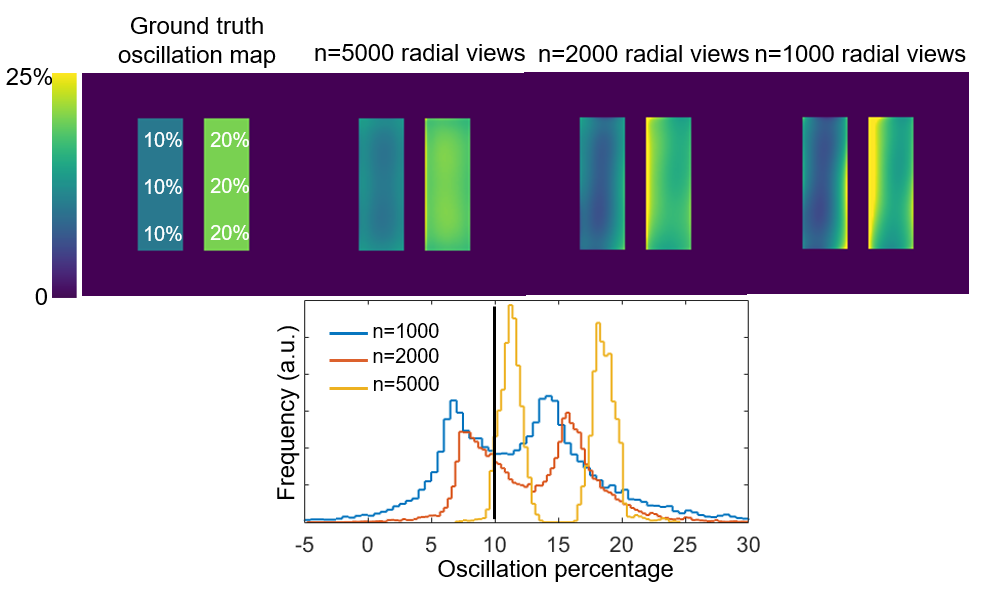
Figure 2. Effect of the number of radial views. The phantom has a prescribed oscillation amplitude of 10% on the left side and 20% on the right side. The oscillation map heterogeneity increases with decreasing number of sampled radial views. Such heterogeneity artifacts likely arise from nonuniform k-space sampling from the randomized 3D radial trajectory.
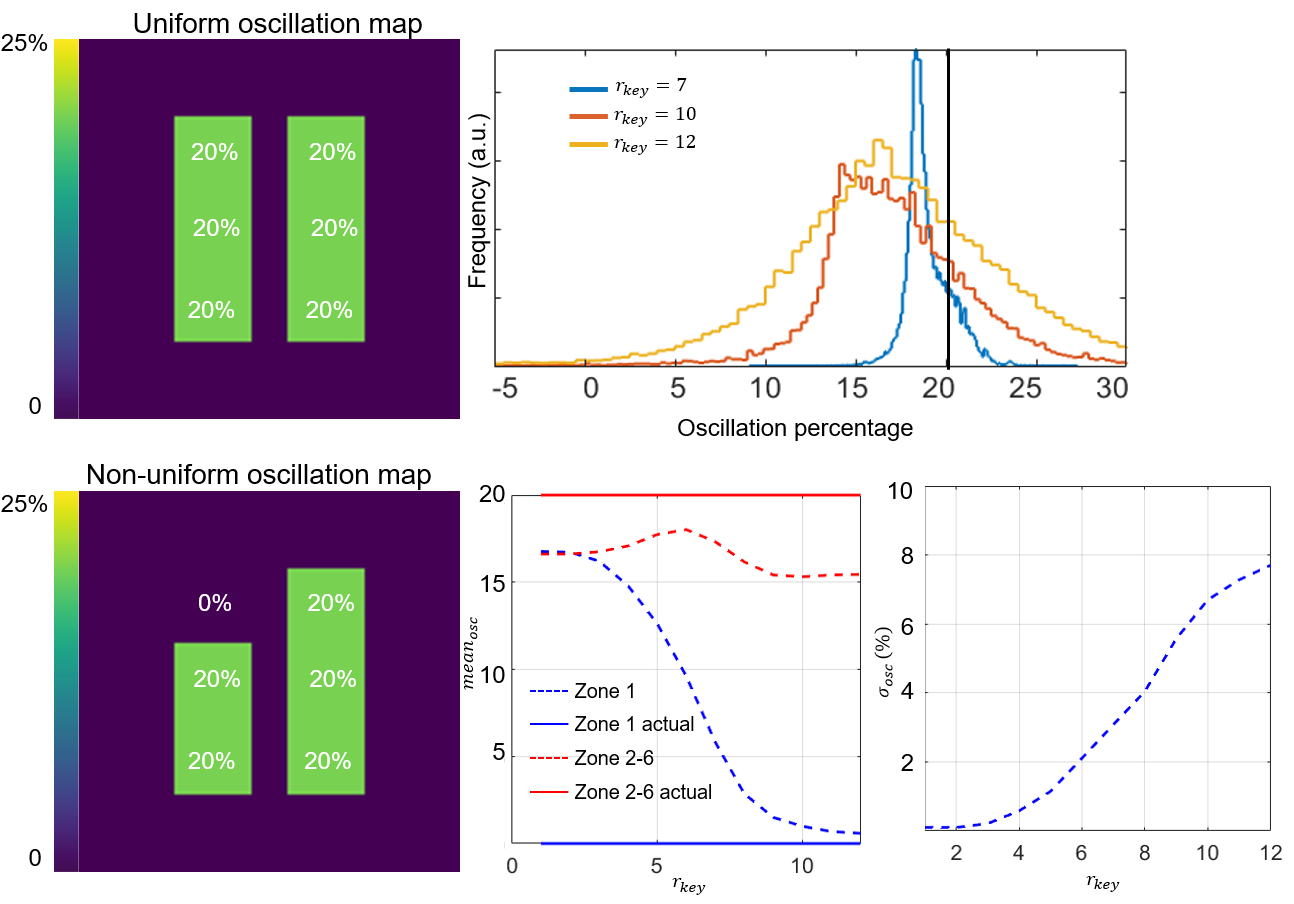
Figure 3. (Top) Effect of key radius on a phantom with uniform 20% oscillations sampled using 2,000 radial views. When using a key radius of 7 points, the oscillation histogram remains sharp and well-centered near 20%. As key radius is increased, the histogram broadens and shifts to lower values. (Bottom). Quantitative mean and standard deviation of a non-uniform oscillation map with zone 1 prescribed to have 0% and zones 2-6 20%. The recovered mean oscillation in zone 1 converges to the true value of 0% as key radius increases, but the standard deviation also increases.