4100
Estimation of Metabolite Signals for In Vitro MRI of Glycolytic Flow in Hyperpolarized Carbon-131Institute for Radiological Research, Chang Gung University, Taoyuan, Taiwan, 2Clinical Metabolomics Core Laboratory, Chang Gung Memorial Hospital, Linkou, Taoyuan, Taiwan, 3Department of Medical Imaging and Intervention, Chang Gung Hospital, Linkou, Taoyuan, Taiwan
Synopsis
Keywords: Data Processing, Hyperpolarized MR (Non-Gas), metabolites; apparent exchange rate; kinetic model
Downstream metabolites may have a poor SNR in hyperpolarized carbon-13 MRI, generating apparent exchange rate constant discrepancies when studying glycolytic flow in vivo or in vitro dynamically in real-time. We developed a method for estimating metabolite signal. This approach estimates metabolite signals using kinetic modeling and noise. The process was evaluated using simulations and in vitro studies. In vitro findings were also compared to 13C NMR cell media AUC. Comparing in vitro data from our method and NMR, both demonstrated consistency when uncertainty was included, suggesting that our method can accurately quantify metabolite signals and indicate how glycolytic flow changes.INTRODUCTION
Hyperpolarized carbon-13 MRI has the advantage of studying glycolytic flow in vivo or in vitro in real-time, dynamically1. The apparent exchange rate constant of the metabolite dynamic signal reflects metabolite changes in diseases2,3. Downstream metabolites may have a low signal-to-noise ratio (SNR), causing apparent exchange rate constant inconsistencies. Thus, we developed a method that estimates the metabolite signal to determine a suitable signal.METHODS
This method utilizes the kinetic model and background noise to estimate metabolite signals. The metabolite signal can be calculated by the MR theory4 and the kinetic model5. Typically, the MR metabolite received/observable signal, S'm, is the combination of true metabolite signal, Sm, and background noise, σbkg. S'm=Sm+σbkg, where σbkg is the estimated background noise, which might be a positive or negative value. The value and sign of background noise were estimated by Free Induction Decay (FID) signals and the maximum signal in the frequency domain. The apparent exchange rate constants of metabolites were estimated by fitting the solutions of Eq. (1) and (2) simultaneously. The processed signal in our method was calculated by updating the apparent exchange rate and the slope of signals iteratively.\[\frac{dP(t)}{dt}=-\Sigma_i k_{P,M_i} P(t)-\rho_1 P(t) (1)\]
\[\frac{dM_i(t)}{dt}= k_{P,M_i} P(t)-\rho_2 M_i(t) (2)\]
P(t) is the hyperpolarized signal of the substrate and Mi(t) is the downstream metabolite signal, where “i” represents each metabolite such as alanine or bicarbonate. The relaxation rates of ρ1 and ρ2 both in simulations and in vitro experiments were fixed.
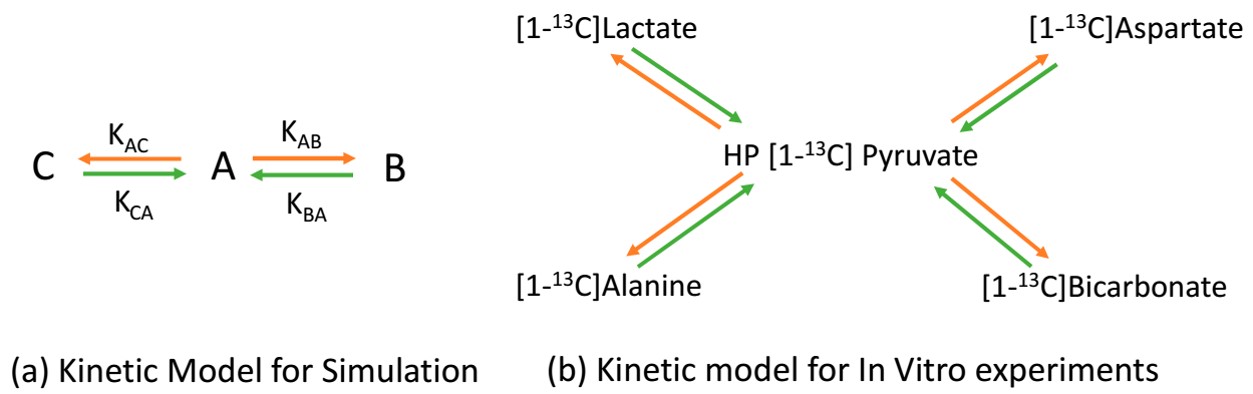
FID signals and Rician noise for three metabolites (A, B, and C) at 3T were simulated4. The metabolic signal evolutions in simulations and in vitro were based on the two-site exchange kinetic model shown in Figure 1a and 1b, respectively. In vitro studies, human FaDu squamous carcinoma cells were then separated into irradiated and control groups using 6-MV X rays from a linear accelerator: those that received 15 Gy radiation and those that did not. The experiments were repeated for the FaDu cancer cells(n = 3) in the irradiated and control groups.The cells were subsequently injected with 80 mM hyperpolarized [1-13C]Pyruvate (made by GE SPINlab) for 1 mL for 13C DNP-MRI (GE MR750w) scanning in the pulse-and-acquire sequence using a mouse coil (RAPID Biomedical). The cells were centrifuged to separate the media from the cell pellet after one hour of 13C DNP-MRI. Each cell line’s supernatants were diluted to 0.5 mL, half-mixed with a 13C NMR buffer (20 mM TSP/D2O), transferred to 5 mm NMR tubes, and the 13C and 1H spectra were then recorded using the Bruker 600 MHz NMR spectrometer.
RESULTS
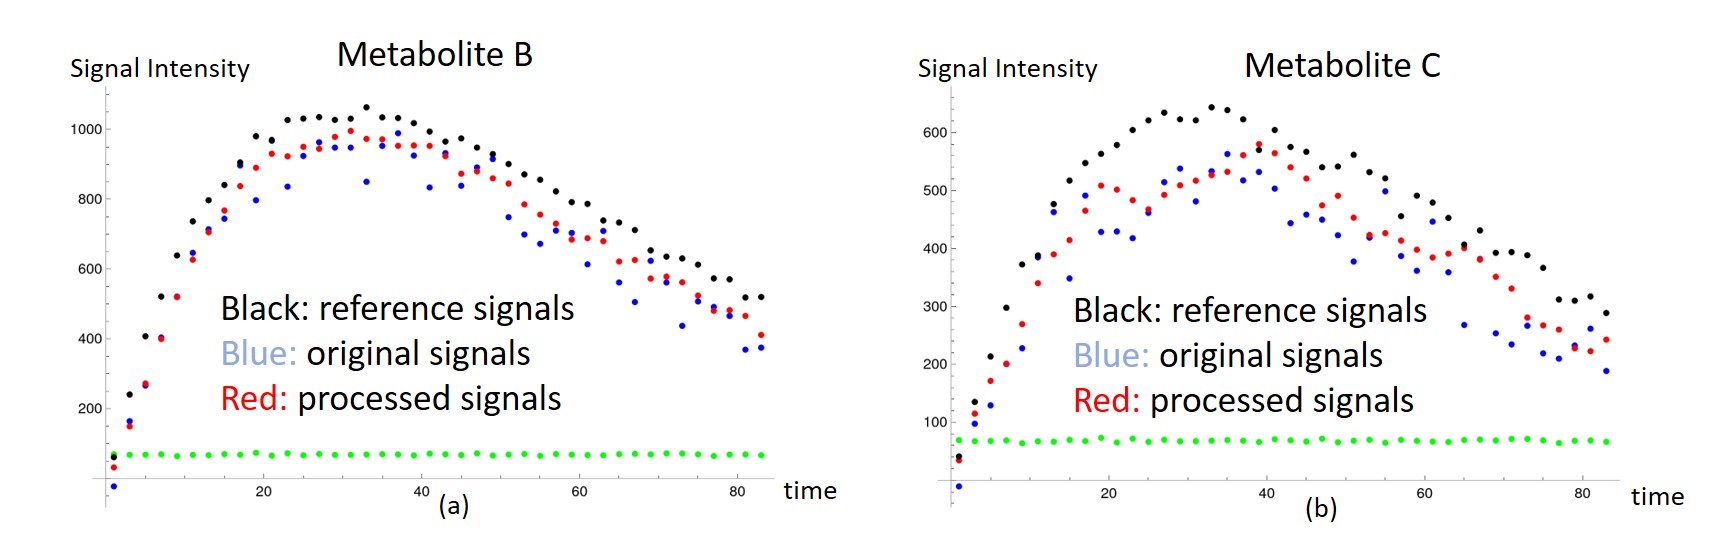
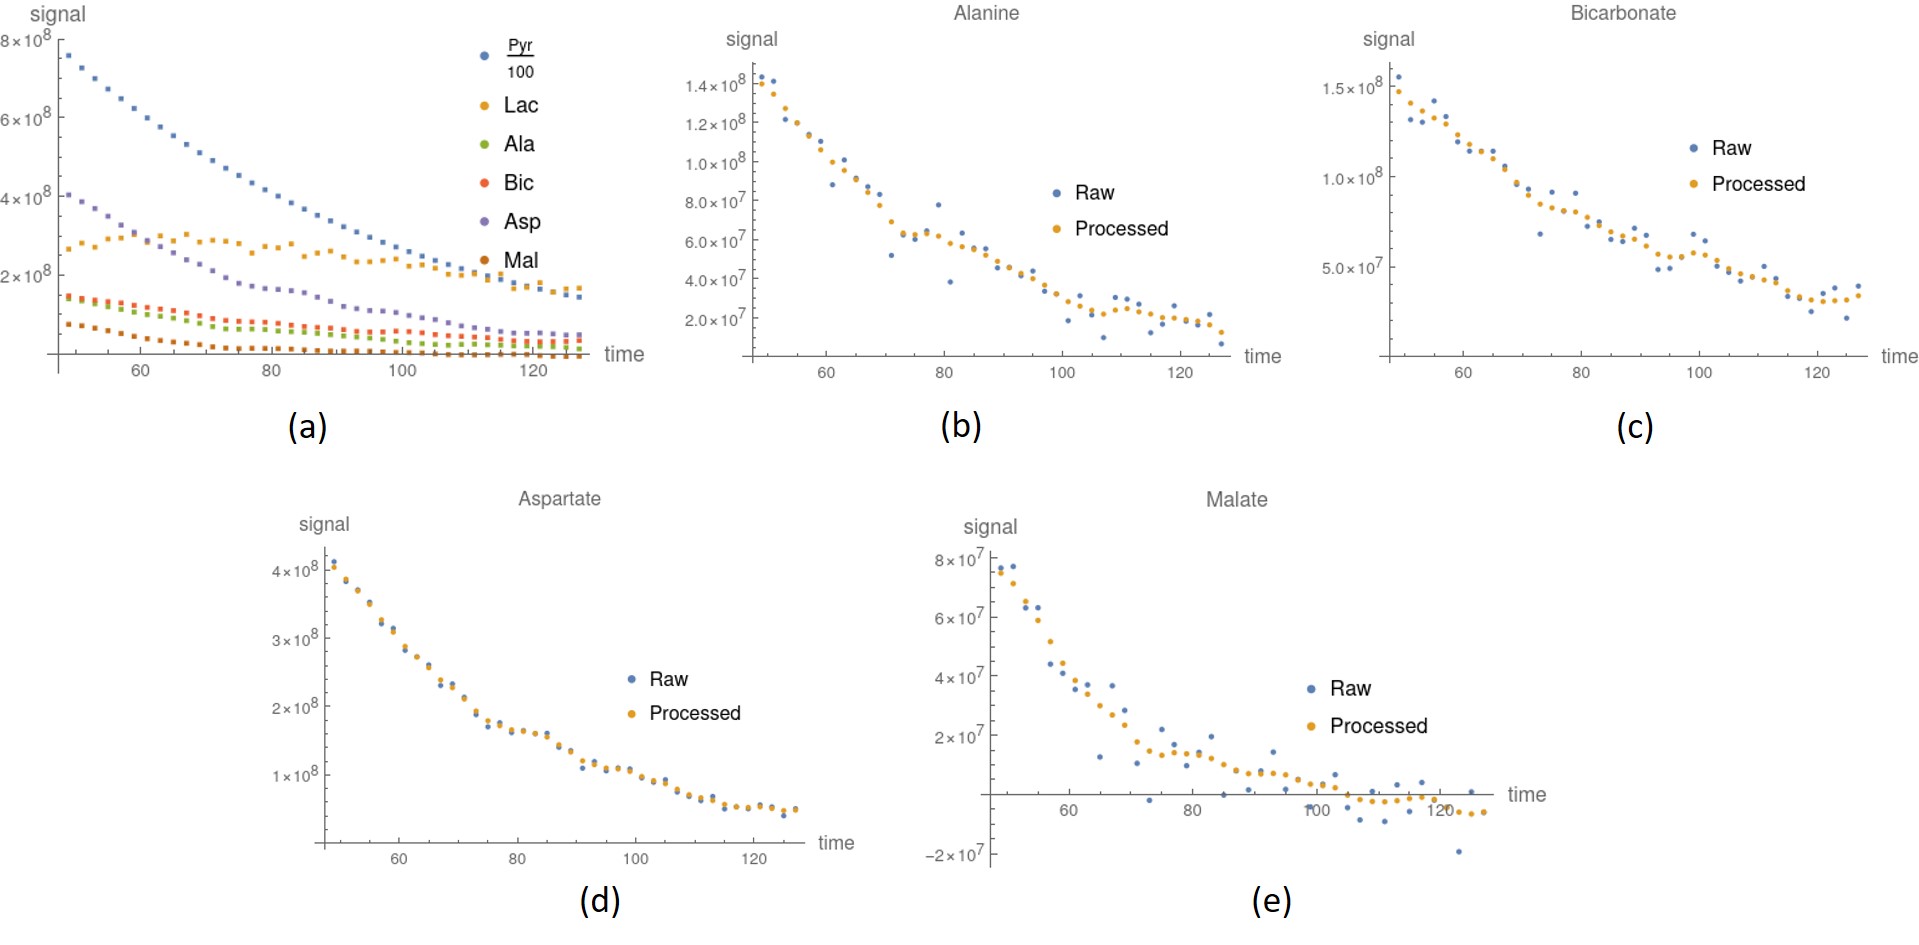
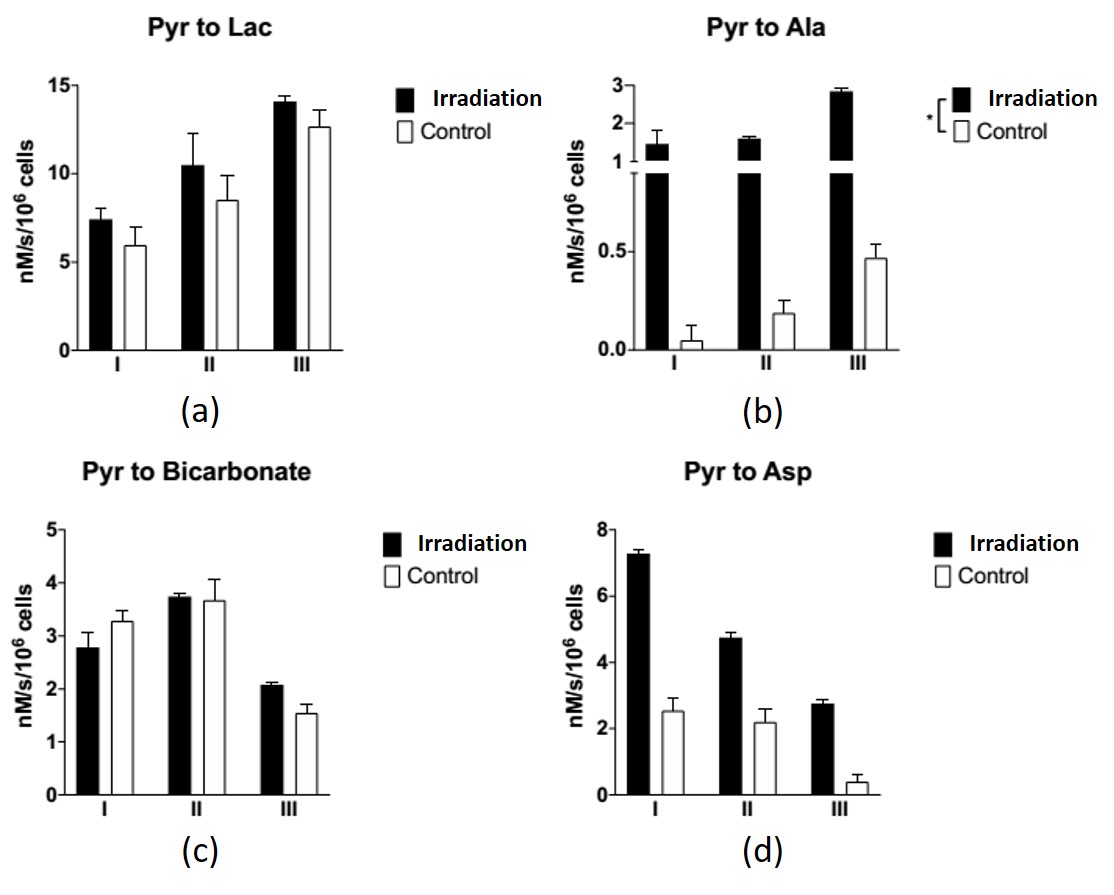
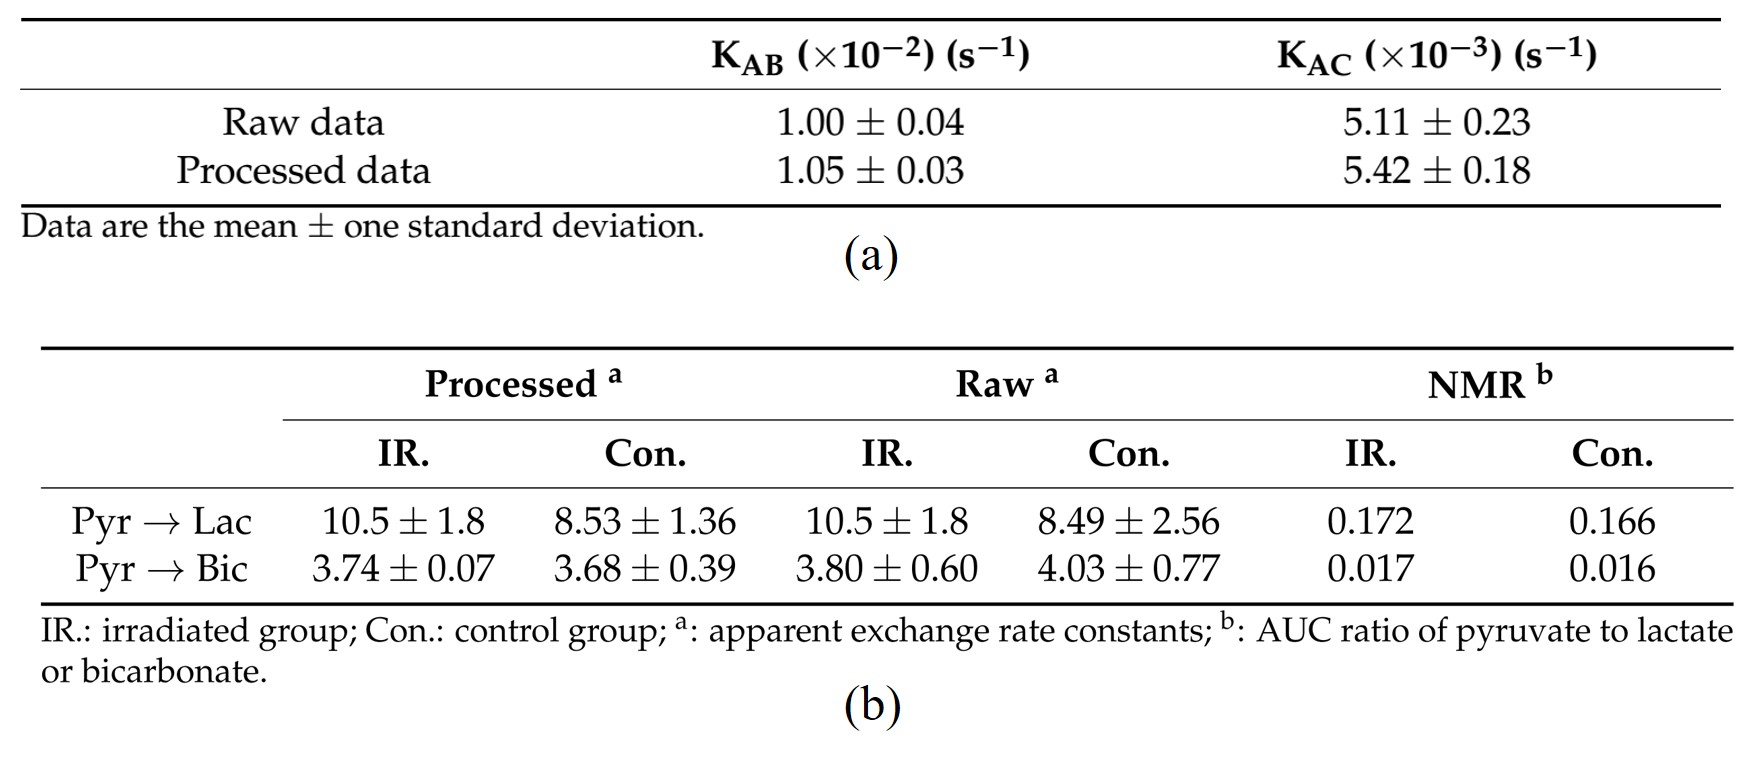
Simulation results show promising in our method. The black dots of metabolite signals B and C in Figure 2a,b were treated as the reference, and represent the small noise (high SNR) case. The blue and red dots in Figure 2a,b were the original and processed data of metabolite signals B and C, respectively, and represent the large noise (low SNR) case. The signal differences of metabolites B and C using our method were decreased by 44%, and 34%, respectively. It is clear that the signal corrections of metabolite B and C were improved by our method. Simulated and in vitro exchange rate constants by using our method were compared with those in raw signal values in Table 1a, and 1b, respectively. In vitro data were also compared to the AUC of the cell medium in Table 1b. Simulations and in vitro experiments show that our technique minimized metabolite signal fluctuations in Figure 2 and 3 and kept apparent exchange rate constants reliably in Table 1. In addition, the apparent exchange rate constants of metabolites showed differences between irradiation and control groups after using our method in Figure 4. Compared to the in vitro results obtained using our method and NMR in Table 1b, both solutions showed consistency when uncertainty is considered, supporting that our method can accurately measure metabolite signal and show how glycolytic flow changes.DISCUSSION
Our method has demonstrated a reduction in signal fluctuations in low-SNR cases by utilizing the features of the kinetic model and background noise. The apparent exchange rate constants were fitted using the processed signals, and the results of the metabolites were consistent with the expected values obtained from the simulations and in vitro studies. The advantage of this method is that it estimates signals directly. When the signal variation of the downstream metabolites is similar to the fluctuation of the background noise, the estimated signal will have a large discrepancy. From empirical observation of the simulations and in vitro data, the obtained kinetic rate of an individual metabolite was not a reasonable value for the majority of SNRs below five. Prior to using this method, the metabolic pathway needs to be known in advance to properly apply the kinetic model, and it is best to measure generic metabolites with NMR or high-field MRI.CONCLUSION
Simulations and in vitro experiments indicate that our method for estimating the signals of downstream metabolites from HP [1-13C]pyruvate shows promising for improving accuracy. This method improved the signals of metabolites and elucidated the metabolic phenotyping of tumor cells, which may have future applications in personalized medicine and patient stratification.Acknowledgements
The 1H and 13C measurements of NMR were acquired by Chi-Jen Lo, Metabolomics Core Lab. (600 MHz NMR), Healthy Aging Research Center in Chang Gung University. HP 13C cell data acquisition was implemented by Wen Yen Chai in Chang Gung Memorial Hospital. The human FaDu squamous carcinoma cells and the cell irradiation were supported by Radiation Research Core Laboratory of Institute for Radiological Research, Chang Gung University/Chang Gung Memorial Hospital, Linkou.References
1. Larson, S.M. and L.H. Schwartz, 18F-FDG PET as a candidate for "qualified biomarker": Functional assessment of treatment response in oncology. Journal of Nuclear Medicine, 2006. 47(6): p. 901-903.
2. Menzel, M.I., et al., Multimodal Assessment of In Vivo Metabolism with Hyperpolarized [1-13C] MR Spectroscopy and 18F-FDG PET Imaging in Hepatocellular Carcinoma Tumor–Bearing Rats. Journal of Nuclear Medicine, 2013. 54(7): p. 1113-1119.
3. Saito, K., et al., 13C-MR Spectroscopic Imaging with Hyperpolarized [1-13C]pyruvate Detects Early Response to Radiotherapy in SCC Tumors and HT-29 Tumors. Clinical Cancer Research, 2015. 21(22): p. 5073-5081.
4. Ratakack, M.T. and VanOstenburg, D.O., Computer Simulation Teaches Fourier Transform NMR. Computers in Physics Education, 1994. 8(3): p. 279-285. 24.
5. Daniels, C.J., et al., A comparison of quantitative methods for clinical imaging with hyperpolarized 13C-pyruvate. NMR in Biomedicine, 2016. 29(4): p. 387-399.
6. Yoshihara, H.A.I.; Comment, A.; Schwitter, J. Assessment of Aspartate and Bicarbonate Produced From Hyperpolarized [1-13C]Pyruvate as Markers of Renal Gluconeogenesis. Front. Physiol. 2021, 12, 792769
Figures