4099
Improved Dynamic In Vivo pH Imaging Using Hyperpolarized 13C-bicarbonate1Department of Radiology & Biomedical Imaging, University of California, San Francisco, San Francisco, CA, United States, 2Department of Medical Imaging and Intervention, Chang Gung Memorial Hospital at Linkou, Taiwan, Taiwan
Synopsis
Keywords: Data Acquisition, Hyperpolarized MR (Non-Gas)
We present a dynamic pH measurement using metabolite-specific gradient-echo spiral sequence with flow suppression to improve the SNR of bicarbonate and CO2 with short T2* and used bipolar gradients to suppress the high bicarbonate signal in the vessel. With the improved image quality and high temporal resolution, it is possible to measure the dynamic pH in vivo. Future studies will work to increase the sample size to confirm these results.Introduction
Acid-base balance is a critical signal present in many pathological states, such as inflammation, ischemia, cancer, and renal disease.1 The extracellular pH is mainly controlled by the interconversion between bicarbonate and carbon dioxide (CO2).2 Prior work has shown that in vivo pH can be imaged with hyperpolarized 13C-bicarbonate.3,4 However, administration of the 13C-bicarbonate bolus and the pH of the injected solution may affect tissue pH, making dynamic pH measurements desirable to observe these effects. Dynamic imaging is challenging due to the non-renewable hyperpolarized 13C-bicarbonate that experiences T1 relaxation(~60s) and short T2* relaxation(~65ms)5. Additionally, there are high 13C-bicarbonate signal from large vessels leading to Gibbs ringing and motion-induced image artifacts, which may decrease the accuracy of pH imaging. To overcome these limitations, in this study, we designed a dynamic metabolite-specific gradient echo (MS-GRE) spiral sequence with a flow suppression technique6 to analyze the dynamic pH imaging with hyperpolarized 13C-bicarbonate on the rat kidneys and mouse tumor.Methods
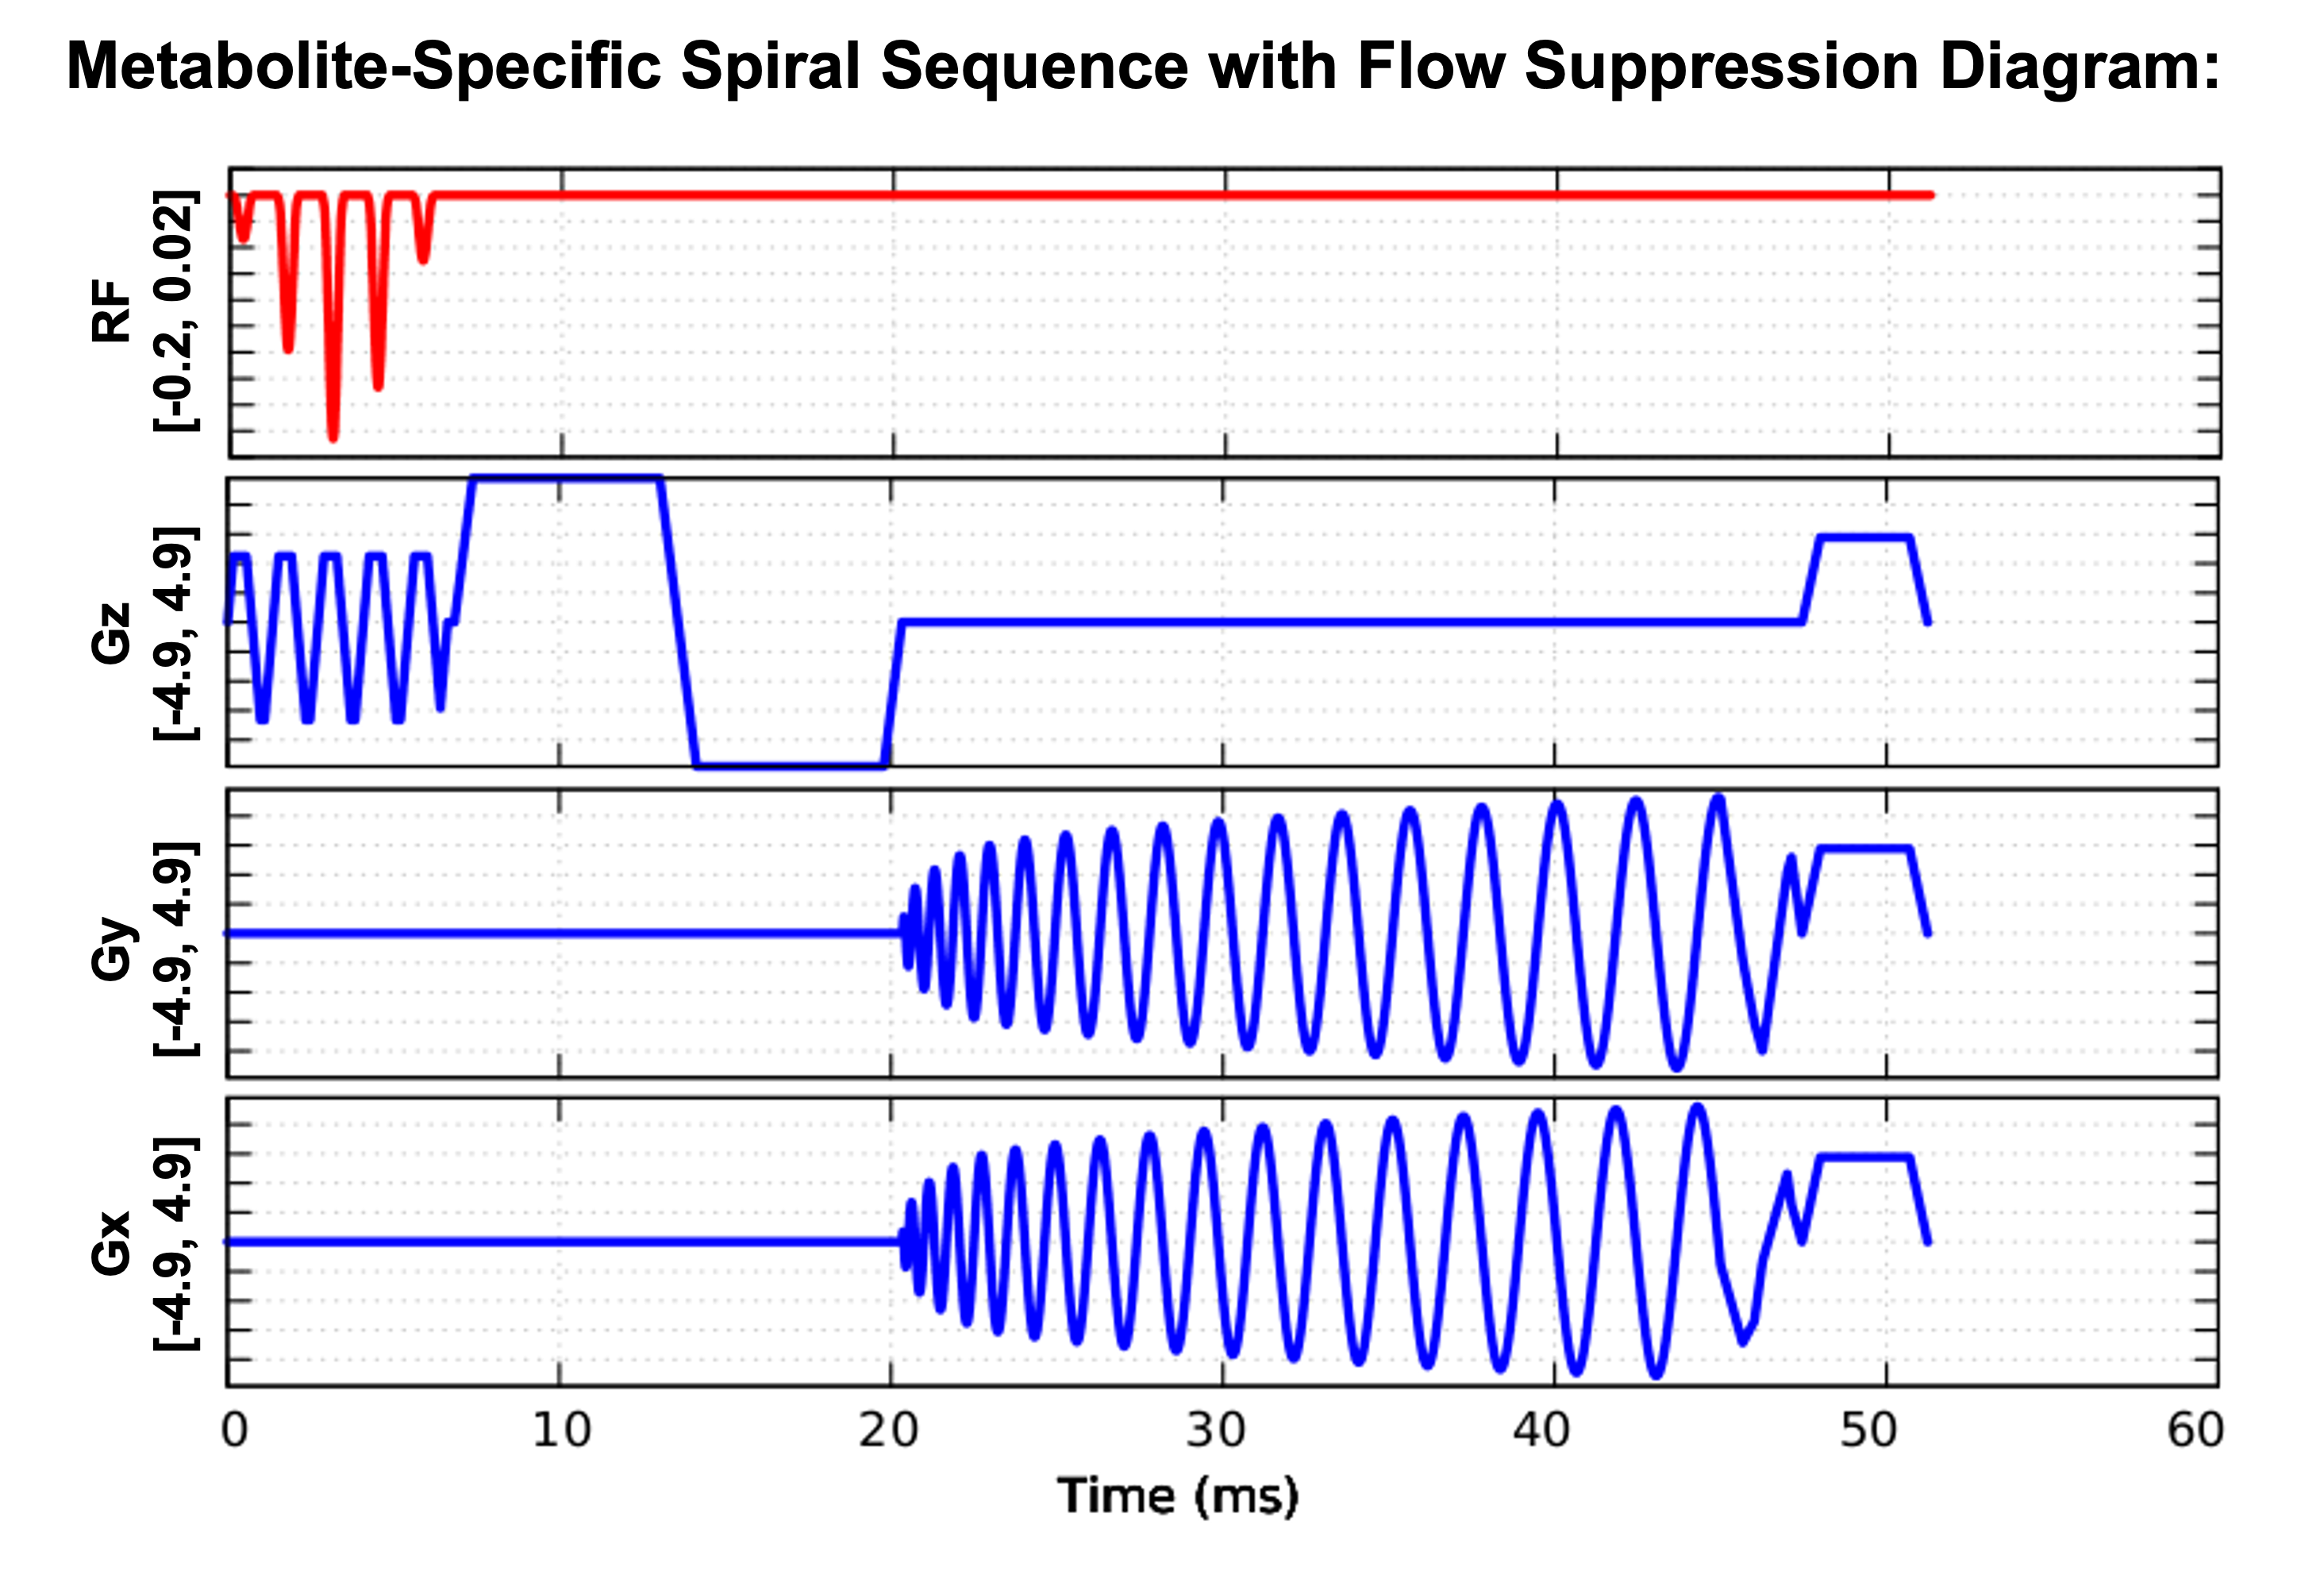
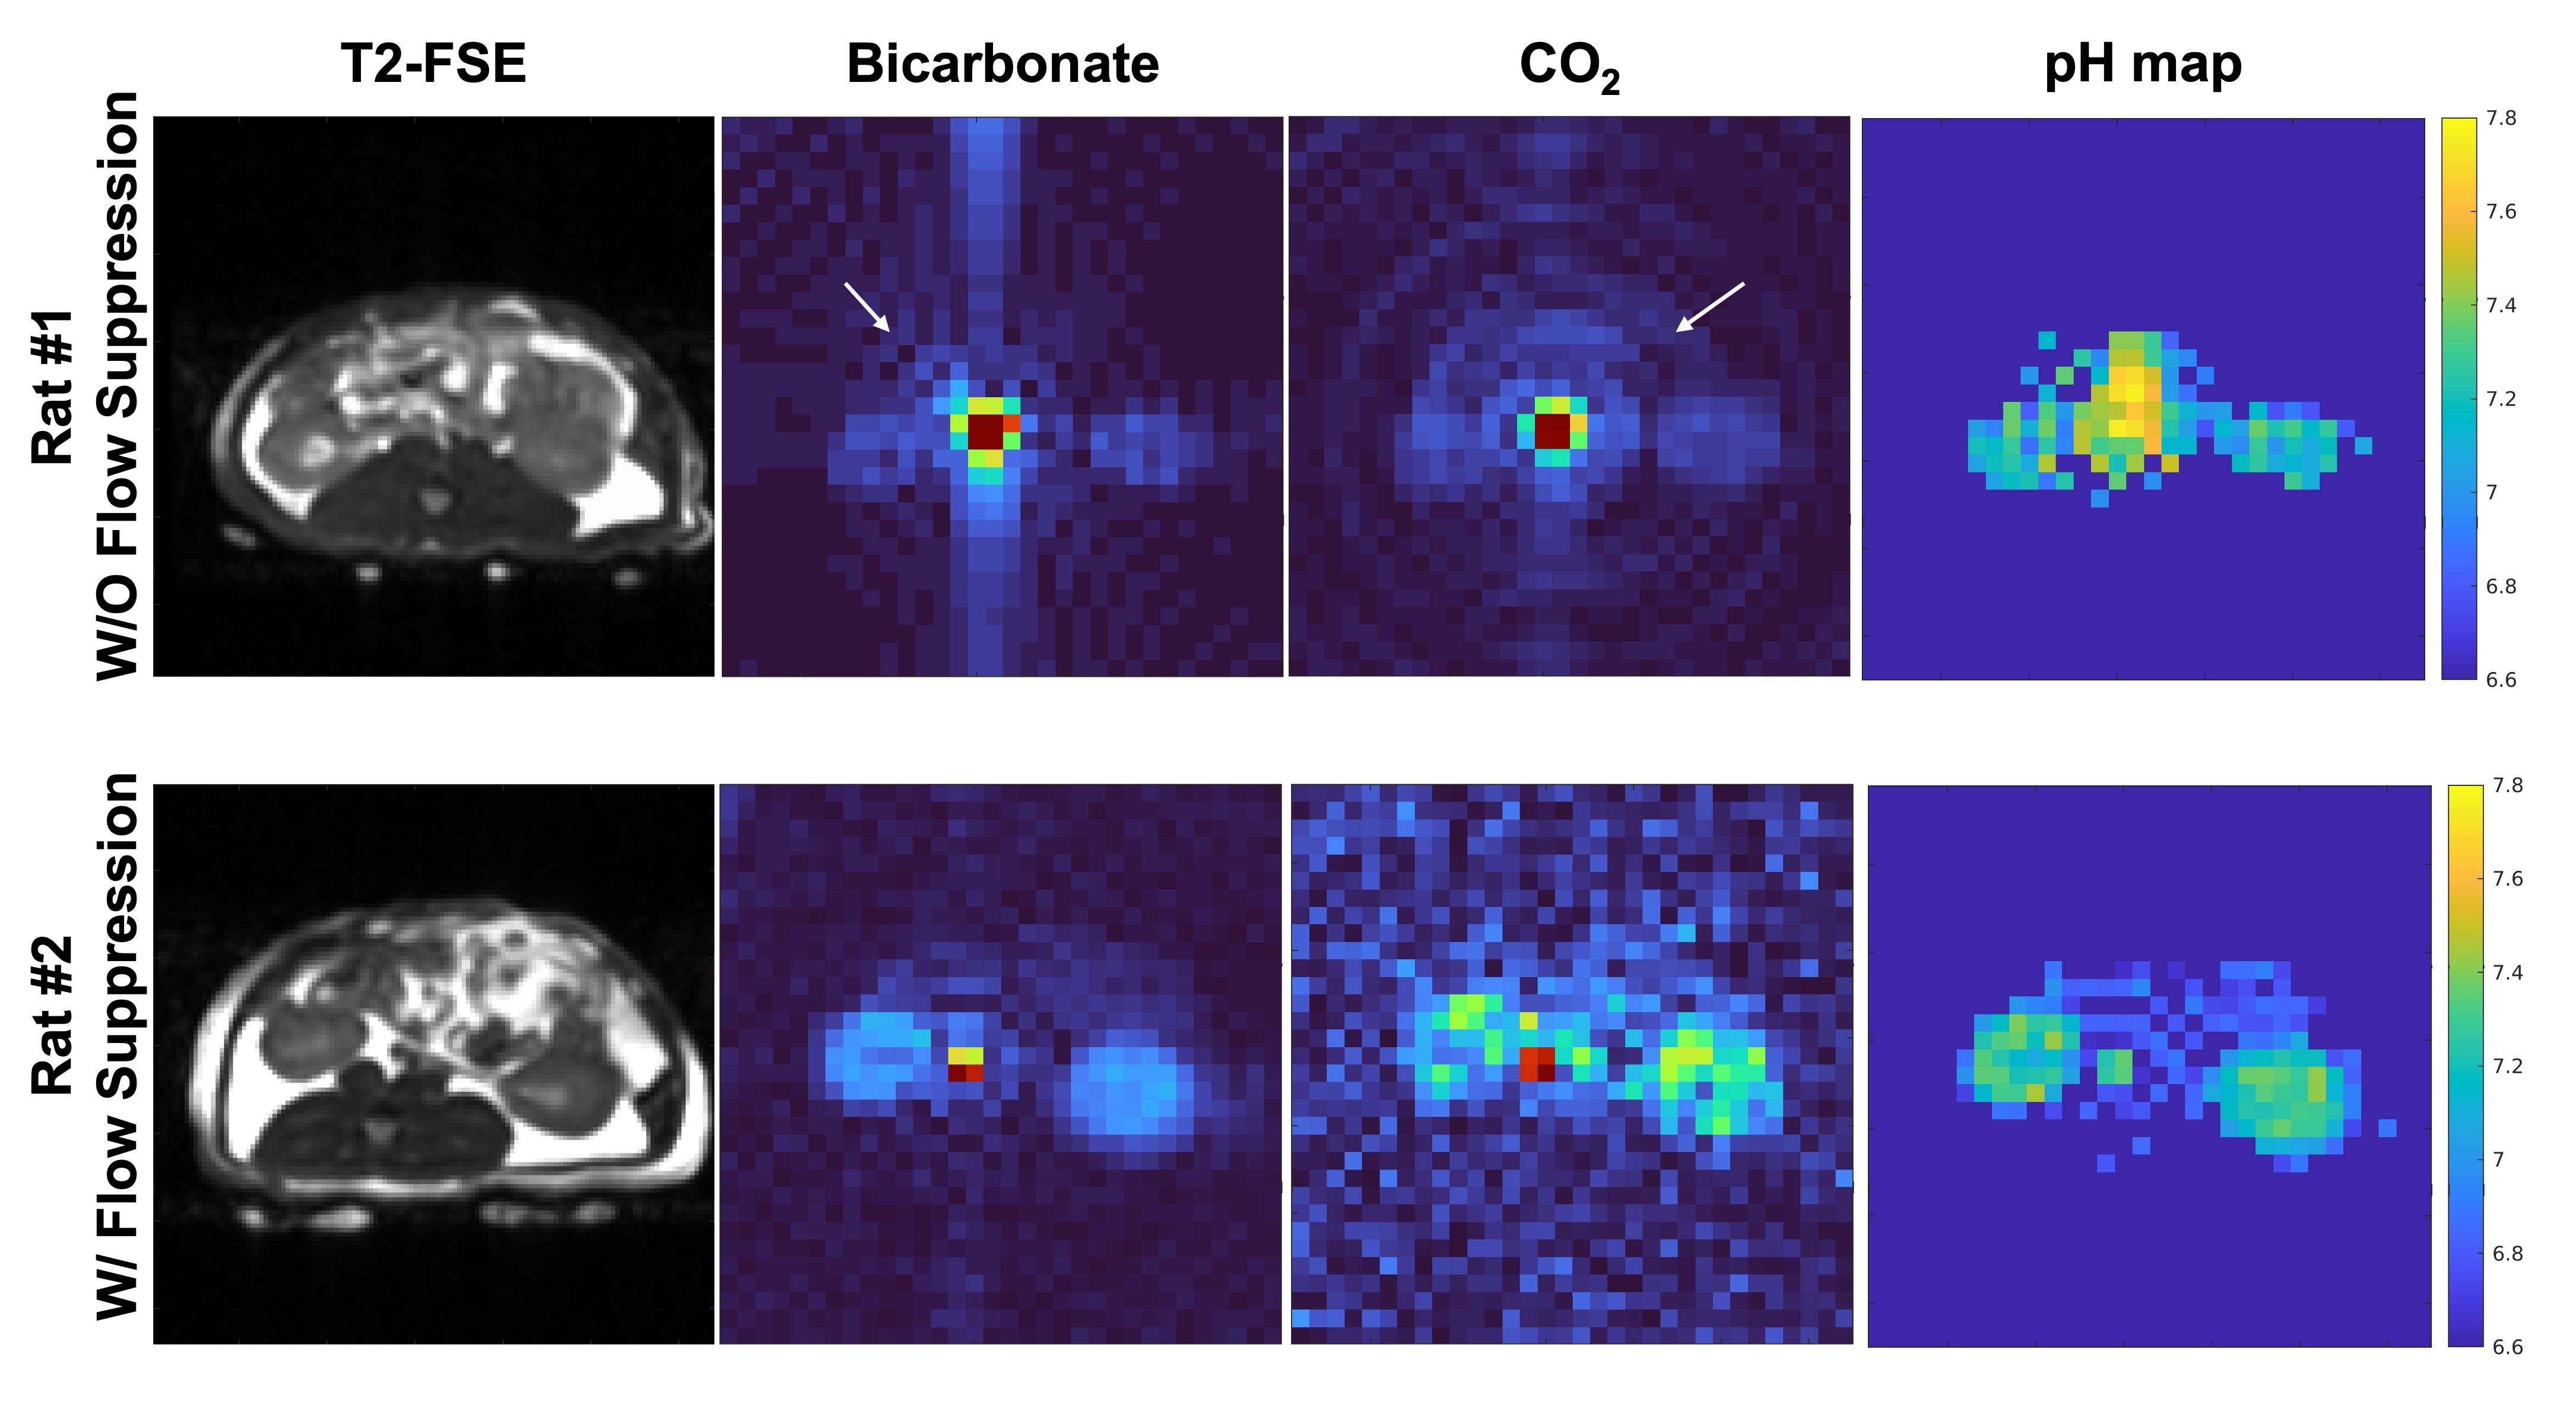
Sequence: The MS-GRE spiral sequence with flow suppression was implemented on a 3T clinical GE MRI scanner (MR750, GE Healthcare, Waukesha, WI) using RTHawk scanner control software (HeartVista, CA). We added a bipolar gradient in the main arterial flow direction (S/I) between spectral-spatial selective pulse and spiral readout to suppress the vascular bicarbonate and CO2 signals.Sprague-Dawley (SD) rat renal study (N = 2): The SD rat studies were performed on kidneys of three healthy Sprague-Dawley rats. Data were acquired by a 1H/13C transceiver single-channel birdcage coil. The hyperpolarized 13C-bicarbonate (2.5mL, pH = ~7.8) was injected via tail vein in 12s, and the acquisition started at 3s since injection began. Acquisition parameters: FOV = 8$$$\times$$$8 cm2, resolution = 2.5$$$\times$$$2.5 mm2, slice thickness = 2 cm, flip angle = 45°(CO2) and 10°(bicarbonate). At each timepoint, the acquisition order is CO2-bicarbonate, with a 0.4s temporal resolution (0.2s/metabolite). We used the MS-GRE spiral sequence without flow suppression gradient for the Rat #1 and with flow suppression gradient (b = 23s/mm2) for Rat #2.
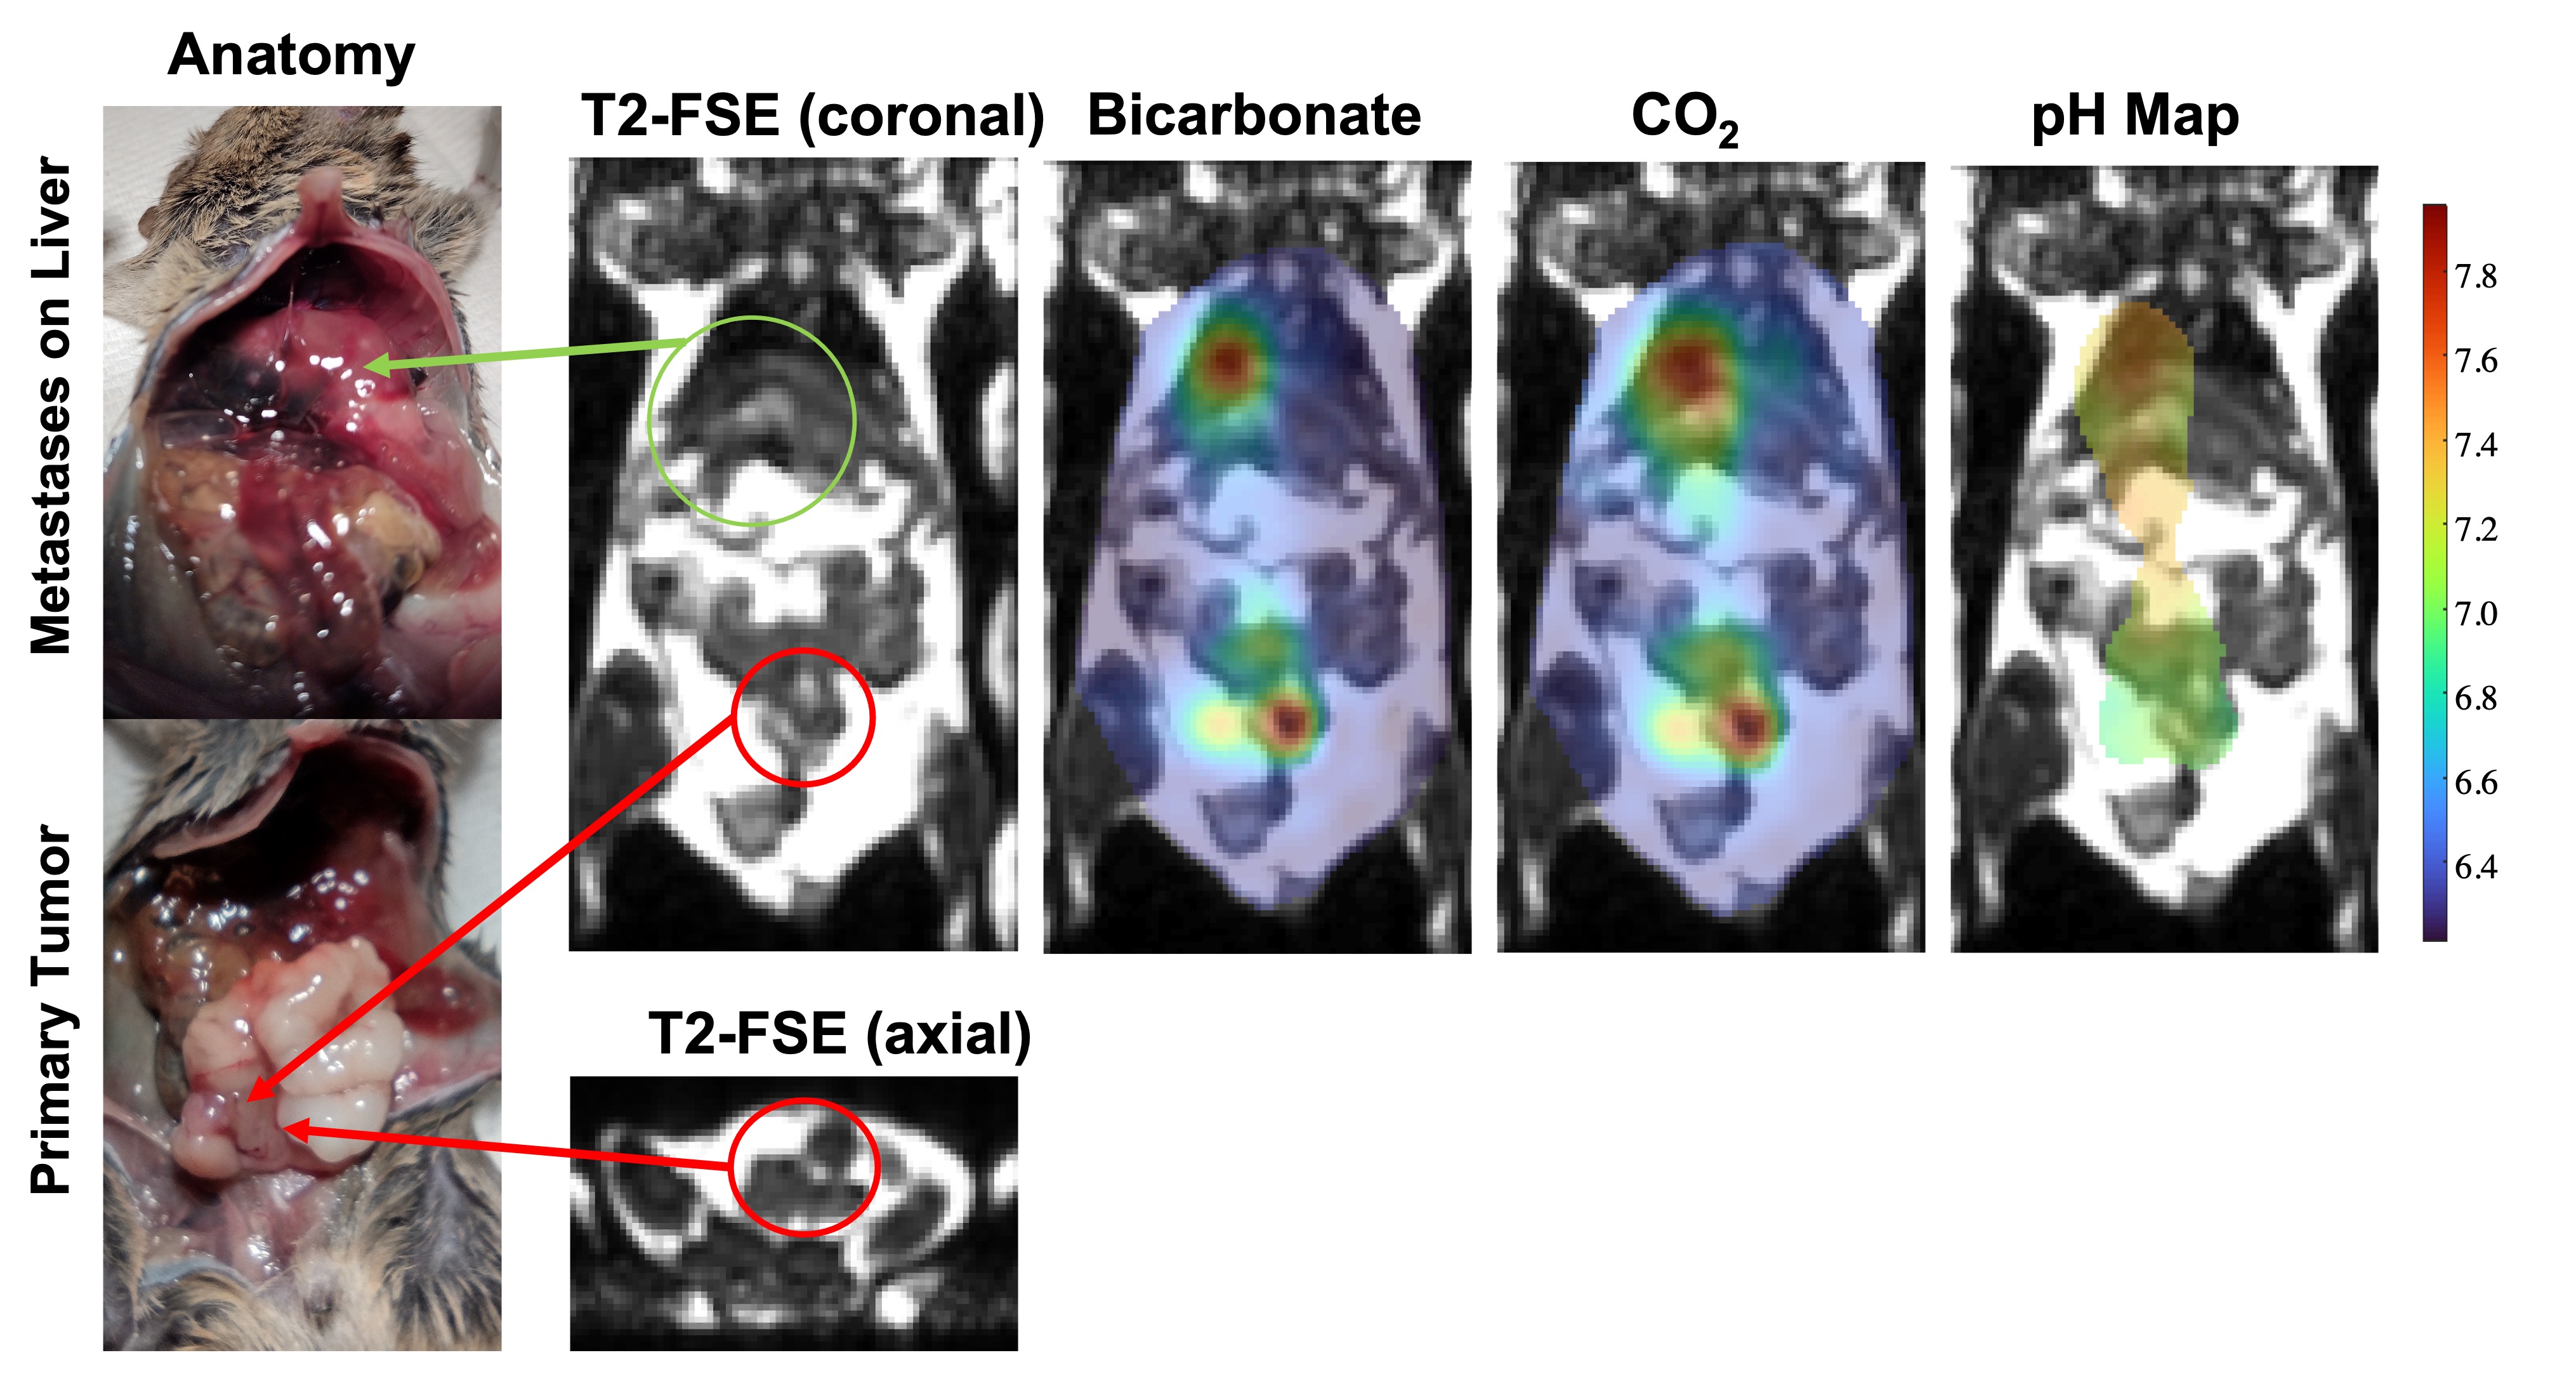
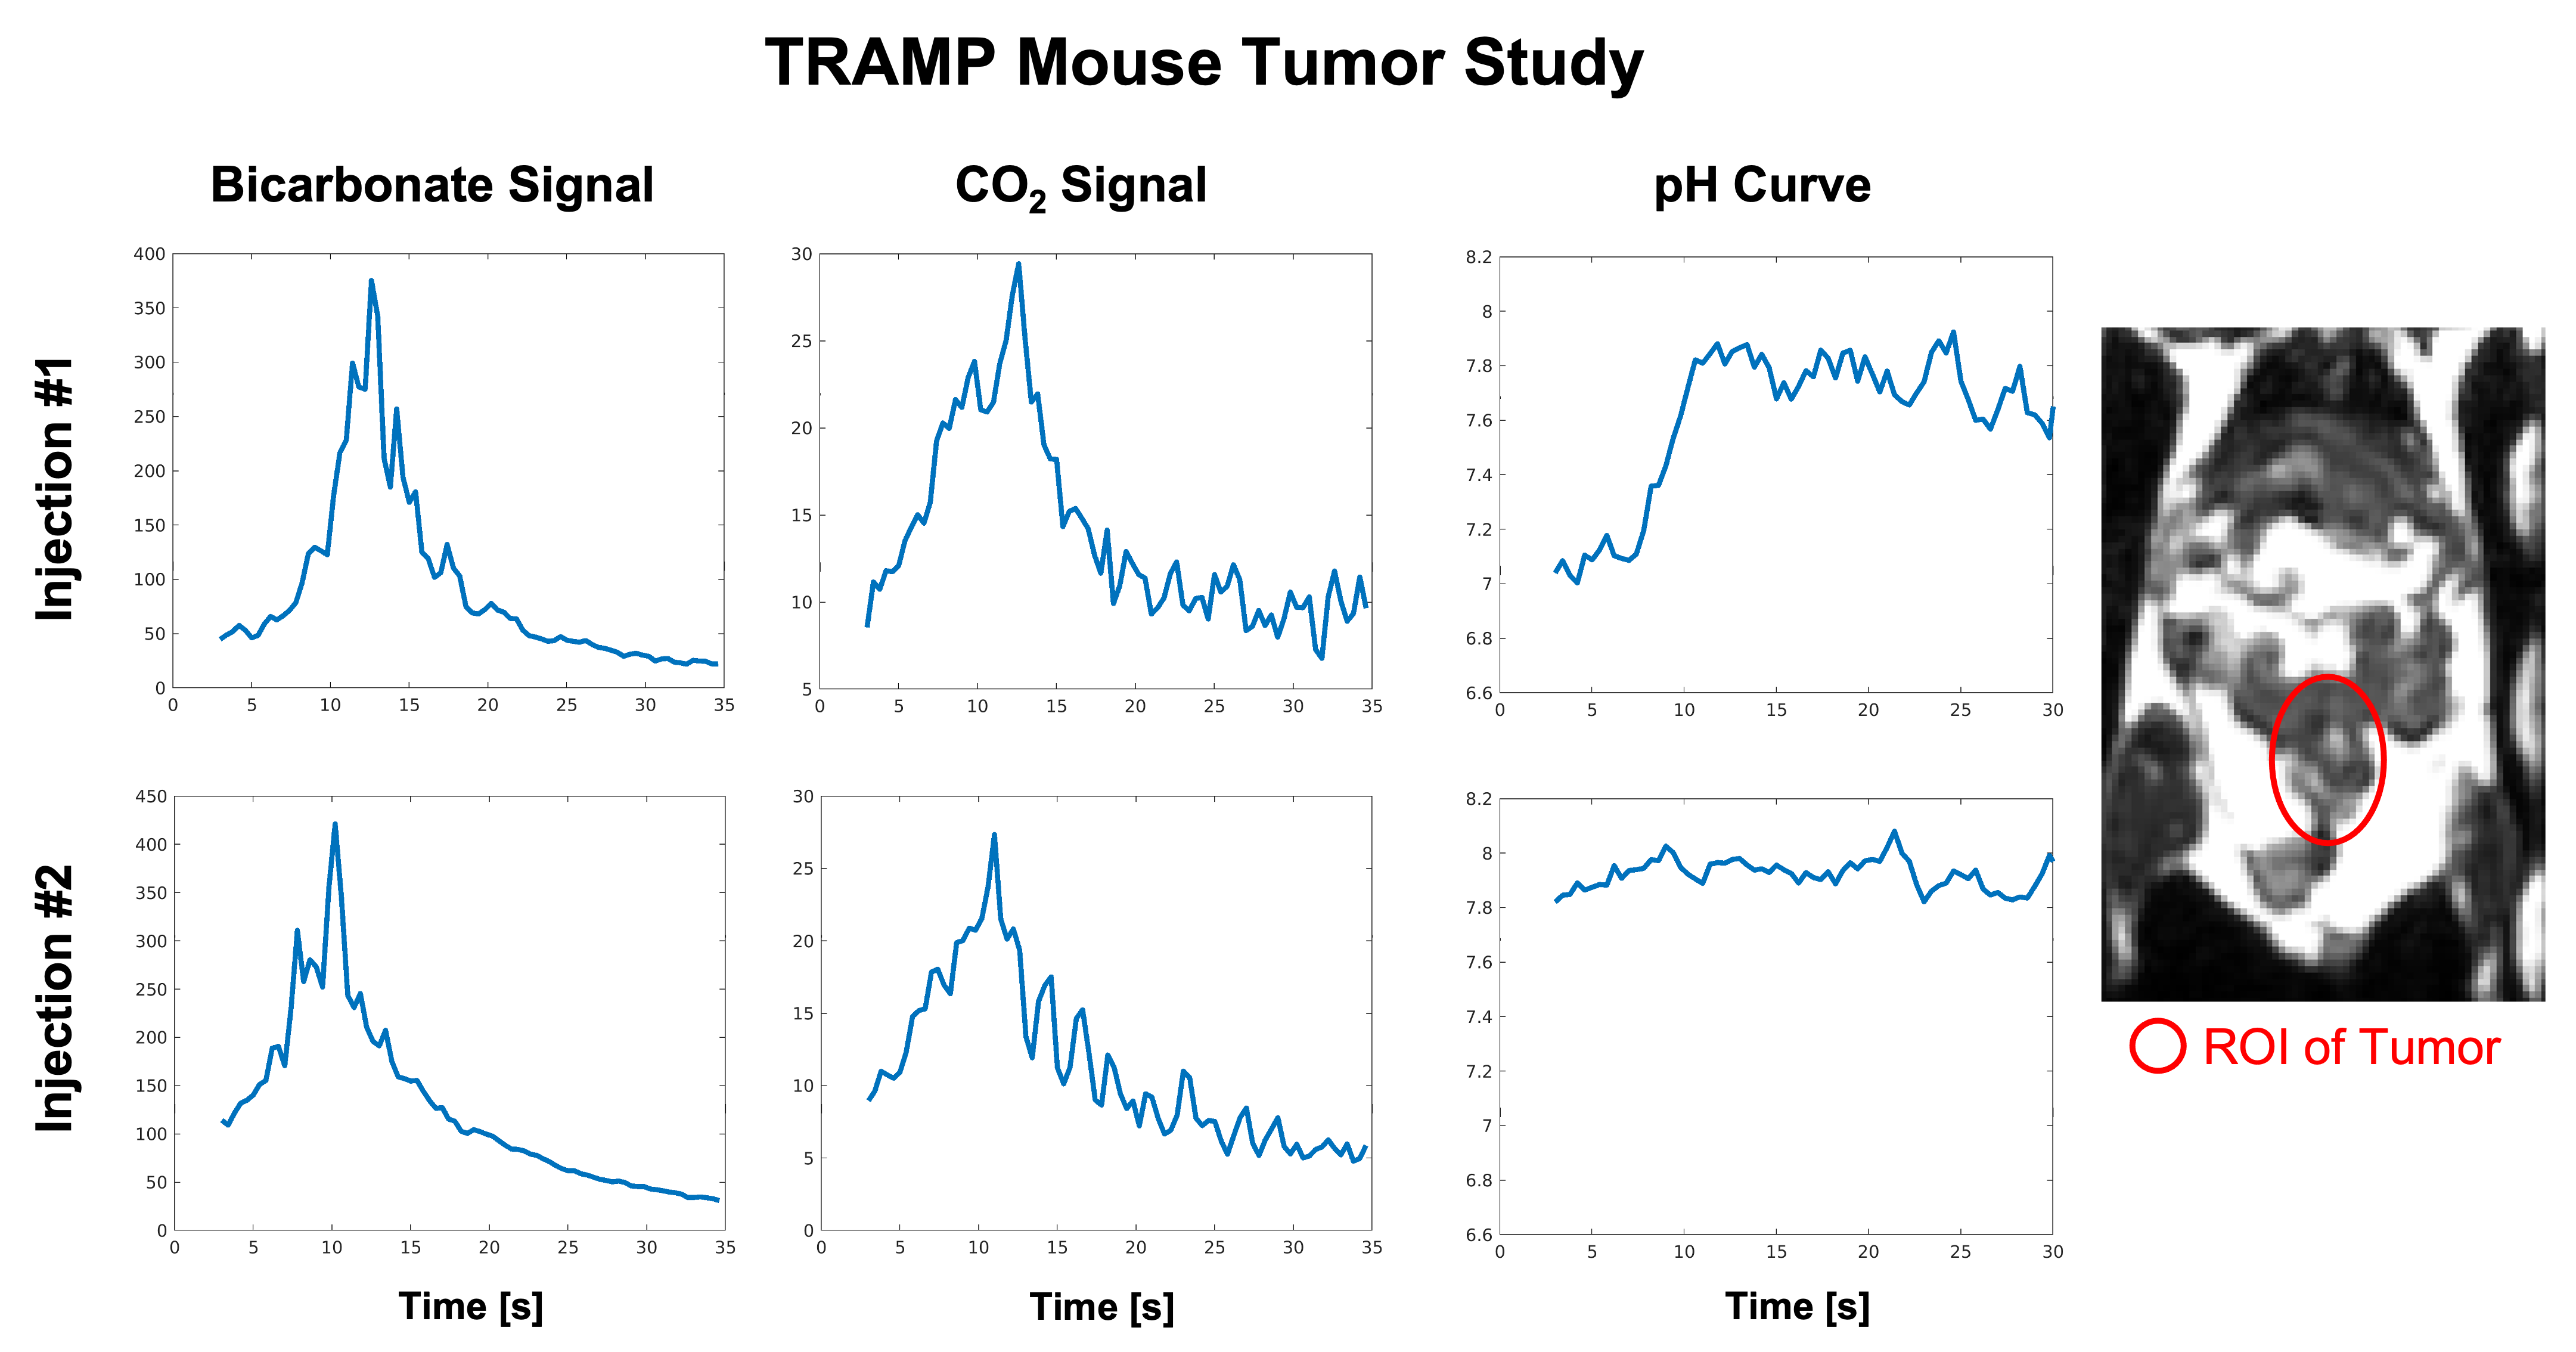
Transgenic Adenocarcinoma of the Mouse Prostate (TRAMP) tumor study (N = 1): Data were acquired with a 1H/13C dual-tune mouse volume coil. The acquisition was in the coronal plane with slice thickness = 1.5 cm and higher flow suppression (b = 50s/mm2); all parameters are the same as the rat studies. To monitor the pH change of the tumor, the TRAMP mouse received two injections (0.2mL) separated by 15 minutes with the same regimen (pH = ~7.8).
Data Reconstruction and Analysis: HP 13C data were reconstructed by directly inverse Fourier transformed to the image domain after gridding7. The dynamic pH curve was calculated by the mean signal of region-of-interest (ROI) at each time point, using Henderson-Hasselbalch equation3. ROIs were manually drawn over the primary tumor of the TRAMP mouse based on the proton images.
Results and Discussion
Figure 2 shows the comparison of images acquired by the MS-GRE spiral sequence without and with flow suppression gradient. Both bicarbonate and CO2 images exhibit ring-like aliasing artifacts due to the high aorta vessel signal of bicarbonate, which leads to errors in pH quantification in the adjacent kidneys. With the flow suppression gradient, the vascular signal is substantially reduced and both bicarbonate and CO2 images had no ringing artifacts, improving the pH quantification in the kidneys. For the Rat #2, the pH of renal cortex and medulla of right kidney are 7.31±0.08 and 7.15±0.04, which agrees with the value in the literature.Figure 3 shows 13C-bicarbonate and CO2 AUC images of TRAMP mouse tumor model. Both primary tumor and metastasis were shown as high signal focus on 13C-bicarbonate and CO2 AUC images. The different 13C uptake pattern of the primary tumor may reflect the intratumoral heterogeneity. Moreover, the conspicuity of the liver metastasis is greatly improved with 13C imaging, which is barely discernible on proton images. It indicates the MS-GRE spiral sequence can image both 13C-bicarbonate and CO2 on the tumors without artifacts.
Figure 4 shows the dynamic tumor pH curves of TRAMP mouse with two repeated injections. In the first injection, pH of tumor increases from ~7 to 7.8 in the first 10s and did not later decrease. In the second injection, pH of tumor keeps constant at ~7.8. This suggests the tumor cannot control the pH and pH of the injected solution can change the pH of the tissue in a while.
Compared with the bicarbonate images, the CO2 images had lower SNR despite the metabolite-specific flip angles used. This is expected based on the equilibrium levels of bicarbonate at CO2 for physiologic pH ranges. Meanwhile, adding the bipolar gradient creates a tradeoff between suppressing the high flow signal/artifacts and SNR. Using a spiral readout was advantageous for this 13C probe to reduce the echo time to improve the SNR of CO2 signal.
Conclusion
This study used MS-GRE spiral to improve the SNR of bicarbonate and CO2 with short T2* and used bipolar gradients to suppress the high bicarbonate signal in the vessel. With the improved image quality and high temporal resolution, it is possible to measure the dynamic pH with high temporal resolution in vivo. Future studies will work to increase the sample size to confirm these results.Acknowledgements
This work was supported by the NIH grants R21DK130002, R01CA249909, P41EB013598, American Cancer Society131715-RSG-18-005-01-CCE, Department of Defense W81XWH-19-1-0866 (PC180733).References
1. Finelli A, Ismaila N, Bro B, et al. Management of small renal masses: American society of clinical oncology clinical practice guideline. Journal of Clinical Oncology. 2017;35(6):668-680. doi:10.1200/JCO.2016.69.9645
2. O H N Me L L A N B Y J. T h r o m b a s E-I t s Preparation and Properties.; 2022. https://royalsocietypublishing.org/
3. Gallagher FA, Kettunen MI, Day SE, et al. Magnetic resonance imaging of pH in vivo using hyperpolarized 13C-labelled bicarbonate. Nature. 2008;453(7197):940-943. doi:10.1038/nature07017
4. Korenchan DE, Gordon JW, Subramaniam S, et al. Using bidirectional chemical exchange for improved hyperpolarized [13C]bicarbonate pH imaging. Magn Reson Med. 2019;82(3):959-972. doi:10.1002/mrm.27780
5. Ma J, Chen J, Reed GD, et al. Cardiac T2∗ measurement of hyperpolarized 13C metabolites using metabolite-selective multi-echo spiral imaging. Magn Reson Med. 2021;86(3):1494-1504. doi:10.1002/mrm.28796
6. Gordon JW, Niles DJ, Adamson EB, Johnson KM, Fain SB. Application of flow sensitive gradients for improved measures of metabolism using hyperpolarized 13c MRI. Magn Reson Med. 2016;75(3):1242-1248. doi:10.1002/mrm.25584
7. Jackson JI, Meyer CH, Nishimura DG, Macovski A. Selection of a Convolution Function for Fourier Inversion Using Gridding. IEEE Trans Med Imaging. 1991;10(3):473-478. doi:10.1109/42.97598
8. Raghunand N, Howison C, Sherry AD, Zhang S, Gillies RJ. Renal and systemic pH imaging by contrast-enhanced MRI. Magn Reson Med. 2003;49(2):249-257. doi:10.1002/mrm.10347
Figures