4095
Rapid Radiofrequency Coil Prototyping for Hyperpolarized Carbon-13 Imaging1University of Pennsylvania, Philadelphia, PA, United States
Synopsis
Keywords: Data Acquisition, Non-Array RF Coils, Antennas & Waveguides
Dynamic nuclear polarization magnetic resonance spectroscopic imaging (DNP-MRSI) of hyperpolarized carbon-13 (HP 13C) is an exciting new imaging technique that provides valuable information about the metabolism of disease states. Though there are many hyperpolarized substrates that can be used to investigate metabolism in a variety of models, the application of this technology often requires custom radiofrequency (RF) coil design. Furthermore, different coils within the same project may provide different results. In this study, we utilized 3D printing molds to generate inductors along with printed circuit board (PCB) designs to create a high reproducibility (<1% variation) pipeline for MR coils.Introduction
Dynamic nuclear polarization magnetic resonance spectroscopic imaging (DNP-MRSI) of hyperpolarized carbon-13 (HP 13C) is a rapidly evolving noninvasive imaging method which enables in-vivo real-time measurements of a variety of metabolic pathways. The metabolic information gained from HP imaging can be used to select therapeutics that target pathways which various disease states are more dependent upon, and avoid therapies that target less relevant pathways. Recently, our group has shown that metabolic imaging can detect latent Hepatocellular Carcinoma (HCC) after administered locoregional therapy (1). We have also identified many more metabolic probes that can be studied and applied to imaging metabolism in many disease states (2).Despite this utility, challenges associated with design requirements for the radiofrequency coils necessary for each application may limit the application of this technology. Differences in the size or location of the tumor or organ being imaged may require different coil configurations including a single turn or surface coil inductor or a multi-turn solenoid. To address this challenge, we developed a rapid prototyping pipeline to design and construct custom 13-Carbon RF coils. We utilized 3D printing technology and a simple printed circuit board (PCB) design to ensure reproducibility of both the inductor design and RF circuit design.
Methods
The PCB design was based on a simple parallel LC-resonator, tuned to the desired resonant Larmor frequency, given by equation 1:$$f = \frac{1}{2\pi\sqrt{LC}}$$
Where L is the inductance and C is the capacitance of the circuit components. Inductance for a solenoid is given by equation 2:
$$L = \mu\frac{N^2A}{l}$$
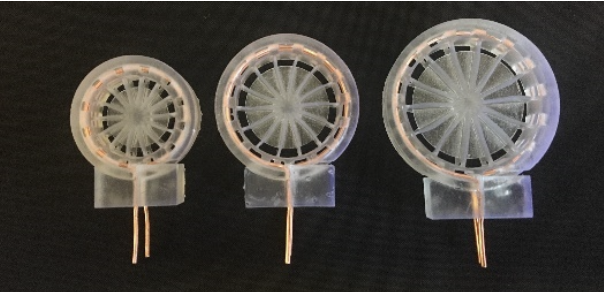
where L is the inductance, μ is the magnetic permeability constant, N is the number of turns, A is the area within the coil, and l is the length of the solenoid (3). A 3D printer (Formlabs Form 2, clear V4 resin) was used to create a precise and accurate mold for shaping the wire. The coil length was fixed at 5 mm, with variable coil diameters (20mm, 25mm, and 30mm), as shown in Figure 1, and variable numbers of complete turns (1, 2, and 3 turns).
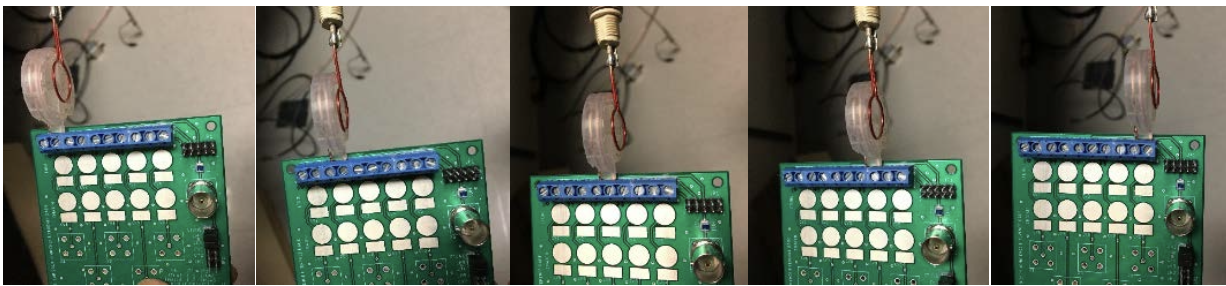
A custom coil testing PCB was designed using Eagle Design and Electrical Schematic Software (Autodesk, San Francisco, CA) and ordered from a commercial PCB manufacturer (Sunstone Circuits, Mulino, OR). This PCB included 5 copies of a parallel LC resonant circuit with different capacitance values in order to characterize the unknown inductance of the fabricated coil. Measurements were perforemd using a HP 4395A network analyzer. The surface coil was connected to each of the 5 circuits on the PCB using the terminal connector to measure resonances, as shown in Figure 2.
Results
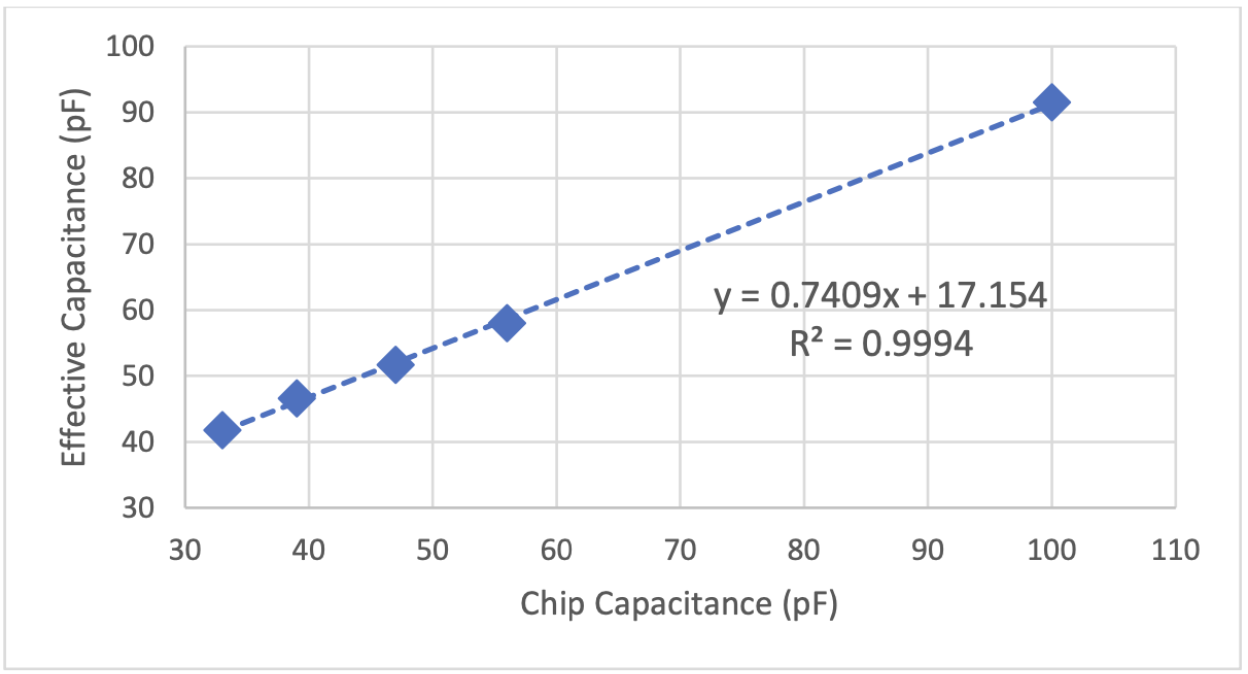
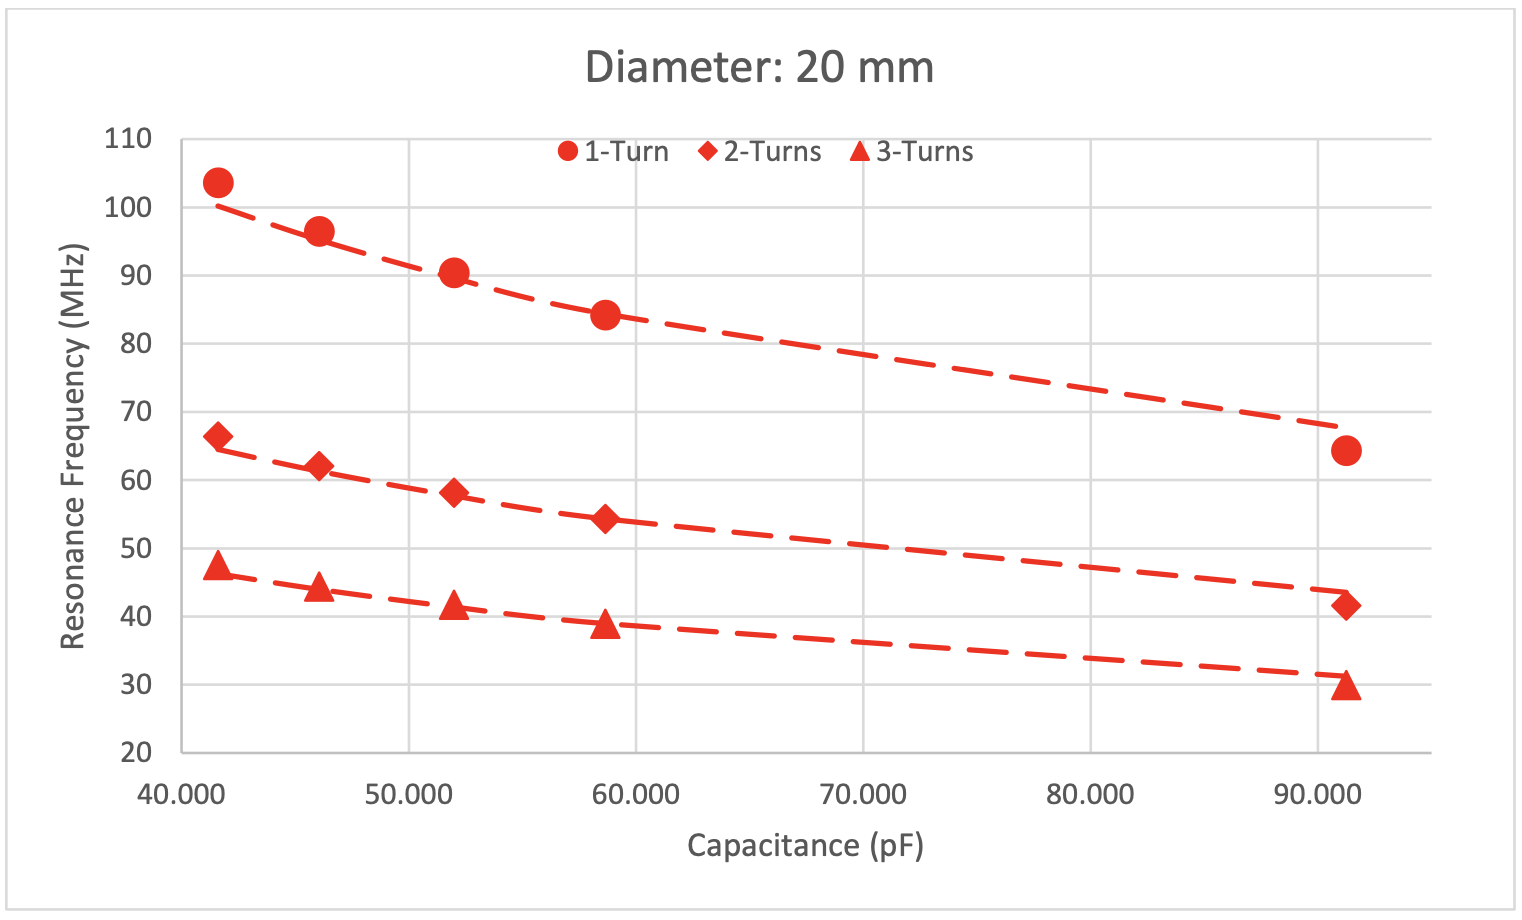
For each measured resonant frequency, an effective capacitance was calculated using Equation 1 and the 1 μH fixed inductor. The calculated linear fit shown in Figure 3 was used to calculate the capacitance of each PCB circuit channel.The relationship between the calculated inductance and increasing test circuit capacitances, calculated via equation 1, was found to be linear for all coils. Figure 4 plots the resonance frequency for each 20mm diameter coil as a function of the calculated effective capacitance. An average of the calculated inductances was used to calculate a theoretical resonance frequency that is also shown in Figure 4. 25 and 30mm diameter coils had very similar measured vs theoretical capacitance relationships.
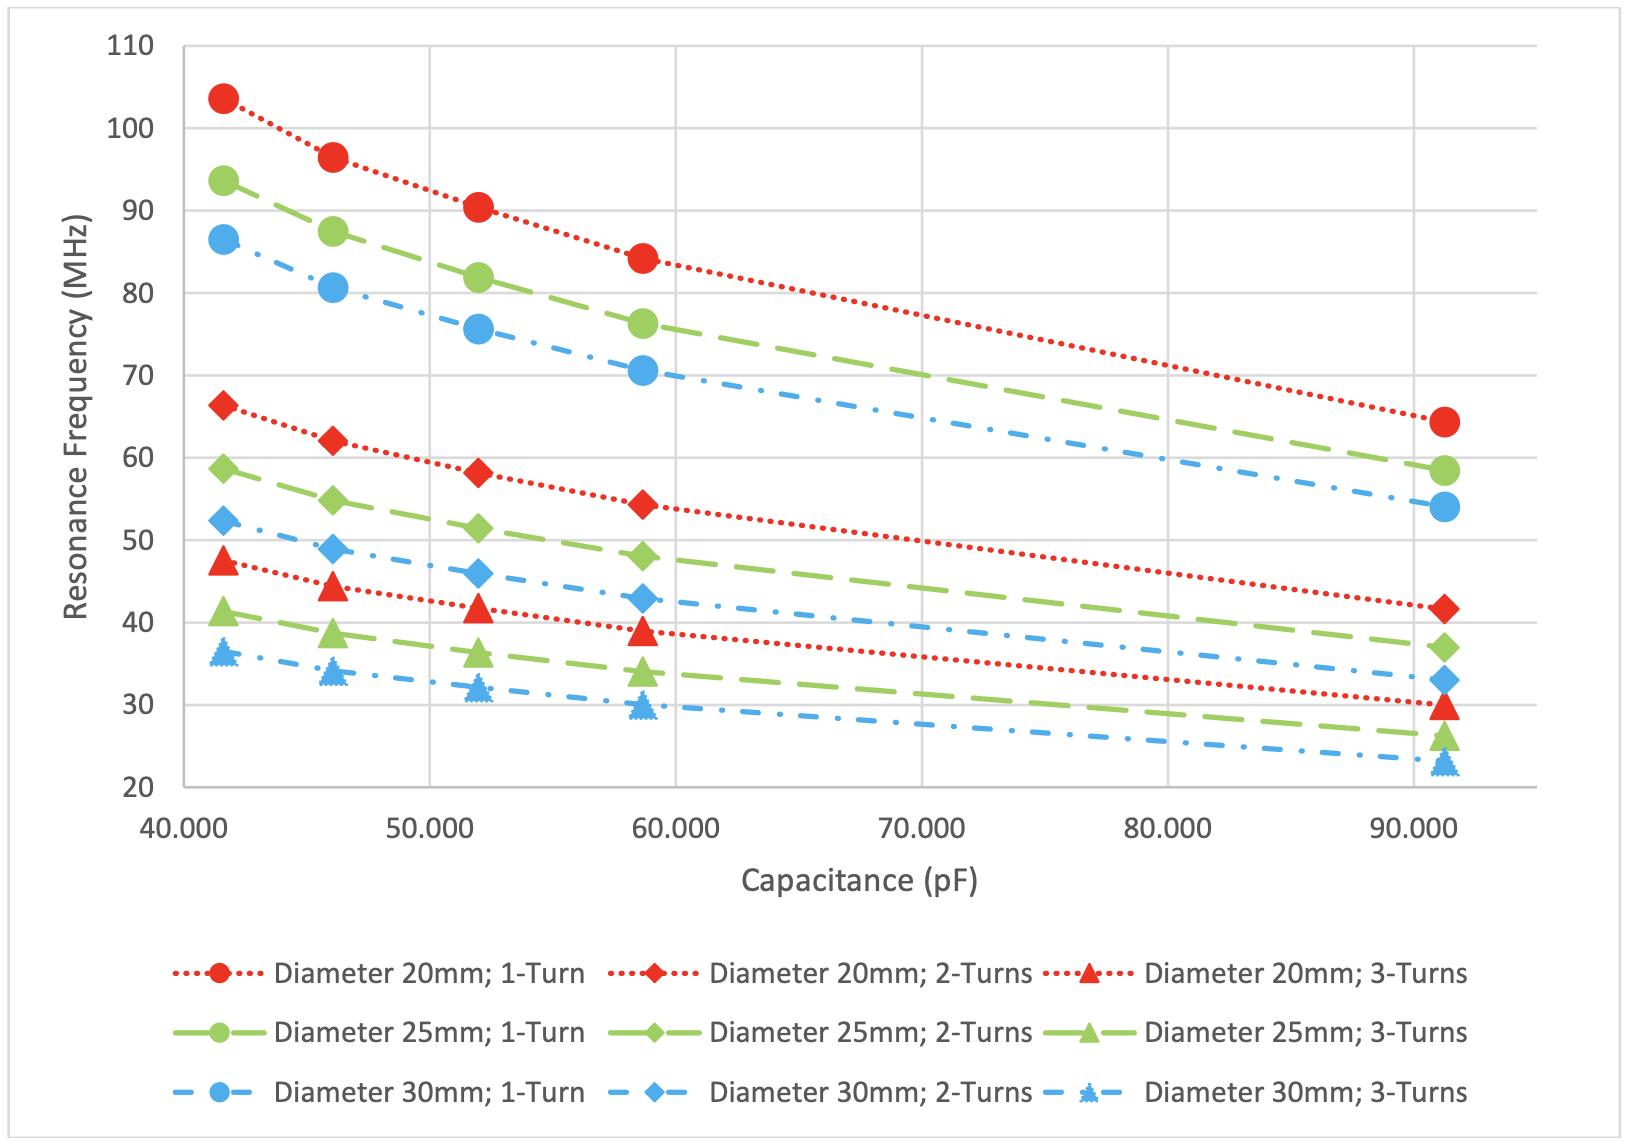
Figure 5 shows a plot of all the resonance frequency measurements to show the qualitative changes in resonance frequency as the coil design parameters are changed. The coil inductance was calculated from Equation 1 using an effective capacitance calculated from the linear fit shown in Figure 3. To test the reproducibility of the coil fabrication, 4 coils with the same design (25 mm diameter, 2- turns) were fabricated. Coils 1-3 were all fabricated on the same day but coil 4 was fabricated on a different day. For each chip capacitance, an average inductance was calculated and we recorded a deviation of < 1% in the average inductance value for all coils.
Discussion
The application of 3D printing enabled the generation of inductors with highly reproducible electrical properties. There was a <1% deviation in the inductance of 4 different coils, including those fabricated on different days. The relationship found between inductance and test circuit capacitance disagreed with theory. Since all measurements across the coils showed the same linear trend, this finding likely resulted from systematic error introduced in the initial calibration step to measure the effective capacitance of the PCB design. However, given the demonstrated reproducibility, in a practical research laboratory setting, this error may be accounted for by scalar offsets determined through empiric measurements. In future experiments, we will redesign the PCB to reduce stray capacitance by shortening traces, removing unnecessary pads for unused components, and uncovering ground planes under devices and traces.Conclusion
3D printing enabled the fabrication of highly reproducible RF inductors with inductance variation estimated to be <1%. While the fabricated surface RF coils integrating these inductors with PCBs showed qualitatively expected trends in the inductance as a function of the design parameters, the changes did not agree with the simple theory predicted by the equation for a solenoid likely resulting from systematic error introduced by the PCB.Acknowledgements
The authors would like to thank Gabor Mizsei, Stephen Pickup, Anshuman Swain and Anthony Mancuso for helpful discussions concerning RF coil theory.References
1. Perkons, N.R., Kiefer, R.M., Noji, M.C., Pourfathi, M., Ackerman, D., Siddiqui, S., Tischfield, D., Profka, E., Johnson, O., Pickup, S., Mancuso, A., Pantel, A., Denburg, M.R., Nadolski, G.J., Hunt, S.J., Furth, E.E., Kadlecek, S. and Gade, T.P.F. (2020), Hyperpolarized Metabolic Imaging Detects Latent Hepatocellular Carcinoma Domains Surviving Locoregional Therapy. Hepatology, 72: 140-154. https://doi.org/10.1002/hep.30970
2. Nicholas R. Perkons, Omar Johnson, Gabrielle Pilla, Enri Profka, Michael Mercadante, Daniel Ackerman, Terence P.F. Gade; Functional Genetic Screening Enables Theranostic Molecular Imaging in Cancer. Clin Cancer Res 1 September 2020; 26 (17): 4581–4589. https://doi.org/10.1158/1078-0432.CCR-20-0826
3. Chen, C.-N., & Hoult, D. I. (1995). Biomedical magnetic resonance technology. Institute of Physics Pub.
Figures