4093
Improved efficiency and quantitative accuracy in hyperpolarized 129Xe ventilation imaging using 2D spiral acquisition1Center for Pulmonary Imaging Research, Division of Pulmonary Medicine, Cincinnati Children's Hospital Medical Center, Cincinnati, OH, United States, 2Department of Biomedical Engineering, University of Cincinnati, Cincinnati, OH, United States, 3Imaging Research Center, Department of Radiology, Cincinnati Children’s Hospital Medical Center, Cincinnati, OH, United States, 4Department of Pediatrics, University of Cincinnati, Cincinnati, OH, United States
Synopsis
Keywords: Data Acquisition, Hyperpolarized MR (Gas)
Despite yielding high signal-to-noise ratio, conventional gradient recalled echo (GRE) sequence requires a relatively long breath-hold for 129Xe ventilation imaging. 2D-spiral sequence enables faster imaging and offers possibility to correct regional B1/flip-angle inhomogeneities and signal decay using keyhole reconstruction without making assumptions about bias texture that can obscure the physiology of interest. Here, GRE and 2D-spiral showed comparable image quality and revealed regional ventilation impairment in cystic fibrosis. Furthermore, flip-angle correction preserved signal variation due to underlying lung pathophysiology, including gravitation ventilation gradients and subtle defects. Thus, flip-angle corrections in 2D-spiral sequence may detect early and reversible disease-induced ventilation impairment.
Introduction:
Hyperpolarized 129Xe MRI quantifies regional ventilation with high resolution, and has been applied to various obstructive lung diseases including asthma1,2, lymphangioleiomyomatosis3, Chronic Obstructive Pulmonary Disease4-6, and Cystic Fibrosis (CF)7-10. Conventionally, slice-selective gradient recalled echo (GRE) was preferred for ventilation MRI, providing high signal-to-noise (SNR) and online image reconstruction. However, GRE requires ~10s for full lung coverage resulting in T1-induced signal decay in the last encoded slices, and challenging breath-holds for children and patients with severe disease. Fortunately, equivalent lung coverage can be achieved in <3s using efficient spiral sequences11-15.However, GRE and spiral suffer coil-dependent B1-inhomogeneities that cause spatially varying sensitivity—and worse—flip-angles (FAs) that cause spatially heterogeneous, RF-induced signal decay. These signal variations are independent of physiology and both obscure and mimic impaired ventilation. These biases must be corrected before images can be quantified—e.g., calculating ventilation defect percentage (VDP) after bias-field correction using the N4 algorithm in ANTS16,17. Unfortunately, N4 correction assumes all low-frequency signal variations is bias and can obscure the ventilation heterogeneity, MRI is intended to measure18.
Here, we mitigate slow acquisition and non-physiological signal variation using 2D-spiral imaging. First, N4-bias-corrected 2D-spiral is shown to be comparable to conventional 2D-GRE for assessing ventilation in CF. A Bloch-equation-based analytical model was then combined with the spiral-keyhole reconstruction to map and correct regional FA variations due to heterogeneous B119-22. FA-corrections mitigate coil-dependent signal variations, while preserving ventilation heterogeneity obscured by N4.
Methods:
Human Subjects: 24 subjects (12M/12F) with CF (8–22 years) underwent 129Xe MRI after providing written informed consent. Studies were approved by our local Institutional Review Board and FDA IND-123577. 129Xe was administered under supervision of a registered nurse with blood-oxygenation/heart-rate monitored throughout scanning.MRI: A 9820A polarizer (Polarean plc, Durham, NC) polarized 129Xe to 20-35% and MRI was performed using Philips-Ingenia 3T scanner and flexible chest coil (Clinical MR solutions, Brookfield, WI). MRI parameters: (2D-GRE) resolution=3x3mm2, slice thickness=15mm, TR/TE=7.73/3.75ms, FOV=320×240mm2, flip-angles=6-12⁰, acquisition window=3.7ms. (2D-spiral) resolution=3x3mm2, slice thickness=15mm, TR/TE=12.6/1.52ms, FOV=320×320mm2, spiral-interleaves=13-29, flip-angles=10-30o, acquisition window=6.25ms. GRE images were reconstructed online. Spiral images were reconstructed and FA-corrected using custom Python scripts19.
Image Analysis: Ventilation was quantified in MATLAB (MathWorks, Natick, MA) via signal thresholding9. Voxels with signal <60% of whole-lung mean were included in ventilation defect percentage (VDP); voxels with signal >200% were included in hyperventilated percentage (HVP). VDP/HVP calculations were performed after N4 bias-field correction16 (shrink factor=1, iterations=100,50,50,50, tolerance=1x10⁻¹⁰, spline parameter=200), or FA correction18, 19, 22. In spiral–FA–correction, T1 was treated as negligible (<0.2s for spiral-interleaves $$$N_s$$$<30), and regional FA, $$$\theta$$$, was extracted from two, temporally-resolved images reconstructed from a single k-space dataset via keyhole reconstruction. The fully sampled image was then scaled voxel-by-voxel by
$$ \gamma = \frac{1}{\theta} \frac{1}{sin(\theta)} \left[ \frac{1-cos(\theta))}{1- cos^{N_s}(\theta)} \right] $$
to correct spatially varying sensitivity and hyperpolarization decay. Gravitationally-dependent signal gradients were calculated from best-fit lines (mean signal vs position) in subjects with VDP<3%.
Statistical Analysis: Differences in VDP, SNR and gravitational gradients were assessed with Wilcoxon signed-rank test (significance: P<0.05). Skew between GRE and 2D-spiral data was assessed with Bland-Altman and Spearman’s correlation tests in RStudio.
Results and Discussion:
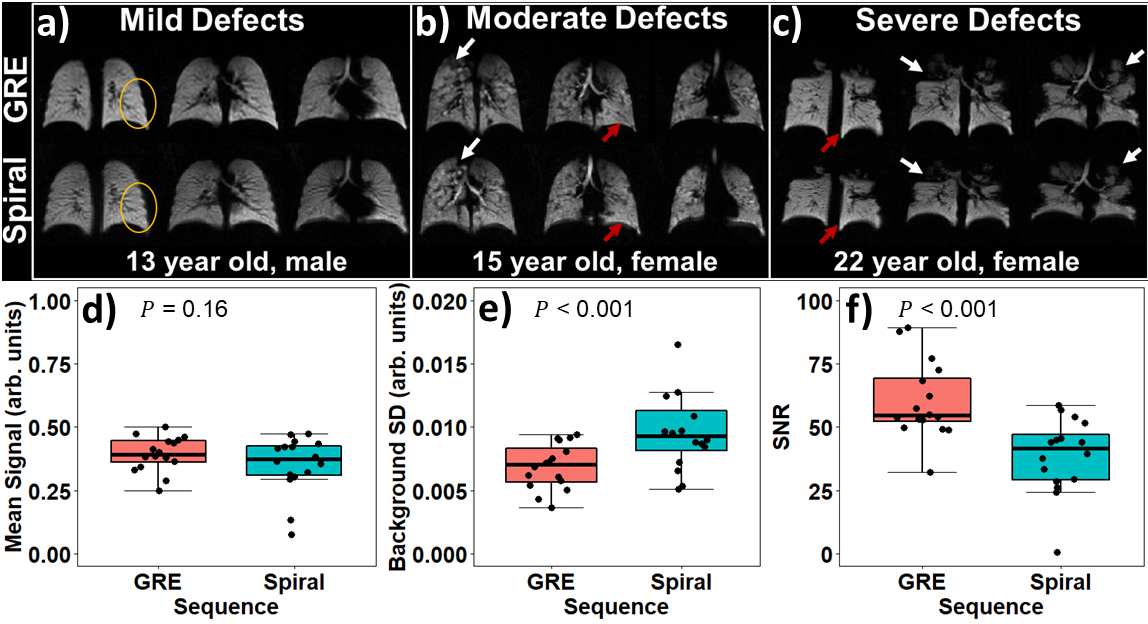
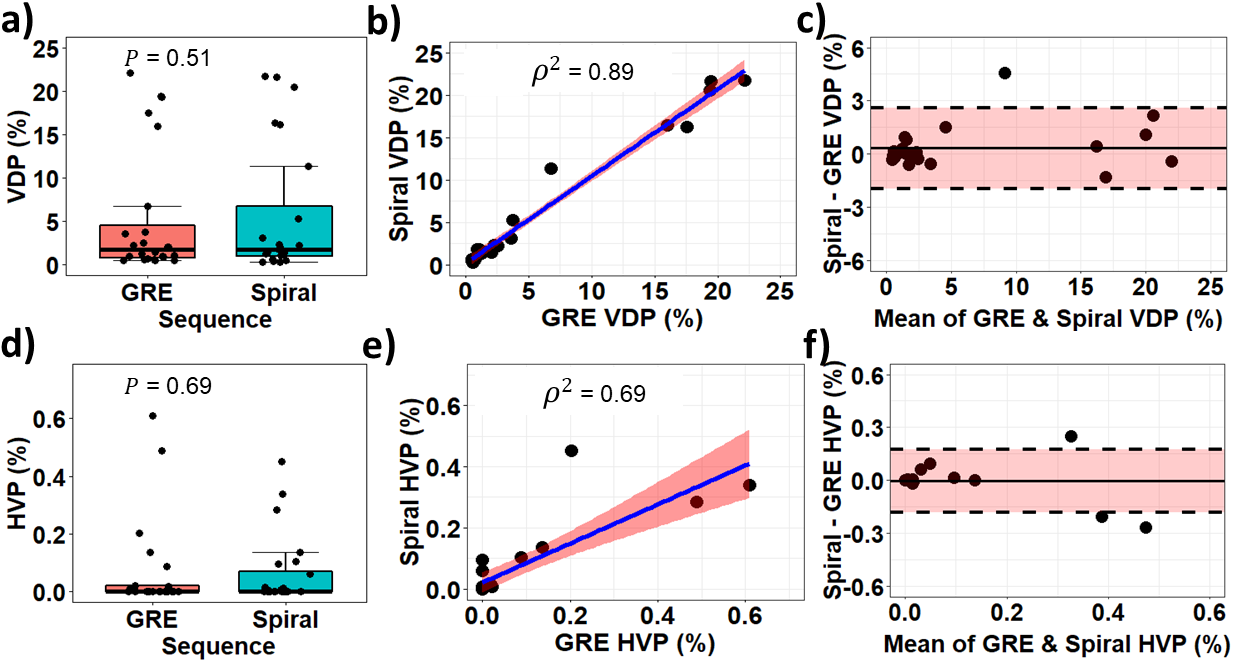
GRE and 2D-spiral provided similar sensitivity to regional lung function in CF, including homogeneous ventilation (e.g., circle, Figure 1a), hyperventilation (red arrows, Figure 1b and 1c), and impaired ventilation (white arrows, Figure 1b and 1c). There was no significant difference in signal with each sequence before bias correction (Figure 1d, P=0.16), but SNR was higher for GRE (Figure 1f, P<0.001), because of increased noise-like background artifacts in spiral (Figure 1e, P<0.001).For N4 bias-field corrected GRE and 2D-spiral, there were no significant differences in either VDP or HVP (Figure 2a,d; P=0.51 for VDP; 0.69 for HVP). VDP and HVP from GRE and 2D-spiral strongly correlated (Figure 2c,f; ρ2=0.89 for VDP; ρ2=0.69 for HVP). Bland-Altman analysis (Figure 2b,e) showed no systemic skew (mean difference=0.33% for VDP and 0.0% for HVP).
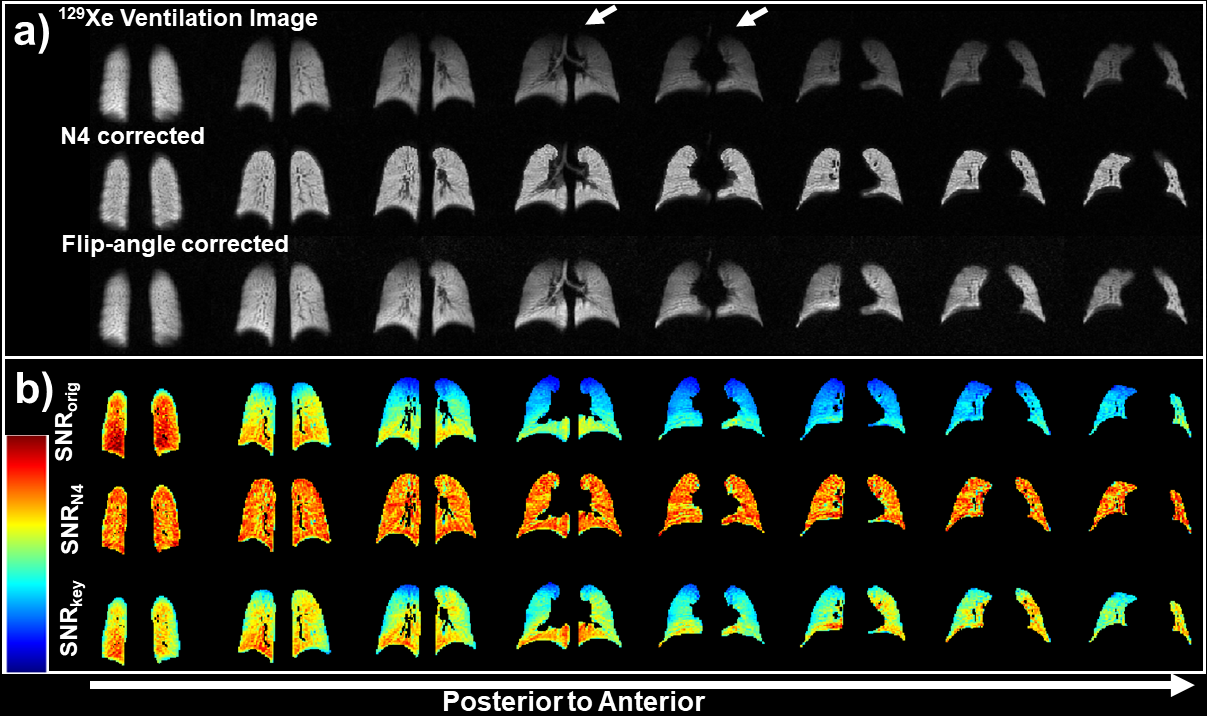
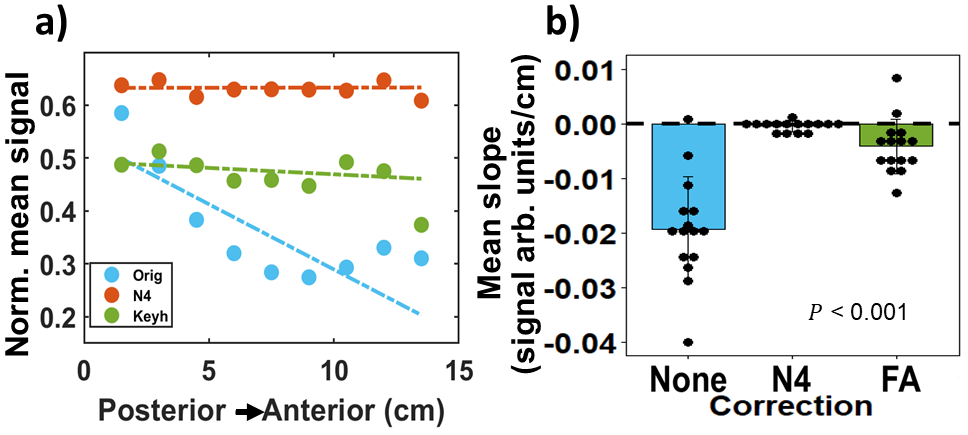
Beyond providing more rapid—but comparable —ventilation sensitivity to GRE, 2D-spiral enables bias-correction using local FAs. N4 bias-field correction mitigates coil-dependent signal inhomogeneities (e.g., lung apex, Figure 3a) but spuriously eliminates physiological variability. For example, slice-by-slice analysis of uncorrected 2D-spiral images shows signal decreases posterior-to-anterior (slope=-0.025 signal arb. units/cm). This gradient originates in-part from the well-known gravitational dependence of ventilation23, but is eliminated by N4-bias-field correction (Figure 3b). In contrast, gravitational dependence in signal was preserved following FA correction (Figure 4a: N4 slope=0; FA slope=–0.0024 signal arb. units/cm).
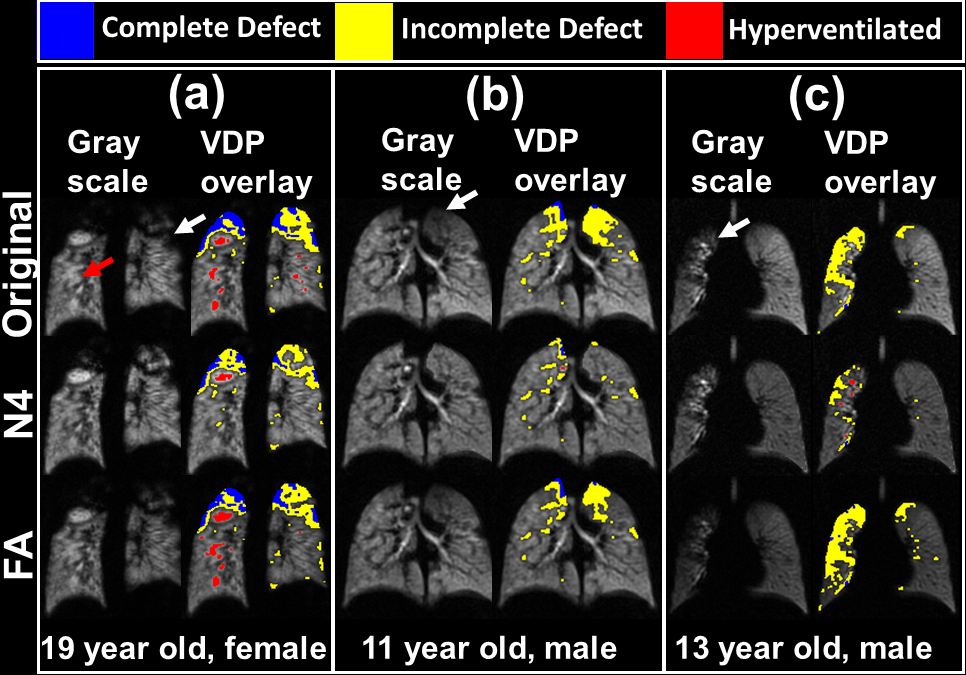
Moreover, N4 correction can mask pathophysiology. Figure 5a shows an example of pathologically hyper- and hypo-ventilated areas (red and white arrows, respectively) which were eliminated by N4 correction. In Figure 5b, N4 removed apical ventilation defects and in Figure 5c eliminated most defect volume in the right lung.
Conclusions:
2D-spiral yields comparable 129Xe ventilation images to GRE in <1/3 of time, thus avoiding T1-induced signal loss and enabling <3s breath-holds. Both sequences suffer from coil-dependent inhomogeneities but the N4 algorithm commonly used to alleviate this bias, obscures physiological heterogeneity due to gravitational ventilation gradients—and more importantly—small hyper- and hypo-ventilated regions, which are markers of early disease. In contrast, FA-correction mitigates coil-dependent signal variability without any additional data collection, while preserving underlying ventilation inhomogeneity.Acknowledgements
The authors acknowledge research funding from Cincinnati Children’s Research Foundation, the NIH (R01HL151588, R01HL143011, R00HL138255), and the Cystic Fibrosis Foundation (NAREN19R0).References
1. Svenningsen, S., et al., Hyperpolarized 3He and 129Xe MRI: differences in asthma before bronchodilation. Journal of Magnetic Resonance Imaging, 2013. 38(6): p. 1521-1530.2. Ebner, L., et al., Hyperpolarized 129Xenon magnetic resonance imaging to quantify regional ventilation differences in mild to moderate asthma: a prospective comparison between semiautomated ventilation defect percentage calculation and pulmonary function tests. Investigative radiology, 2017. 52(2): p. 120-127.
3. Walkup, L.L., et al., Cyst ventilation heterogeneity and alveolar airspace dilation as early disease markers in lymphangioleiomyomatosis. Annals of the American Thoracic Society, 2019. 16(8): p. 1008-1016.
4. Matin, T.N., et al., Chronic obstructive pulmonary disease: lobar analysis with hyperpolarized 129Xe MR imaging. Radiology, 2017. 282(3): p. 857-868.
5. Virgincar, R.S., et al., Quantitative analysis of hyperpolarized 129Xe ventilation imaging in healthy volunteers and subjects with chronic obstructive pulmonary disease. NMR in Biomedicine, 2013. 26(4): p. 424-435.
6. Marshall, H., et al., A comparison of 129Xe MRI and advanced lung function testing in patients with asthma and/or COPD: The NOVELTY ADPro substudy. European Respiratory Journal, 2021. 58(suppl 65): p. PA1872.
7. Kanhere, N., et al., Correlation of lung clearance index with hyperpolarized 129Xe magnetic resonance imaging in pediatric subjects with cystic fibrosis. American journal of respiratory critical care medicine, 2017. 196(8): p. 1073-1075.
8. Rayment, J.H., et al., Hyperpolarised 129Xe magnetic resonance imaging to monitor treatment response in children with cystic fibrosis. European Respiratory Journal, 2019. 53(5).
9. Thomen, R.P., et al., Hyperpolarized 129Xe for investigation of mild cystic fibrosis lung disease in pediatric patients. Journal of Cystic Fibrosis, 2017. 16(2): p. 275-282.
10. Smith, L.J., et al., The assessment of short- and long-term changes in lung function in cystic fibrosis using 129Xe MRI. European Respiratory Journal, 2020. 56(6): p. 2000441.
11. Abdullah S. Bdaiwi, M.L.C., Joseph W. Plummer, Matthew M. Willmering, Laura L. Walkup, and Zackary I. Cleveland, B1-inhomogeneity Correction of Hyperpolarized 129Xe Lung Ventilation Imaging Using Spiral, in International Society for Magnetic Resonance in Medicine. 2022, ISMRM: London.
12. Brandon Zanette, S.M., Yonni Friedlander, Felix Ratjen, and Giles Santyr, Comparison of Spiral and Cartesian Acquisitions for Rapid Hyperpolarized 129Xe Ventilation Mapping in Pediatric Cystic Fibrosis Lung Disease, in International Society for Magnetic Resonance in Medicine. 2022, ISMRM: London.
13. Brandon Zanette, Y.F., Samal Munidasa, and Giles Santyr, Comparison of 3D Stack-of-Spirals and 2D Gradient Echo for Ventilation Mapping using Hyperpolarized 129Xe, in International Society for Magnetic Resonance in Medicine. 2020.
14. Willmering, M.M., et al., Improved pulmonary 129Xe ventilation imaging via 3D-spiral UTE MRI. Magnetic Resonance in Medicine, 2020. 84(1): p. 312-320.
15. Salerno, M., et al., Dynamic spiral MRI of pulmonary gas flow using hyperpolarized 3He: Preliminary studies in healthy and diseased lungs. Magnetic Resonance in Medicine, 2001. 46(4): p. 667-677.
16. Tustison, N.J., et al., N4ITK: Improved N3 Bias Correction. IEEE Transactions on Medical Imaging, 2010. 29(6): p. 1310-1320.
17. Niedbalski, P.J., et al., Protocols for multi-site trials using hyperpolarized 129Xe MRI for imaging of ventilation, alveolar-airspace size, and gas exchange: A position paper from the 129Xe MRI clinical trials consortium. Magnetic Resonance in Medicine, 2021. 86(6): p. 2966-2986.
18. Lu, J., et al., Bias field correction in hyperpolarized 129Xe ventilation MRI using templates derived by RF-depolarization mapping. Magnetic Resonance in Medicine, 2022. 88(2): p. 802-816.
19. Joseph W. Plummer, A.S.B., Mariah L. Costa, Matthew M. Willmering, and Zackary I. Cleveland, Laura L. Walkup, Flip-angle map calculation via keyhole reconstruction in uniform and variable-density 2D-spiral hyperpolarized 129Xe MRI, in International Society for Magnetic Resonance in Medicine. 2022, ISMRM: London.
20. Miller, G.W., et al., Hyperpolarized 3He lung ventilation imaging with B1-inhomogeneity correction in a single breath-hold scan. Magnetic Resonance Materials in Physics, Biology and Medicine, 2004. 16(5): p. 218-226.
21. Niedbalski, P.J. and Z.I. Cleveland, Improved preclinical hyperpolarized 129Xe ventilation imaging with constant flip angle 3D radial golden means acquisition and keyhole reconstruction. NMR in Biomedicine, 2021. 34(3): p. e4464.
22. Niedbalski, P.J., et al., Mapping and correcting hyperpolarized magnetization decay with radial keyhole imaging. Magnetic Resonance in Medicine, 2019. 82(1): p. 367-376.
23. Hopkins, S.R., et al., Vertical gradients in regional lung density and perfusion in the supine human lung: the Slinky effect. Journal of Applied Physiology, 2007. 103(1): p. 240-248.
Figures