4091
Interleaved Whole Brain 23Na MRI and 31P MRSI Acquisitions at 7T1Department of Radiology and Nuclear Medicine, University Medical Center Utrecht, Utrecht, Netherlands
Synopsis
Keywords: Data Acquisition, Data Acquisition
The purpose of this study is to assess the feasibility of an interleaved acquisition of 31P MRSI and 23Na MRI. Triple-nuclei [metabolic] imaging of the brain was performed in one scan session with an interleaved acquisition of 3D 31P MRSI and 3D radial UTE 23Na MRI at 7 Tesla. The results of the interleaved 23Na-31P were compared with those acquired from non-interleaved runs, concluding no influence of each nucleus on the SNR or spectra quality. In conclusion, we showed that these two nuclei pools do not interfere with each other during interleaved acquisition.
Purpose
31P and 23Na can provide complementary metabolic information. 31P MRSI provides insight into cell energy status, which is altered in, for example, tumors but could also give insight in energy metabolism during visual stimuli, or in neurodegenerative diseases. It also provides information about intra- and extracellular pH as well as phospholipid metabolism enabling cancer therapy response prediction1-3. 23Na MRI can be used to estimate cell integrity and tissue viability of a healthy or diseased brain; total brain sodium content has been shown to be a biomarker of neurodegeneration in multiple sclerosis, and biomarker of viable, but hypoxic tissue-at-risk stroke4,5, and is a promising predictor of therapy response in glioblastomas6. Overall, both 31P and 23Na provides functional information which could complement the information offered by 1H MRI.Typically these non-proton MRI techniques face many challenges: long scan time, hardware switches, difficulties in image registration and a low sensitivity. A quintuple tuned head coil was developed to make these non-proton techniques feasible in one scan session without the need for coil switching7. This creates the possibility to acquire multiple nuclei simultaneously; and thus to image complementary metabolic processes within the same time frame.
In this study, we interleaved k-space acquisitions of 31P MRSI with ultrashort echo-time (UTE) 23NA imaging at 7T within the same overarching TR. To verify that there is no interaction between the two nuclear spin perturbations, we qualitatively and quantitatively compared the results from the interleaved scan with a non-interleaved one.
Methods
MR experiments were performed on a 7Tesla MR scanner (Philips, Best, NL) equipped with a 31P birdcage coil integrated in the bore used as RF transmitter and a quintuple tuned RF coil with 8 transmit/receive 1H/19F dipole antennas, combined with a fifteen-loop receive-only array doubled-tuned to 31P and 23Na frequencies and switchable to 13C (120.7, 78.8, 75MHz). A Helmholtz clamp was used for 23Na excitation.Acquisitions and Data Processing
31P-MRSI was interleaved with 23Na sequence (3D radial acquisition) (Figure 1) such that both nuclei scans accomplished within a total acquisition time of ~25 minutes in a healthy volunteer (female, 29 years). For comparison, reference data from each individual 23Na/31P nucleus were acquired in the same scan session, by performing the same scan (no changes in the scan parameters) with transmit-related amplifiers of the other nucleus switched off.
23Na MRI was acquired with an ultrashort echo-time (UTE) imaging sequence using 3D radial k-space sampling of the free-induction decay and dual TR: TE=0.19ms, TR=100ms, FA=45ᵒ, FOV= 256× 256× 160, in-plane resolution= 4×4mm2, slice thickness=10mm and radial percentage= 230%, readout time per spoke= 7ms and 10 radial 3D interleaves. Sodium radial data were reconstructed and channel combined using scanner software. For signal to noise ratio (SNR) assessment, three regions of interest containing mostly cerebrospinal fluid (CSF), gray matter (GM) or white matter (WM), were defined and the noise was obtained from a circle area outside the head.
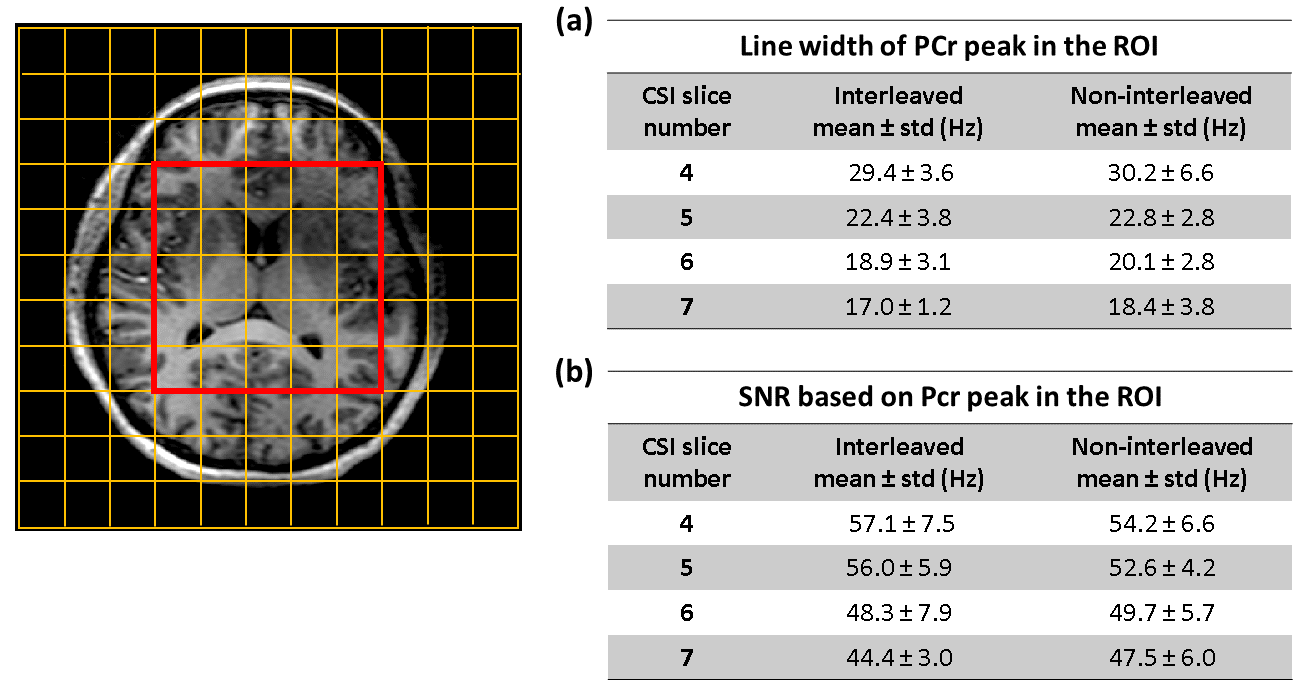
31P MRSI was acquired with a 3D FID-CSI sequence: matrix size= 11×11×9, voxel size= 2×2×2 cm3, TR= 300ms, FA= 20ᵒ, Hamming-weighted k-space sampling with 18 averages, 256 data points, spectral width= 5000Hz. Reconstruction and processing steps of raw 3D 31P data were as follows: k-space apodization with hamming filter, averaging, spatial FFT, zero- and first-order phasing, PCA-based denoising8 and Roemer channel combination. OXSA Matlab code v1.0 was used for analysis of the 31P data9,10. The amplitude and line width of PCr were calculated. SNR of 31P data was calculated as the ratio of the amplitude of the PCr peak to the standard deviation of the noise between 15 to 20 ppm. Two-sample t-Test (with significance level of 5%) was performed to evaluate whether there is a significant difference between interleaved and non-interleaved acquisitions with respect to PCr level.
Results
Figure 2 shows the sodium images from the interleaved and non-interleaved scans. The SNR values in CSF, GM and WM ROIs were similar for the interleaved and non-interleaved scans. The mean SNR of the selected ROI’s in white matter, gray matter and CSF are 7.8, 9.4, 16.2 of the interleaved scan and 8.0, 9.1, 16.8 of the non-interleaved scan, respectively. Figure 3 shows the spectra of two example voxels from the center grid of the 31P 3D CSI matrix. Quantitative comparison between the scans show similar mean line width of PCr peak and mean SNR within ROI (Figure 4) for four CSI mid-slices. Statistical analysis on the voxels within the ROI showed no significant difference on PCr level between the two nuclei scans (p-values of 0.7, 0.8, 0.5, 0.4 for slices 4-7, respectively).Discussion and Conclusion
We presented an interleaved scheme for 31P-23Na acquisitions in one scan. Compared to the non-interleaved scan, SNR and spectral quality of each nucleus was not reduced. The low specific absorption rate (SAR) demand of the 31P MRSI sequence allowed to interleave it with a SAR-demanding 23Na MRI. The two repetitions of sodium sequence resulted in two 23Na 3D image sets with different TR that could be used for B1 mapping, or reconstruct these into a single 3D image (as we have shown). In conclusion, we showed that the spins from these two nuclei pools do not interfere with each other during interleaved acquisition.Acknowledgements
We acknowledge funding EU-Eurostars! 12921 VM-Biopsy.References
1. Moon RB, Richards JH. Determination of intracellular pH by 31P magnetic resonance. J Biol Chem. 1973;248:7276–7278.
2. Korzowski A, Weinfurtner N, Mueller S, et al. Volumetric mapping of intra- and extracellular pH in the human brain using 31P MRSI at 7T. Magnetic Resonance in Medicine. 2020, 84(4):1707–1723.
3. Krikken E, van der Kemp WJM, van Diest PJ, et al. Early detection of changes in phospholipid metabolism during neoadjuvant chemotherapy in breast cancer patients using phosphorus magnetic resonance spectroscopy at 7T. NMR Biomed. 2019 Jun;32(6):e4086
4. Eisele P, Konstandin S, Szabo K, et al. Temporal evolution of acute multiple sclerosis lesions on serial sodium ((23)na) mri. Mult Scler Relat Disord. 2019;29:48–54.
5. Mohamed SA, Herrmann K, Adlung A, et al. Evaluation of Sodium (23Na) MR-imaging as a Biomarker and Predictor for Neurodegenerative Changes in Patients With Alzheimer's Disease. In Vivo. 2021;35(1):429-435.
6. Paech D, Regnery S, Platt T, et al. Assessment of Sodium MRI at 7 Tesla as Predictor of Therapy Response and Survival in Glioblastoma Patients. Frontiers in Neuroscience. 2021;15.
7. Dai J, van der Velden TA, Hoogduin JM, et al. A Quintuple-Tuned RF Coil for Whole Brain Multi-Nuclei Magnetic Resonance Imaging and Spectroscopy at 7T. ISMRM 2021, #0178.
8. Froeling M, Prompers JJ, Klomp DWJ, van der Velden TA. PCA denoising and Wiener deconvolution of 31P 3D CSI data to enhance effective SNR and improve point spread function. Magn Reson Med. 2021; 85: 2992– 3009.
9. urvis LAB, Clarke WT, Biasiolli L, et al. OXSA: An open-source magnetic resonance spectroscopy analysis toolbox in MATLAB. Plos One. 2017; 12(9):e0185356.
10. Vanhamme L, van den Boogaart A, Van Huffel S. Improved method for accurate and efficient quantification of MRS data with use of prior knowledge. J Magn Reson. 1997; 129(1):35-43.
Figures
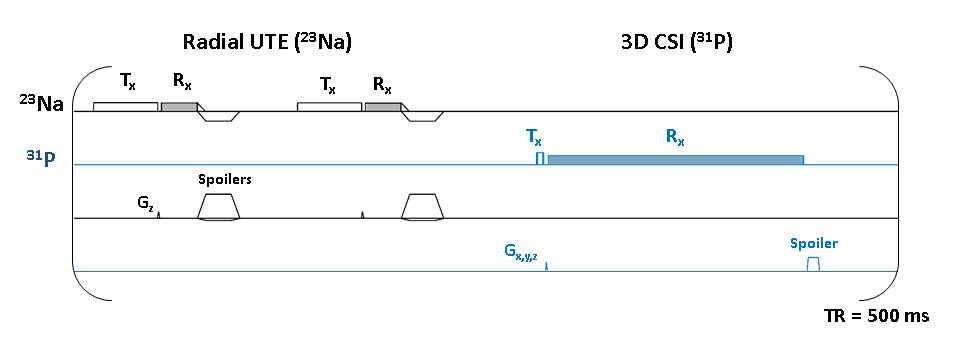
Figure 1. Pulse sequence diagrams for interleaved acquisition of 23Na MRI (TE= 0.19 ms) and 31P MRSI (TE= 0.67 ms). Because of radial sampling, we achieved an echo time (TE= 0.19ms) below the sodium fast component (T2 ranging from 0.8ms to 3ms).
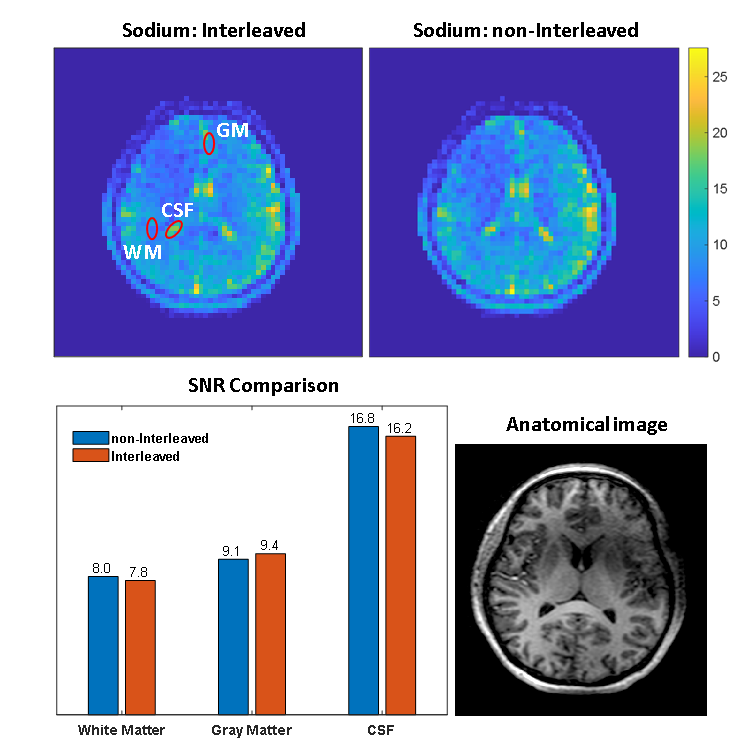
Figure 2. Interleaved and non-interleaved sodium images (the background noise was masked out). The images are normalized to the standard deviation of the background noise. The bar plot shows the SNR in three ROIs in white matter, gray matter and the CSF (with the corresponding anatomical image on the bottom right) for the interleaved and non-interleaved sodium images.
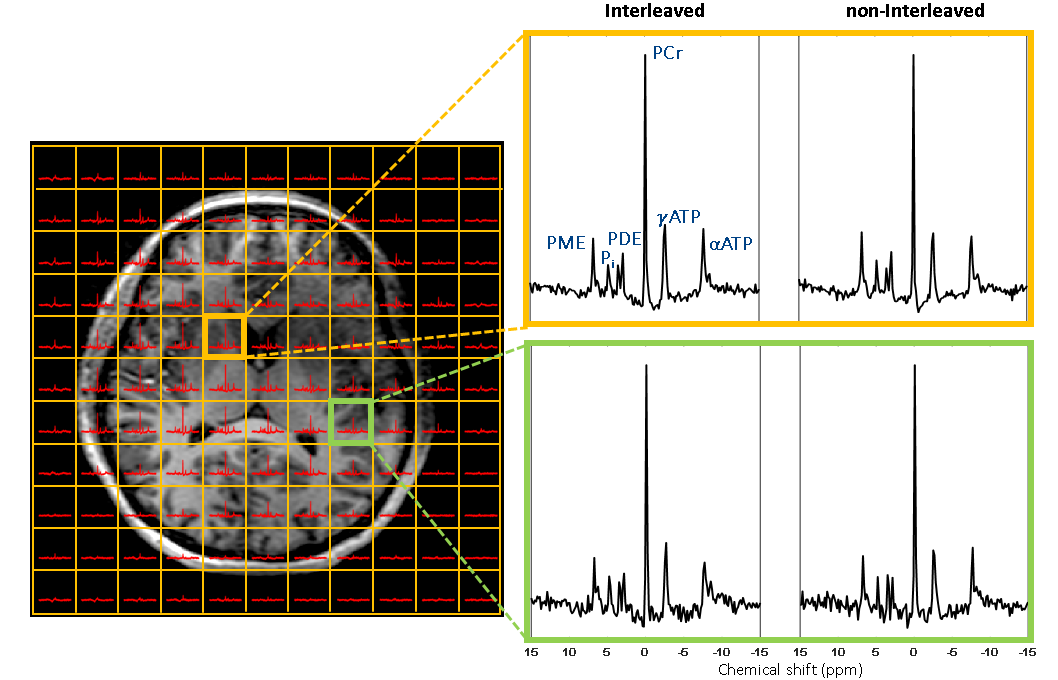
Figure 3. 31P spectra from two different voxels in the 3D CSI grid acquired from interleaved and non-interleaved scans. Spectra in the shown grid and all the spectra shown in orange and green boxes were scaled to the same PCr level.