4089
Effects of spatial resolution on brain tissue displacement estimates based on DENSE MRI at 7T1Health Sciences and Technology, Massachusetts Institute of Technology, Cambridge, MA, United States, 2Athinoula A. Martinos Center for Biomedical Imaging, Massachusetts General Hospital, Charlestown, MA, United States, 3Department of Radiology, Harvard Medical School, Boston, MA, United States, 4Department of Biomedical Engineering, Boston University, Boston, MA, United States
Synopsis
Keywords: High-Field MRI, Tissue Characterization, Neurofluids, Diffusion Imaging Techniques
Displacement Encoding with Stimulated Echoes (DENSE) MRI was used to estimate pons and midbrain tissue displacement over the cardiac cycle at 2-mm, 3-mm, and 4-mm isotropic spatial resolutions in individual subjects at 7T. Displacement estimates were largest at 2-mm resolution and matched previous reports of peak brainstem displacement over the cardiac cycle. Smaller estimates at lower resolution may be due to partial volume effects from the surrounding tissue or CSF.Introduction
Brain tissue deformation occurs with the cardiac and respiratory cycles1,10,14,15 and may be involved in CSF flow patterns and waste clearance.5,7 Accurate tissue displacement measurements are crucial for understanding this physiology and the potential contribution to functional MRI signals.18 Both slow CSF flow and dynamic volume fraction changes may confound displacement estimates at tissue-CSF boundaries through partial volume effects.6,11,12 High spatial resolution reduces these partial volume effects,16 but it is unclear how higher resolutions may affect the accuracy and precision of tissue displacement measurements given the SNR expense. Previous studies calculating tissue displacement have used larger voxels for strain estimations,1,10,13,14 where the calculation of spatial derivatives amplifies noise. Here, we focus on high-resolution characterization of linear displacements. Similar to prior studies,1,14 we use a stimulated echo sequence, as opposed to conventional gradient-echo-based phase-contrast approaches, for its long motion encoding time and ability to capture smaller displacements. The current study aims to characterize tissue displacement measurements at three spatial resolutions in the human brainstem at 7T using Displacement Encoding with Stimulated Echoes (DENSE) based on single-shot EPI.2Methods
One healthy volunteer participated in this study, after providing written informed consent following our institutional review board approved protocol. All data were acquired on a 7T Siemens Magnetom Terra at the Athinoula A. Martinos Center for Biomedical Imaging using a custom 64-channel head coil for signal reception.9 Data were acquired using 2-mm, 3-mm, and 4-mm isotropic voxel sizes. Two runs, yielding 40 displacement-encoded volumes total, were acquired per voxel size. Different voxel size acquisitions varied in their number of slices (32 for 2-mm, 18 for 3-mm and 4-mm) and GRAPPA acceleration factor (R = 3 for 2-mm and R = 2 for 3-mm and 4-mm). Other sequence parameters included: TR = 3 s, TE = 54 ms, nominal echo spacing = 0.53 ms, and excitation flip angle = 90°. Oblique-axial slices were centered on the pons for acquisition of the whole brainstem. To capture the displacement of the brainstem, mixing times of 11-12 ms were used yielding a displacement encoding value (Denc, analogous to Venc) of 0.40-0.43 mm. Displacement was encoded in the Head-Foot direction with interleaved Denc = 0 acquisitions for subtraction of background phase offsets. Coil-dependent phase offsets were corrected online using ASPIRE4 to generate phase-valued images without singularities.Complex-valued images were split into real and imaginary components for motion correction, which was performed using 3DAllineate from the AFNI toolbox and applied within each run. Manual phase unwrapping was applied in the motion-corrected data to slices where large displacements introduced phase wraps. Each slice of the DENSE images was retrospectively matched to phases of the cardiac cycle using the time course from an external fingertip piezoelectric device synchronized with the acquisition. Regions of interest in the pons and midbrain were drawn manually in two separate slices each, and median phase values in each ROI were calculated within each slice separately to account for slice timing differences.
Results
Representative magnitude- and phase-valued images are shown in Figure 1. Phase wraps occurred within the brainstem ROIs in the 2-mm runs only. Pons and midbrain displacement varied with the cardiac cycle and showed greatest displacement estimates in the caudal direction around the cardiac signal peak (Figure 2). Displacement estimates were larger at 2-mm resolution compared to 3-mm and 4-mm. A small negative bias was detected between the peaks of the cardiac signal, which may be attributable to eddy currents or imperfect background phase subtraction; further evaluation of this is forthcoming. Peak displacements were comparable between the pons and midbrain. To assess potential for increased noise levels in the highest resolution data, spatial standard deviation was calculated and found to be highest in the 2-mm resolution images by 0.005-0.01 mm; however, this is lower than the difference in displacement estimates observed between resolutions (Figure 3). Standard deviation between runs and between slices were comparable (0.078 versus 0.077 mm), indicating high across-run consistency and reliability. An initial pilot in a separate participant using different Denc values yielded similar displacement estimates in these brain regions (data not shown).Discussion
Here, we demonstrated that displacement estimates based on DENSE MRI vary with spatial resolution such that estimates are larger at higher resolutions. Others have estimated peak cardiac cycle brainstem displacements to be about 0.2 mm,10 which matches the estimate based on 2-mm isotropic resolution in this study. Modest differences in spatial standard deviation of the displacement estimate indicate that the variation in displacement estimates across resolutions is unlikely to be due to SNR differences. The smaller estimates at lower resolution may be due to partial volume effects from the surrounding CSF.12 CSF in this region appears to displace in the rostral direction during this phase of the cardiac cycle,17 which would dilute the caudally-directed tissue displacement observed here. We have piloted a higher-resolution acquisition with 1.2 mm in-plane resolution and 2 mm slice thickness (see Figure 4); however, the noise in these data poses challenges to proper phase unwrapping and analysis of these data is currently ongoing. Future work will relate tissue displacement to dynamic CSF flow3 to understand how the two processes may influence waste clearance from the brain.7,8Acknowledgements
We thank Simon Robinson for the use of the ASPIRE C2P package, to Danny Park for pulse sequence assistance, Kyle Droppa for help with volunteer recruitment and scheduling, and Siemens Healthineers for their technical support. This work was supported in part by the NIH NIBIB (grants P41-EB030006, R01-AT011429, and 5T32-EB1680), and by the MGH/HST Athinoula A. Martinos Center for Biomedical Imaging, and was made possible by the resources provided by NIH Shared Instrumentation Grant S10-OD023637.
References
1. Adams AL, Kuijf HJ, Viergever MA, Luijten PR, Zwanenburg JJM. Quantifying cardiac-induced brain tissue expansion using DENSE. NMR in biomedicine. 2019;32(2):e4050.
2. Aletras AH, Ding S, Balaban RS, Wen H. DENSE: displacement encoding with stimulated echoes in cardiac functional MRI. Journal of magnetic resonance . 1999;137(1):247–252.
3. Dong Z, Wang F, Strom AK, Eckstein K, Bachrata B, Simon RD, Wald LL, Lewis LD, Polimeni JR. 4D whole-brain CSF flowmetry: slow flow dynamics in ventricles and subarachnoid space. In: ISMRM Workshop on Neurofluids.
4. Eckstein K, Dymerska B, Bachrata B, Bogner W, Poljanc K, Trattnig S, Robinson SD. Computationally Efficient Combination of Multi-channel Phase Data From Multi-echo Acquisitions (ASPIRE). Magnetic resonance in medicine: official journal of the Society of Magnetic Resonance in Medicine / Society of Magnetic Resonance in Medicine. 2018;79(6):2996–3006.
5. Feinberg DA. Modern Concepts of Brain Motion and Cerebrospinal Fluid Flow. Radiology. 1992;185:630–632.
6. Jin T, Kim S-G. Change of the cerebrospinal fluid volume during brain activation investigated by T(1rho)-weighted fMRI. NeuroImage. 2010;51(4):1378–1383.
7. Kedarasetti RT, Turner KL, Echagarruga C, Gluckman BJ, Drew PJ, Costanzo F. Functional hyperemia drives fluid exchange in the paravascular space. Fluids and barriers of the CNS. 2020;17(1):52.
8. Kylkilahti TM, Berends E, Ramos M, Shanbhag NC, Töger J, Markenroth Bloch K, Lundgaard I. Achieving brain clearance and preventing neurodegenerative diseases-A glymphatic perspective. Journal of cerebral blood flow and metabolism: official journal of the International Society of Cerebral Blood Flow and Metabolism. 2021;41(9):2137–2149.
9. Mareyam A, Kirsch JE, Chang Y, Madan G, Wald LL. A 64-Channel 7T array coil for accelerated brain MRI. In: Proceedings of the International Society for Magnetic Resonance in Medicine. 2020.
10. Pahlavian SH, Oshinski J, Zhong X, Loth F, Amini R. Regional Quantification of Brain Tissue Strain Using Displacement-Encoding With Stimulated Echoes Magnetic Resonance Imaging. Journal of biomechanical engineering. 2018;140(8). http://dx.doi.org/10.1115/1.4040227. doi:10.1115/1.4040227
11. Piechnik SK, Evans J, Bary LH, Wise RG, Jezzard P. Functional changes in CSF volume estimated using measurement of water T2 relaxation. Magnetic resonance in medicine: official journal of the Society of Magnetic Resonance in Medicine / Society of Magnetic Resonance in Medicine. 2009;61(3):579–586.
12. Scouten A, Constable RT. VASO-based calculations of CBV change: accounting for the dynamic CSF volume. Magnetic resonance in medicine: official journal of the Society of Magnetic Resonance in Medicine / Society of Magnetic Resonance in Medicine. 2008;59(2):308–315.
13. Sloots JJ, Biessels GJ, de Luca A, Zwanenburg JJM. Strain Tensor Imaging: Cardiac-induced brain tissue deformation in humans quantified with high-field MRI. NeuroImage. 2021;236:118078.
14. Sloots JJ, Biessels GJ, Zwanenburg JJM. Cardiac and respiration-induced brain deformations in humans quantified with high-field MRI. NeuroImage. 2020;210(116581):116581.
15. Soellinger M, Rutz AK, Kozerke S, Boesiger P. 3D cine displacement-encoded MRI of pulsatile brain motion. Magnetic resonance in medicine: official journal of the Society of Magnetic Resonance in Medicine / Society of Magnetic Resonance in Medicine. 2009;61(1):153–162.
16. Weibull A, Gustavsson H, Mattsson S, Svensson J. Investigation of spatial resolution, partial volume effects and smoothing in functional MRI using artificial 3D time series. NeuroImage. 2008;41(2):346–353.
17. Yamada S, Miyazaki M, Yamashita Y, Ouyang C, Yui M, Nakahashi M, Shimizu S, Aoki I, Morohoshi Y, McComb JG. Influence of respiration on cerebrospinal fluid movement using magnetic resonance spin labeling. Fluids and barriers of the CNS. 2013;10(1):36.
18. Zoraghi M, Scherf N, Jaeger C, Sack I, Hirsch S, Hetzer S, Weiskopf N. Simulating Local Deformations in the Human Cortex Due to Blood Flow-Induced Changes in Mechanical Tissue Properties: Impact on Functional Magnetic Resonance Imaging. Frontiers in neuroscience. 2021;15:722366.
Figures
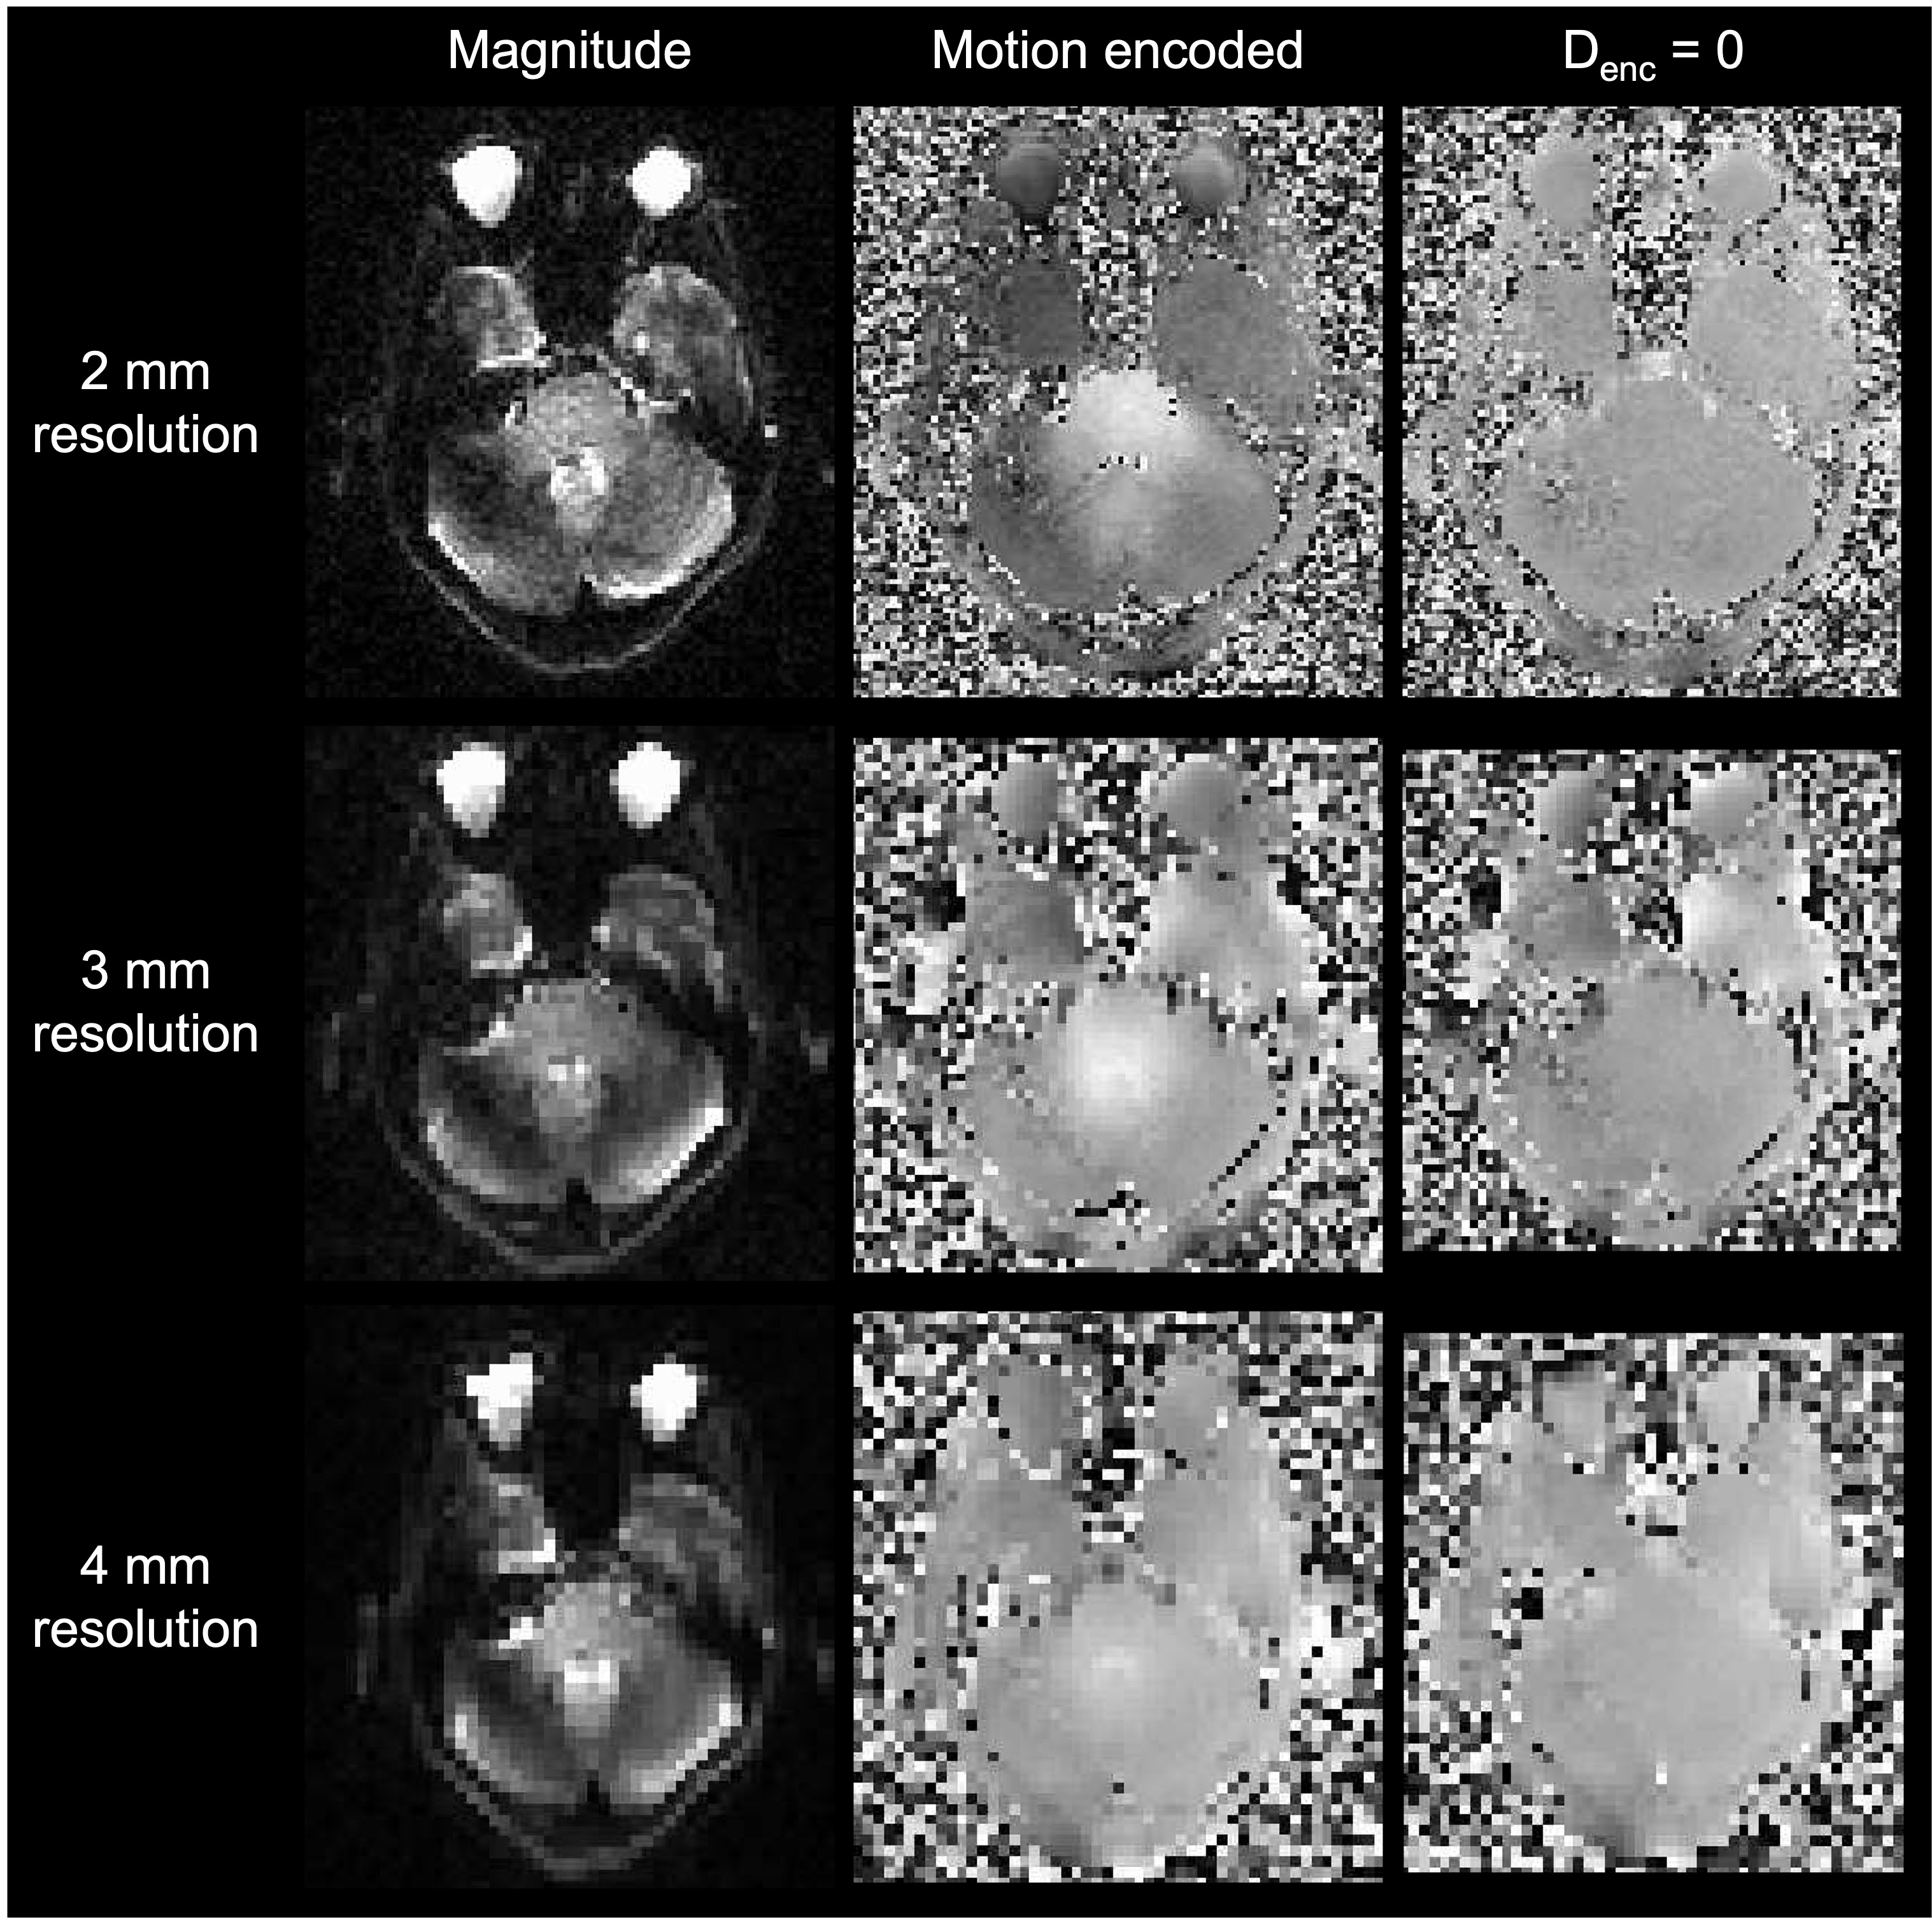
Figure 1. High image quality can be seen in the raw DENSE image data at 7T across all resolutions tested. Representative magnitude- and phase-valued images are shown with displacement encoding (in the Z direction) and with no displacement encoding. Motion-encoded phase-valued images display slices from similar phases of the cardiac cycle. White in the phase-valued images indicates rostral-to-caudal displacement.
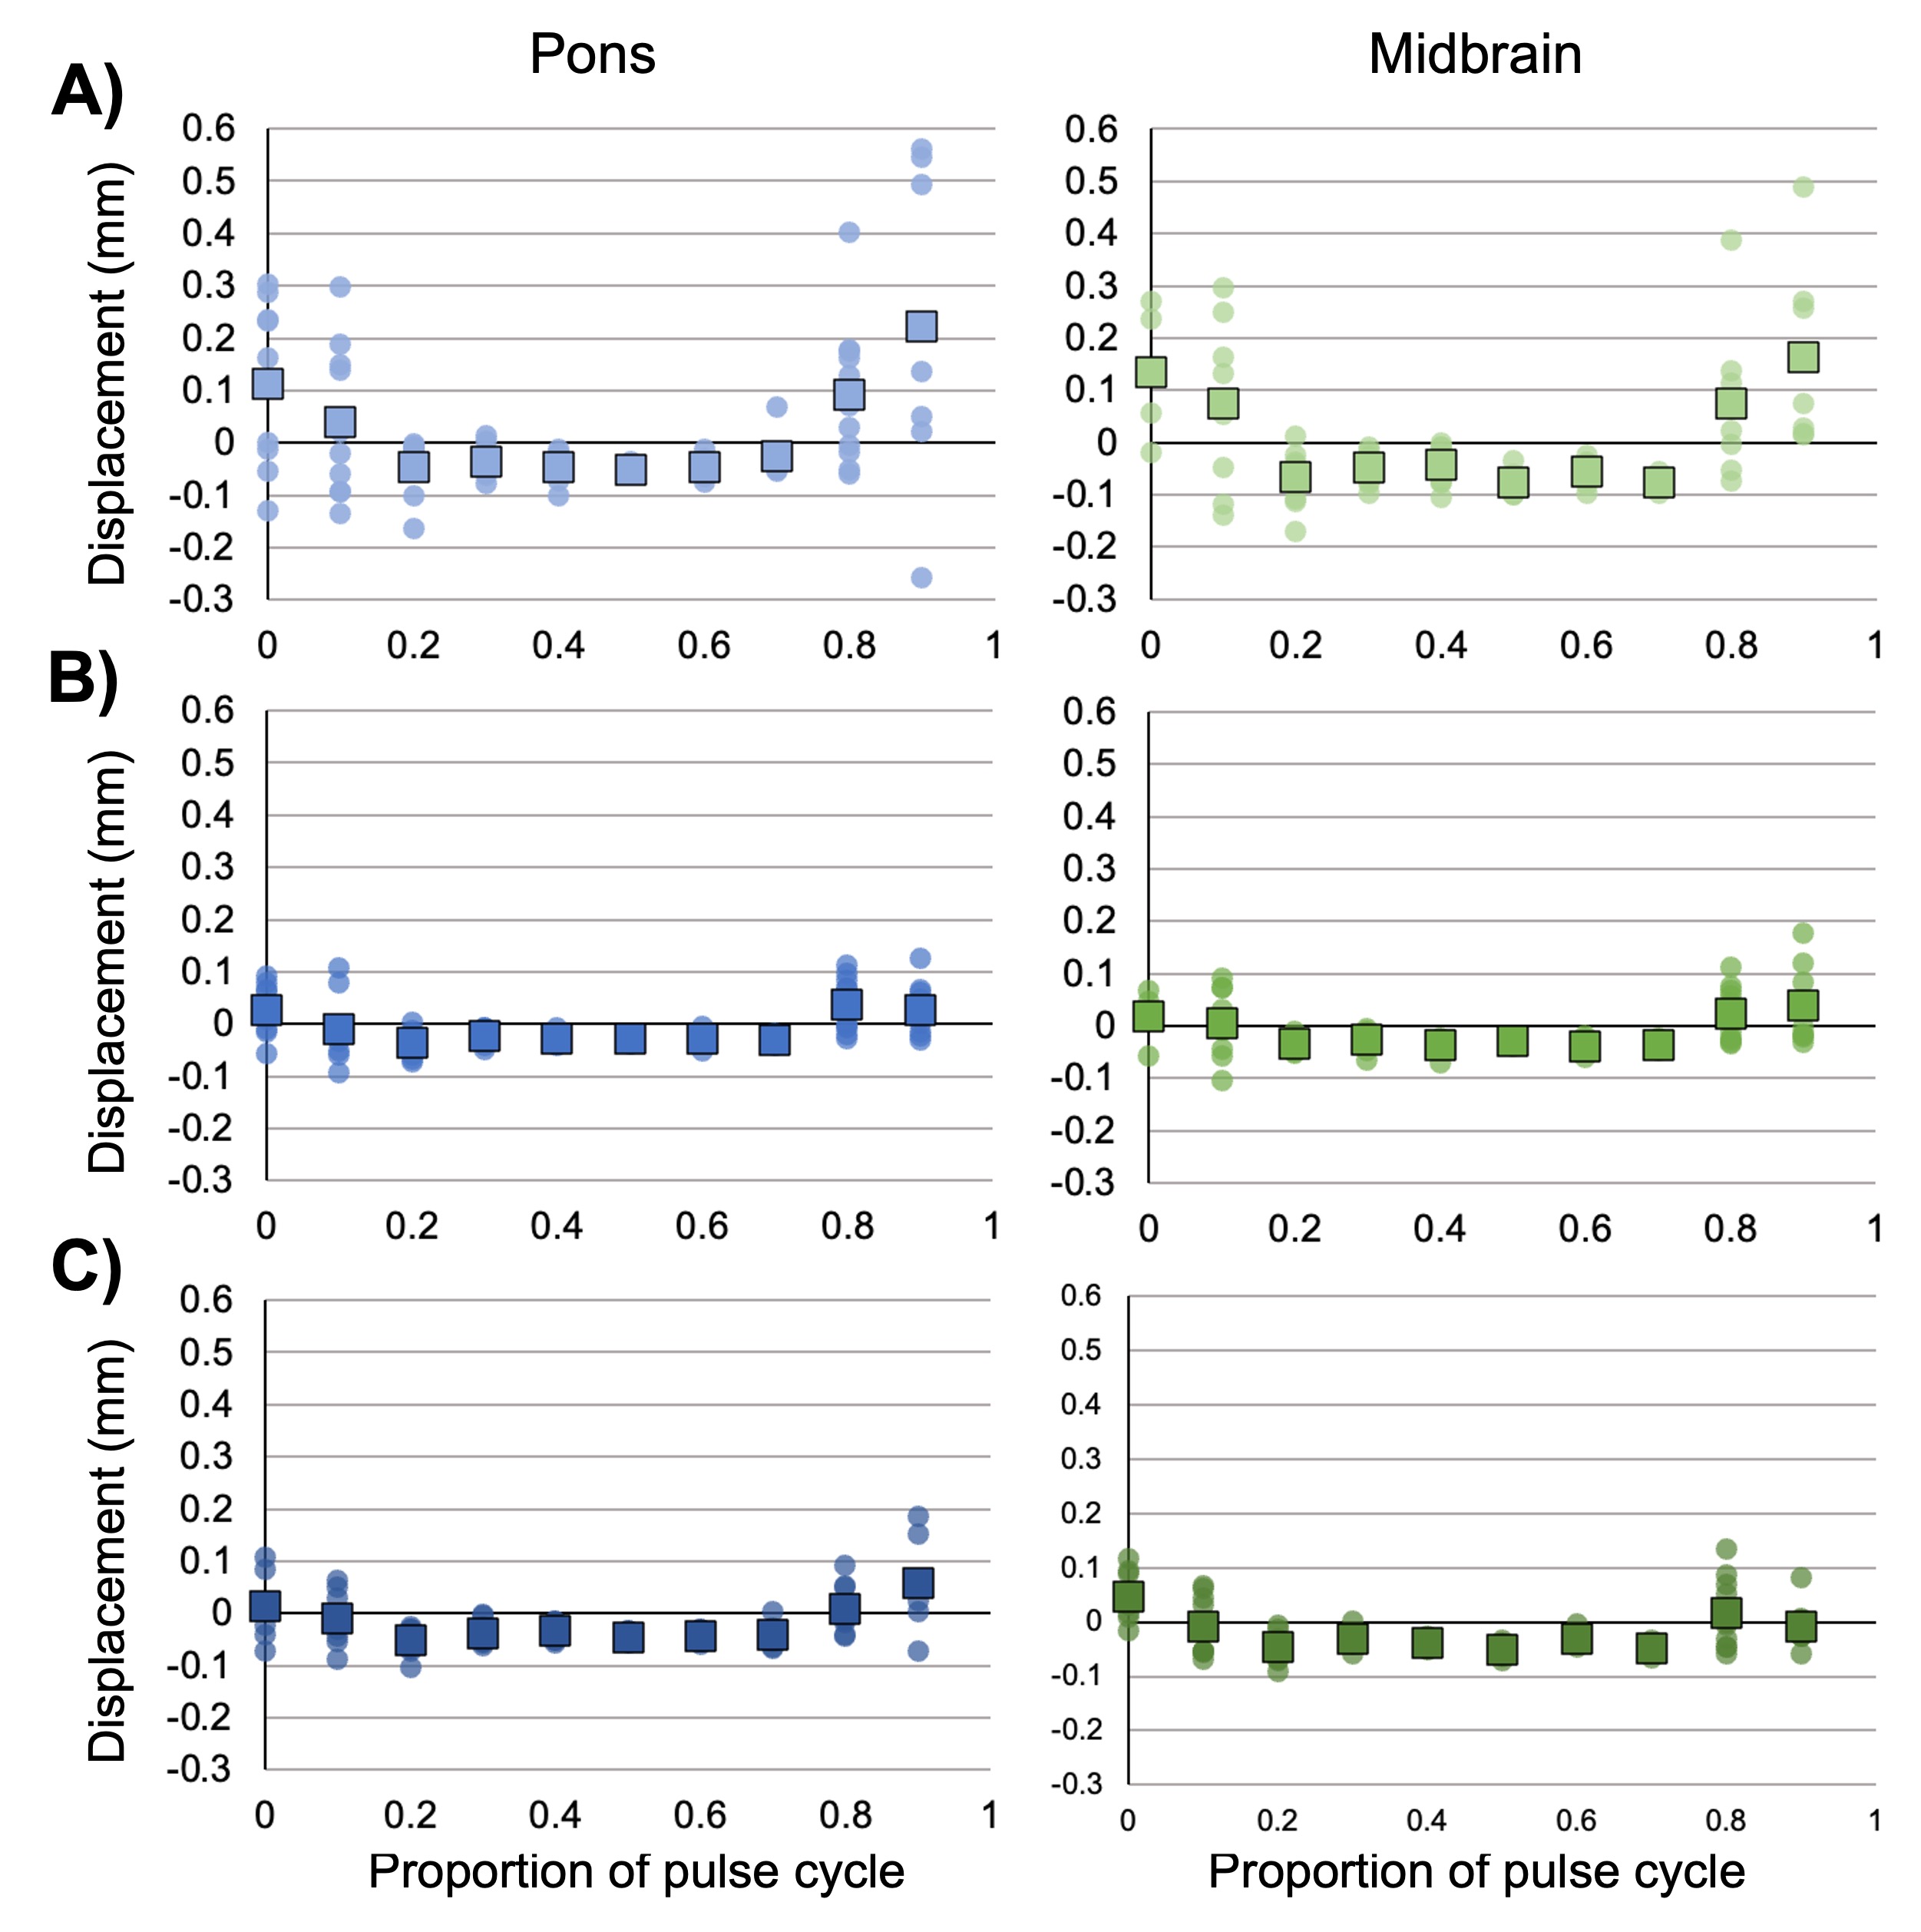
Figure 2. Estimated displacements using A) 2 mm, B) 3 mm, or C) 4 mm spatial resolutions. Zero in the pulse cycle represents the pulse peak measured by fingertip piezoelectric device. Positive displacements indicate the rostral to caudal direction. Squares indicate average across runs and slices, and circles represent values for individual runs and slices.
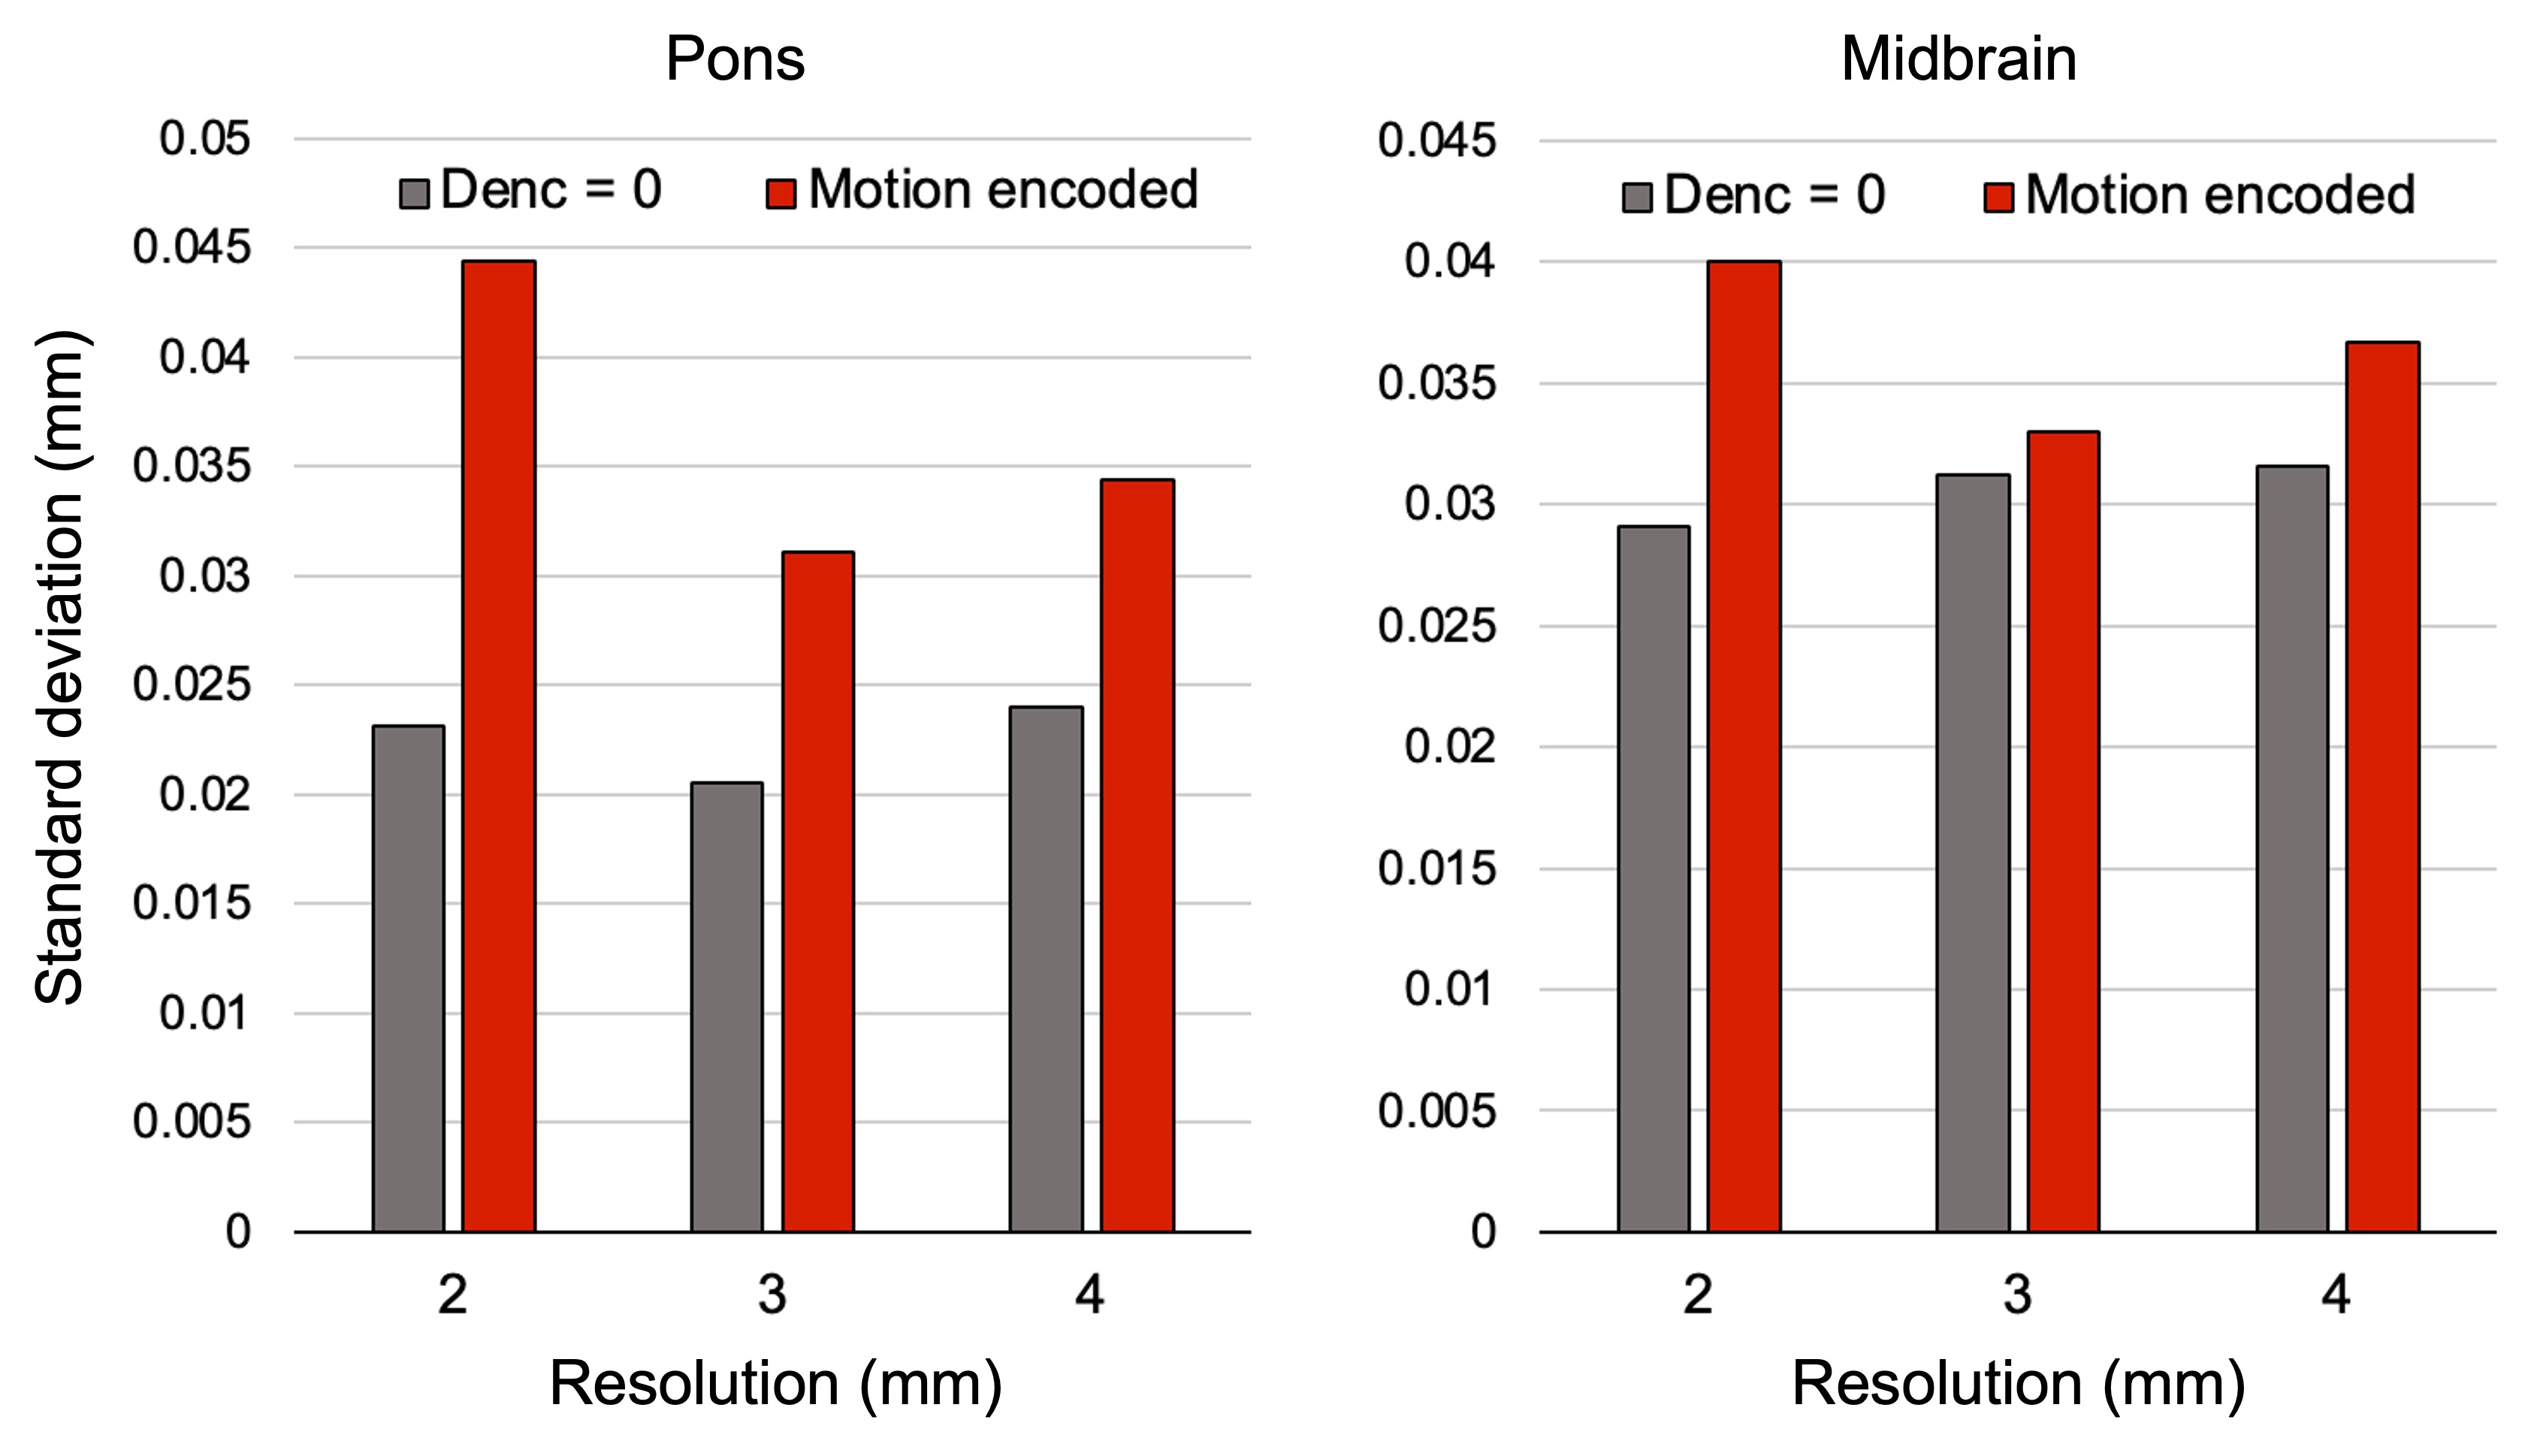
Figure 3. Combined spatial standard deviation for each region and resolution. Standard deviation was calculated within each ROI then combined across runs and slices, taking ROI size into account.
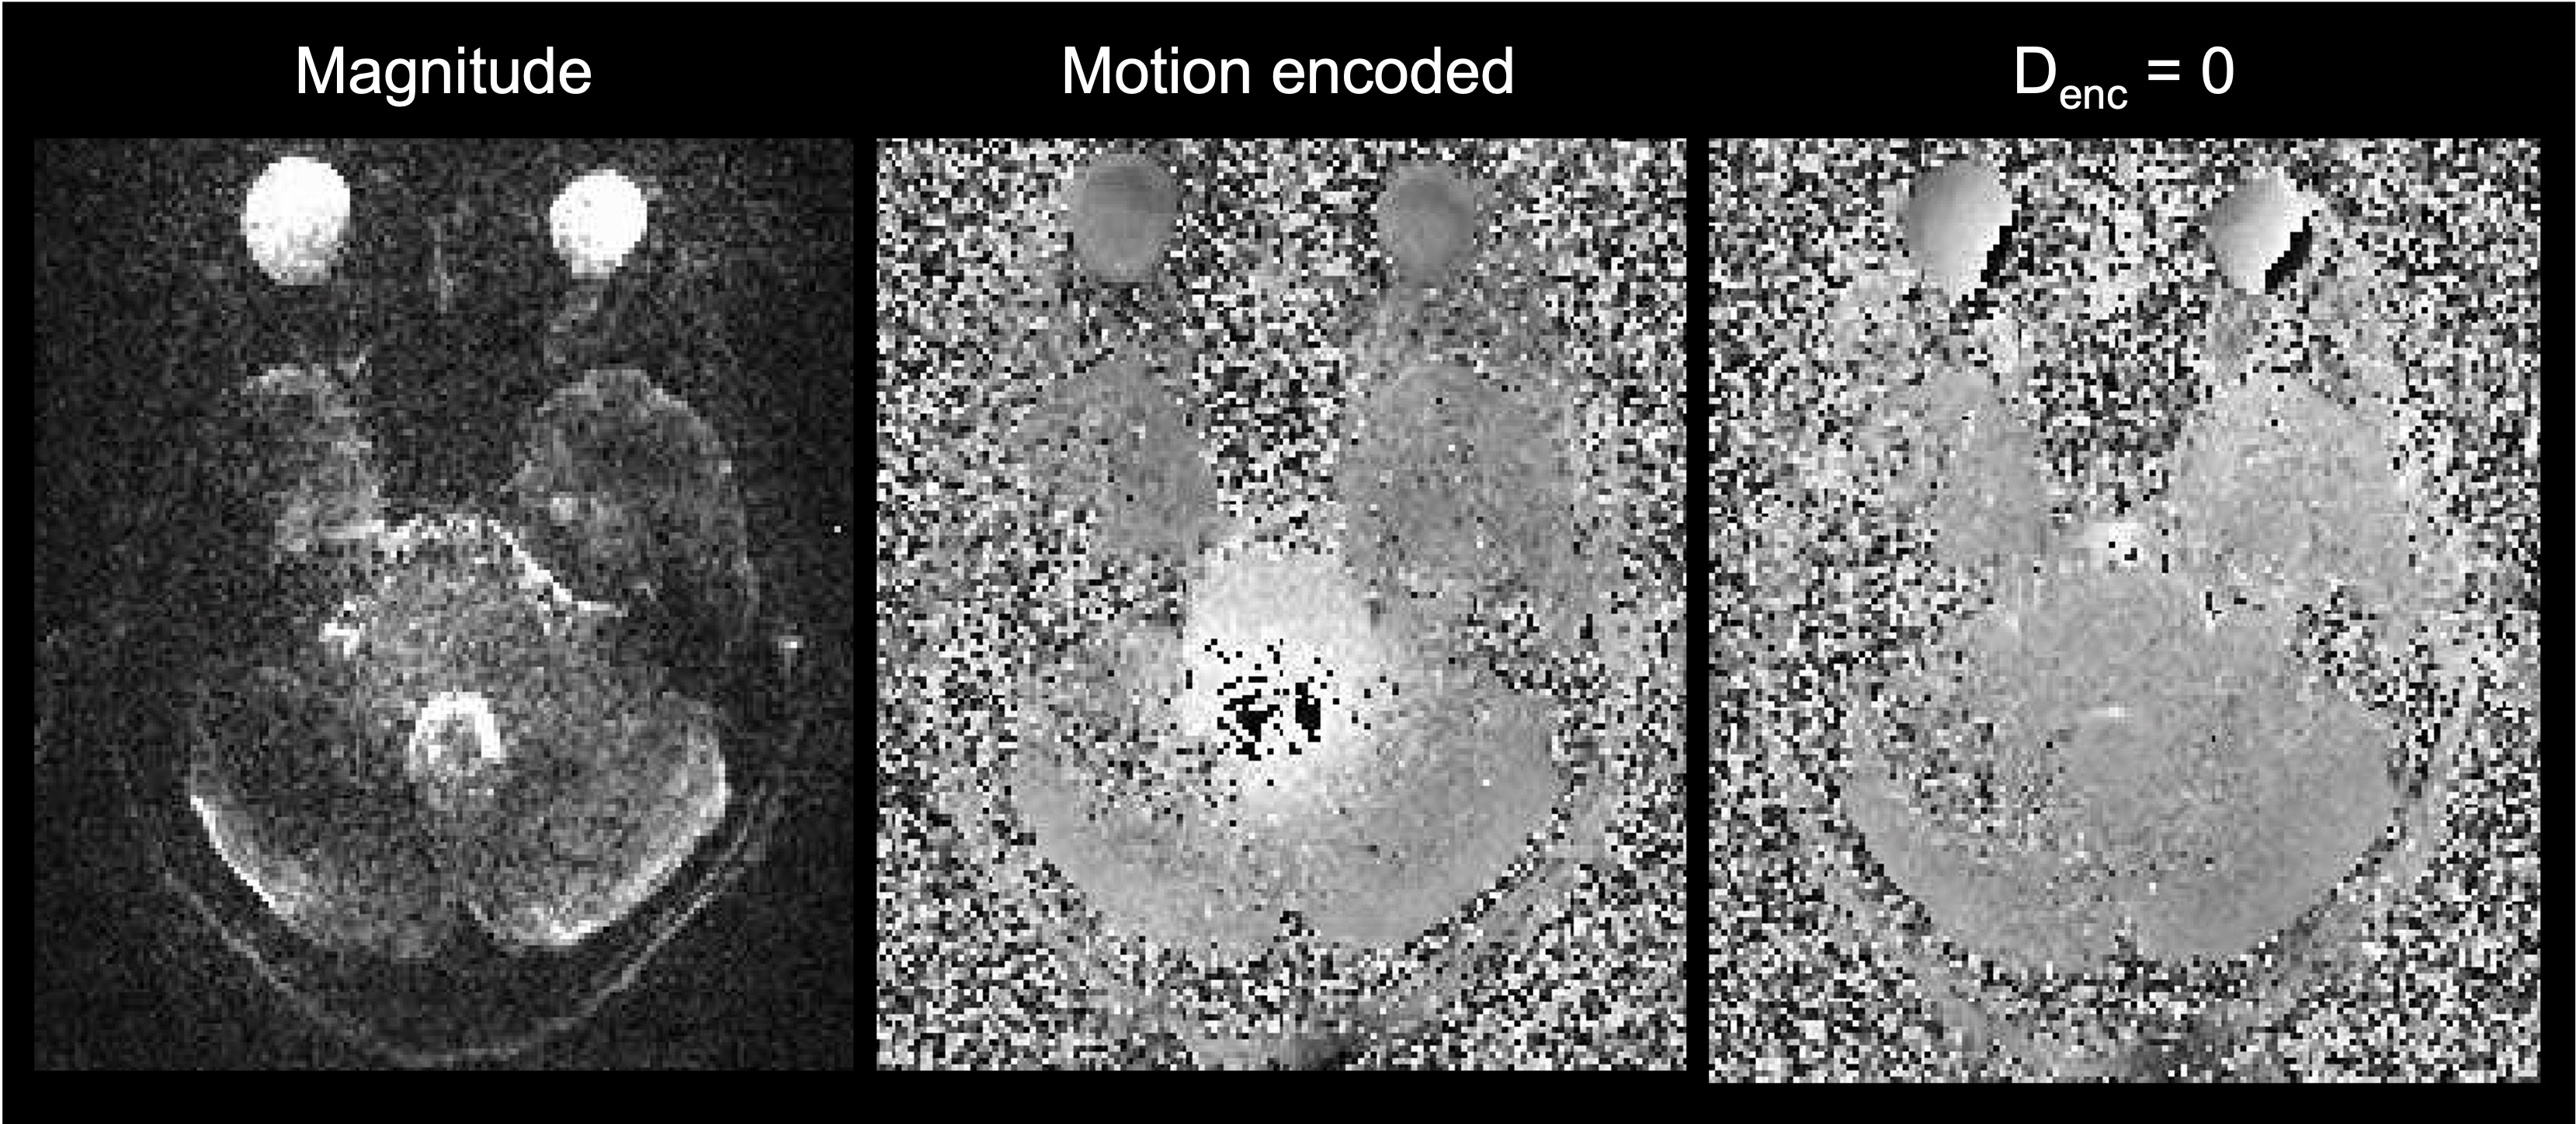
Figure 4. Representative magnitude- and phase-valued images in the highest resolution acquisitions with 1.2 mm in-plane resolution and 2mm slice thickness. Phase wraps can be seen in these data; however, low SNR in the center of the brain makes phase unwrapping challenging. Ongoing work seeks to robustly remove these phase wraps.