4087
A Comparison of Cartesian MR Fingerprinting Maps acquired at 3T and 7T
Saba Shirvani1, Belinda Ding2, and Christopher T. Rodgers1
1Clinical Neurosciences, University of Cambridge, Cambridge, United Kingdom, 2Research and Collaboration UK, Siemens Healthcare Ltd, Frimley, United Kingdom
1Clinical Neurosciences, University of Cambridge, Cambridge, United Kingdom, 2Research and Collaboration UK, Siemens Healthcare Ltd, Frimley, United Kingdom
Synopsis
Keywords: High-Field MRI, High-Field MRI, body, mr fingerprinting, tissue characterization
Abdominal 7T MRI is technically demanding but has great potential due to improved signal-to-noise ratio. One promising way to quantify tissue properties is to use MR Fingerprinting, since MRF rapidly quantifies T1 relaxation alongside other tissue properties such as T2, B1+ and proton density. However, translating MRF measurements from high field to ultra-high field systems is challenging. Here we investigate a strategy to translate a Cartesian MRF sequence from 3T to 7T scanners, by optimising sequence parameters. We apply this approach to the brain and to the kidney and present comparable images from our 3T and 7T scanners.Introduction
As part of our EU FET-OPEN project “Non-invasive chemistry imaging” (NICI), we are preparing to perform rapid abdominal imaging techniques to perform a clinical study using 7T MRI. MR fingerprinting (MRF) [1] is an innovative technique that provides qualitative and quantitative data from a single exam. As a T1 and T2 mapping method, MRF has demonstrated itself as a fast, repeatable method with excellent single-site and cross-site reproducibility [1] . Most MRF studies published to date have been performed at 1.5 and 3T [2]. Recently, ultra-high-field MRI has attracted increasing attention because it can provide higher signal-to-noise-ratio, spatial resolution, and contrast than 1.5T and 3T MRI.To adapt the full diagnostic potential of MRF in the abdomen at ultra-high field, one needs to overcome the most pressing problem, which is dielectric effects which tend to produce non-uniform transmit B1+ fields. These effects are worse for larger imaging regions of interest, so worse in abdomen than in brain. As the RF wavelength becomes shorter than the dimensions of the object to be imaged, significant B1+ field distortions occur that strongly vary on electromagnetic properties of tissue. This abstract describes our work to investigate Cartesian k-space MR Fingerprinting as a step towards rapid assessment of T1, T2, and B1+ at ultra-high field (7T) and high-field (3T). We compare 3T and 7T MRF images of brain and kidneys acquired in the same subject.
Methods
Scans were performed on a MAGNETOM Terra 7T scanner (Siemens Healthineers, Germany), equipped with a 8Tx/32Rx head coil (Nova Medical) and a PRISMA 3T scanner (Siemens Healthineers, Germany) equipped with a 1Tx/32Rx head coil. Abdominal images on the 7T scanner were performed with a 8Tx/Rx dipole body array (Tesla DC), and a 18-channel TIM body coil (Siemens Healthineers) for 3T.A healthy participant was scanned in a transverse slice to acquire data to test Cartesian MRF in the brain for both 3T and 7T. A second healthy participant was scanned with same protocol for a renal acquisition at 3T and 7T. Our MRF sequence is based on FLASH with variable flip angles (FA) and fixed repetition time (TR ), as shown in Figure 1. The parameters were as comparable as possible for 3T and 7T: MRF images were acquired with a Cartesian k-space trajectory with an FOV of 250x250mm2, slice-thickness of 5mm. The matrix size was 128x128 for 512 measurements, TR/TE = 16ms/3.1ms at 3T and 7T. The bandwidth at 7T was 2170Hz/pixel and at 3T 1860Hz/pixel. Phantom data was acquired in a transverse slice in an agar phantom [3]. B1+ maps were acquired using a turbo-FLASH B1-mapping pulse sequence (‘tfl_map’).
This Cartesian MRF approach was matched against an Extended Phase Graph (EPG) dictionary simulation to make quantitative parameter maps in a voxel-by-voxel basis. The MRF framework pipeline includes dictionary generation based on extended phase graph [4] formalism. The vector-dot product matching and quantitative map generation was implemented from scratch in MATLAB (Mathworks,2021b).
Results and Discussion
Figure 1 shows our Cartesian MR Fingerprinting pulse sequence design, with a schematic representation of the changes that were made to the original FLASH sequence. We have adapted the direction of line acquisition with a varying flip angle pattern, showing the raw k-space acquisition for 512 measurements. An image is then reconstructed through Fourier transform from the same block of flip angle pulses. Figure 2 demonstrates a comparison of magnitude images of the brain for the same participant acquired at 3T and 7T. We present the successful signal evolution of the fingerprints for the healthy subject, and a range of 10 next closest dictionary entries from the simulations (shown in pink shading). In Figure 3, we computed corresponding T1 maps, T2 maps, B1+maps and proton density maps from the same slice for 3T and 7T in the brain, which are B1-corrected. These high-resolution quantitative parametric maps show similar features throughout the brain, indicating more B1+ effects observed at 7T as expected from the theory. In Figure 4 we demonstrate quantitative maps for a renal application in a healthy volunteer. Figure 5 demonstrates a Cartesian MRF data with B1 correction acquired in a spherical agar phantom [3] at 7T. We computed the corresponding parametric maps and compare them to a B1-scaled Flip angle ('tfl_map') map, resulting in notable comparable results at 7T.We have acquired high-resolution quantitative maps with Cartesian-sampled k-space datasets with a variable flip angle and repetition time in phantoms, in the brain and for renal applications for 3T and 7T. We have shown the feasibility of Cartesian MR fingerprinting at ultra-high field by comparable high image quality compared to 3T images. Our future work will focus on optimizing our pulse sequence approach further, to optimize further B0 effects that appear at ultra-high field.
Conclusion
We have shown feasibility of high-resolution quantitative parameter mapping with Cartesian MRF at 7T with comparable results to 3T.Acknowledgements
This project has received receives funding from the European Union’s Horizon 2020 research and innovation programme under grant agreement No 801075. CTR was funded by a Sir Henry Dale Fellowship from the Wellcome Trust and the Royal Society [098436/Z/12/B]. This study was supported by the NIHR Cambridge Biomedical Research Centre and MRC Clinical Research Infrastructure Award for 7T. This work was supported by Innovate UK [10032205] under the Guarantee Scheme relating to the EU Horizon Europe project MITI [101058229].References
[1] Buonincontri et al., “Three dimensional MRF obtains highly repeatable and reproducible multi-parametric estimations in the healthy human brain at 1.5T and 3T” NeuroImage, Vol. 226 (2021).
[2] Tippareddy, C., Zhao, W., Sunshine, J.L. et al. Magnetic resonance fingerprinting: an overview. Eur J Nucl Med Mol Imaging 48, 4189–4200 (2021)
[3] Rua, C.et al. “Multi-centre , multi-vendor reproducibility of 7T QSM and R ∗2in the human brain: Results from the UK7T study” Neuroimage 223,117358 (2020).
[4] Weigel, M. Extended Phase Graphs: Dephasing , RF Pulses , and Echoes - Pure and Simple. 295, 266–295 (2015).
Figures
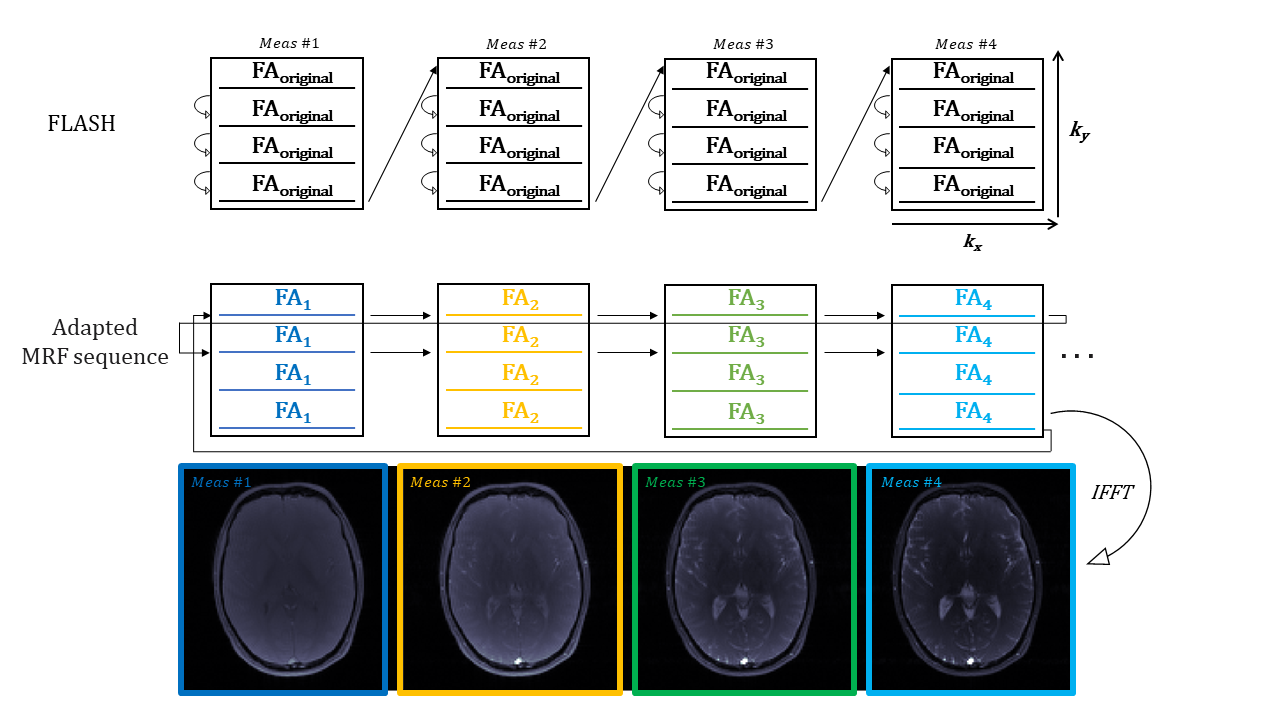
Figure 1. For our Cartesian MRF approach we adapted a FLASH sequence by changing a
varying flip angle train per k-space line acquisition throughout the
measurements. We used a fixed TR=16ms and a sinusoidal flip angle pattern,
consisting of 512 RF Pulses ranging from 5 to 75deg for 128 k-space lines and
512 measurements.
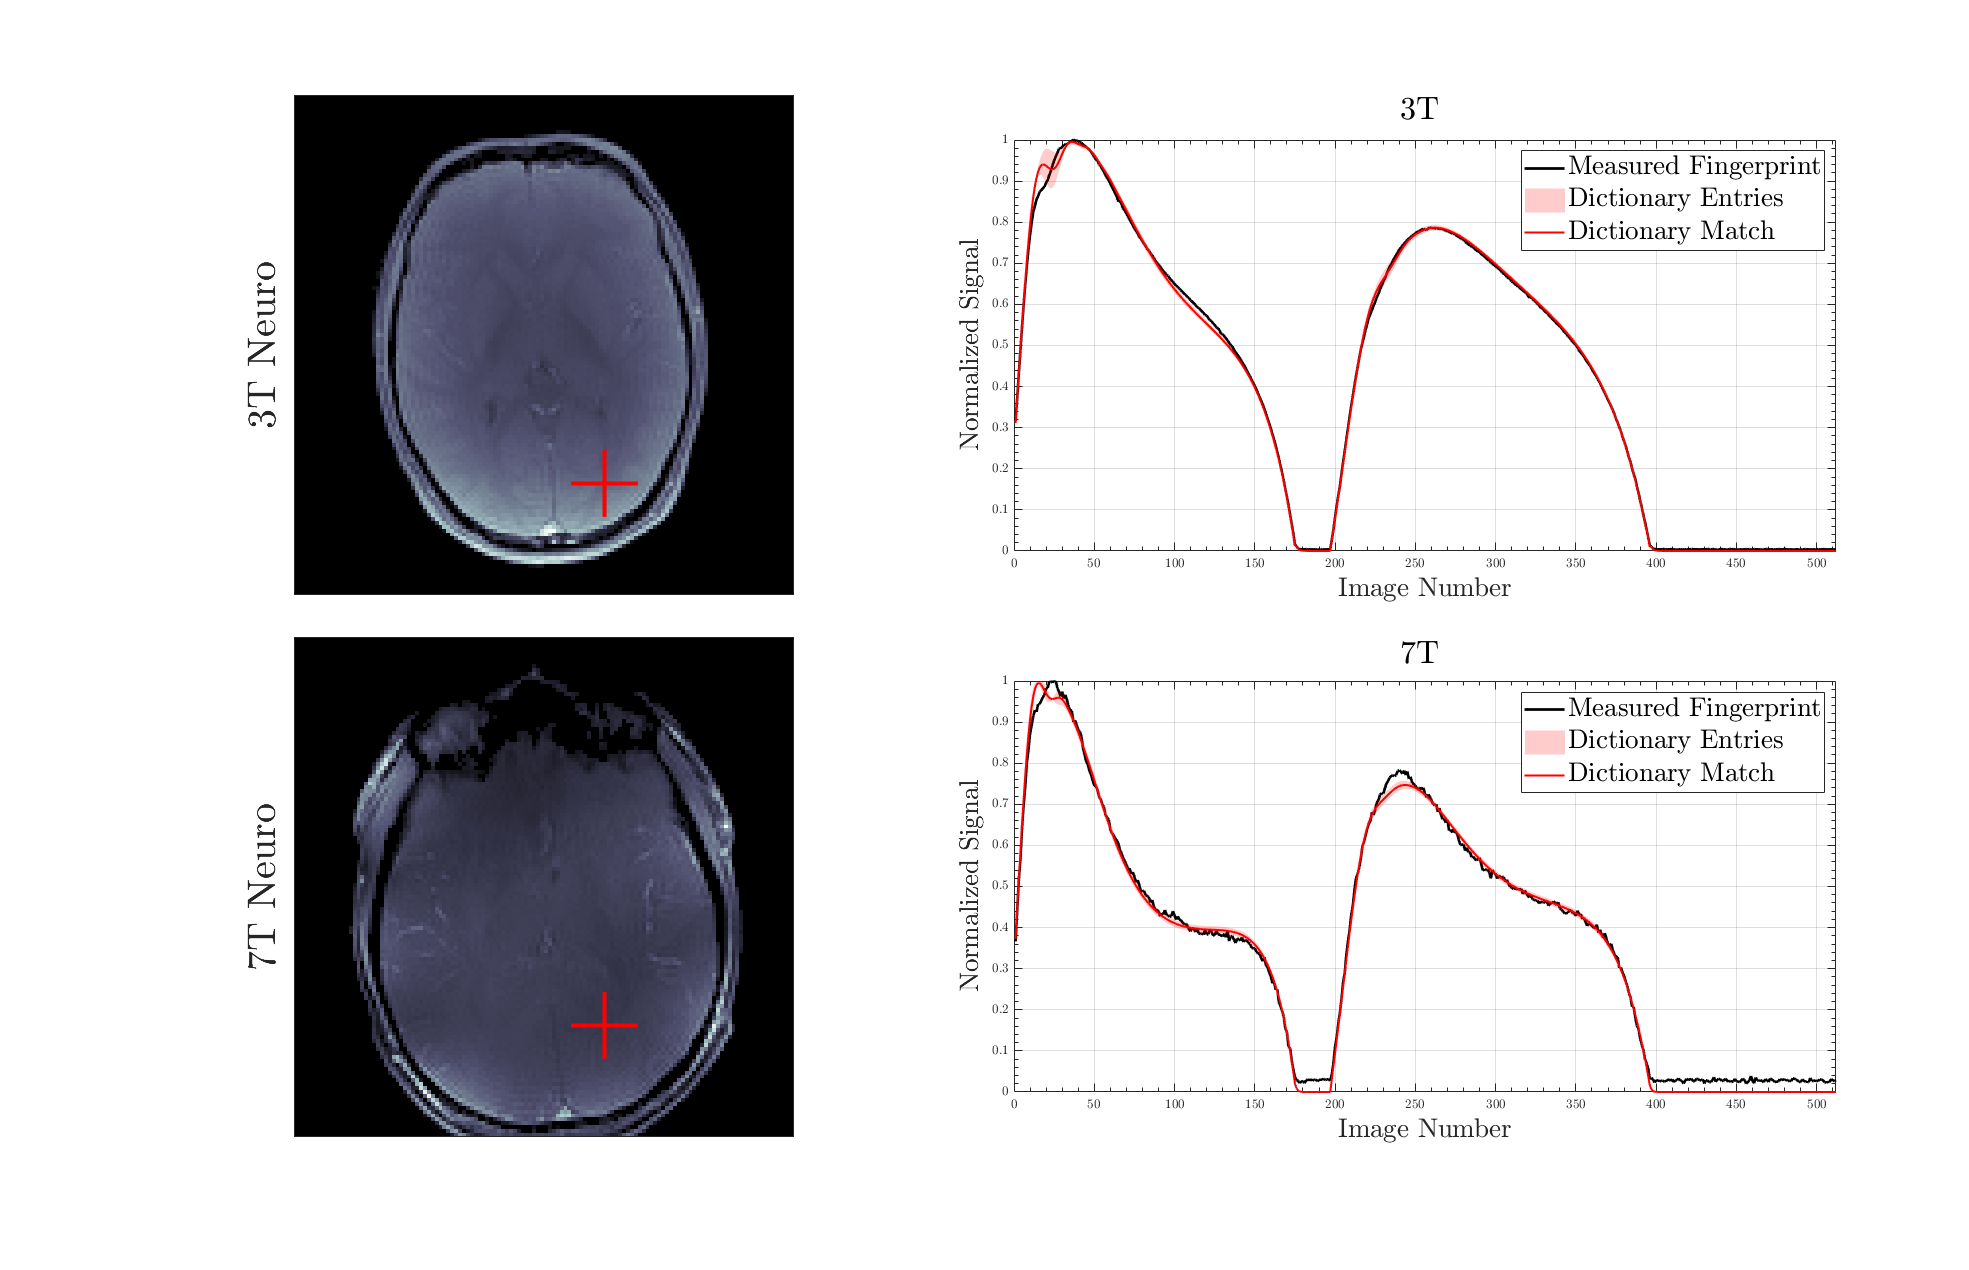
Figure 2.Comparison of magnitude plots of brain images of
the same participant at 3T and 7T. The red cross marked the pixel plotted in
the magnitude images and shows the MRF signal evolution of the fingerprints in
the brain of a healthy subject, with the corresponding range of the 10 next
closest dictionary entries (pink shading). This shows that our model fits
closely with the experimental data and that the optimised dictionary entry is
visibly close.
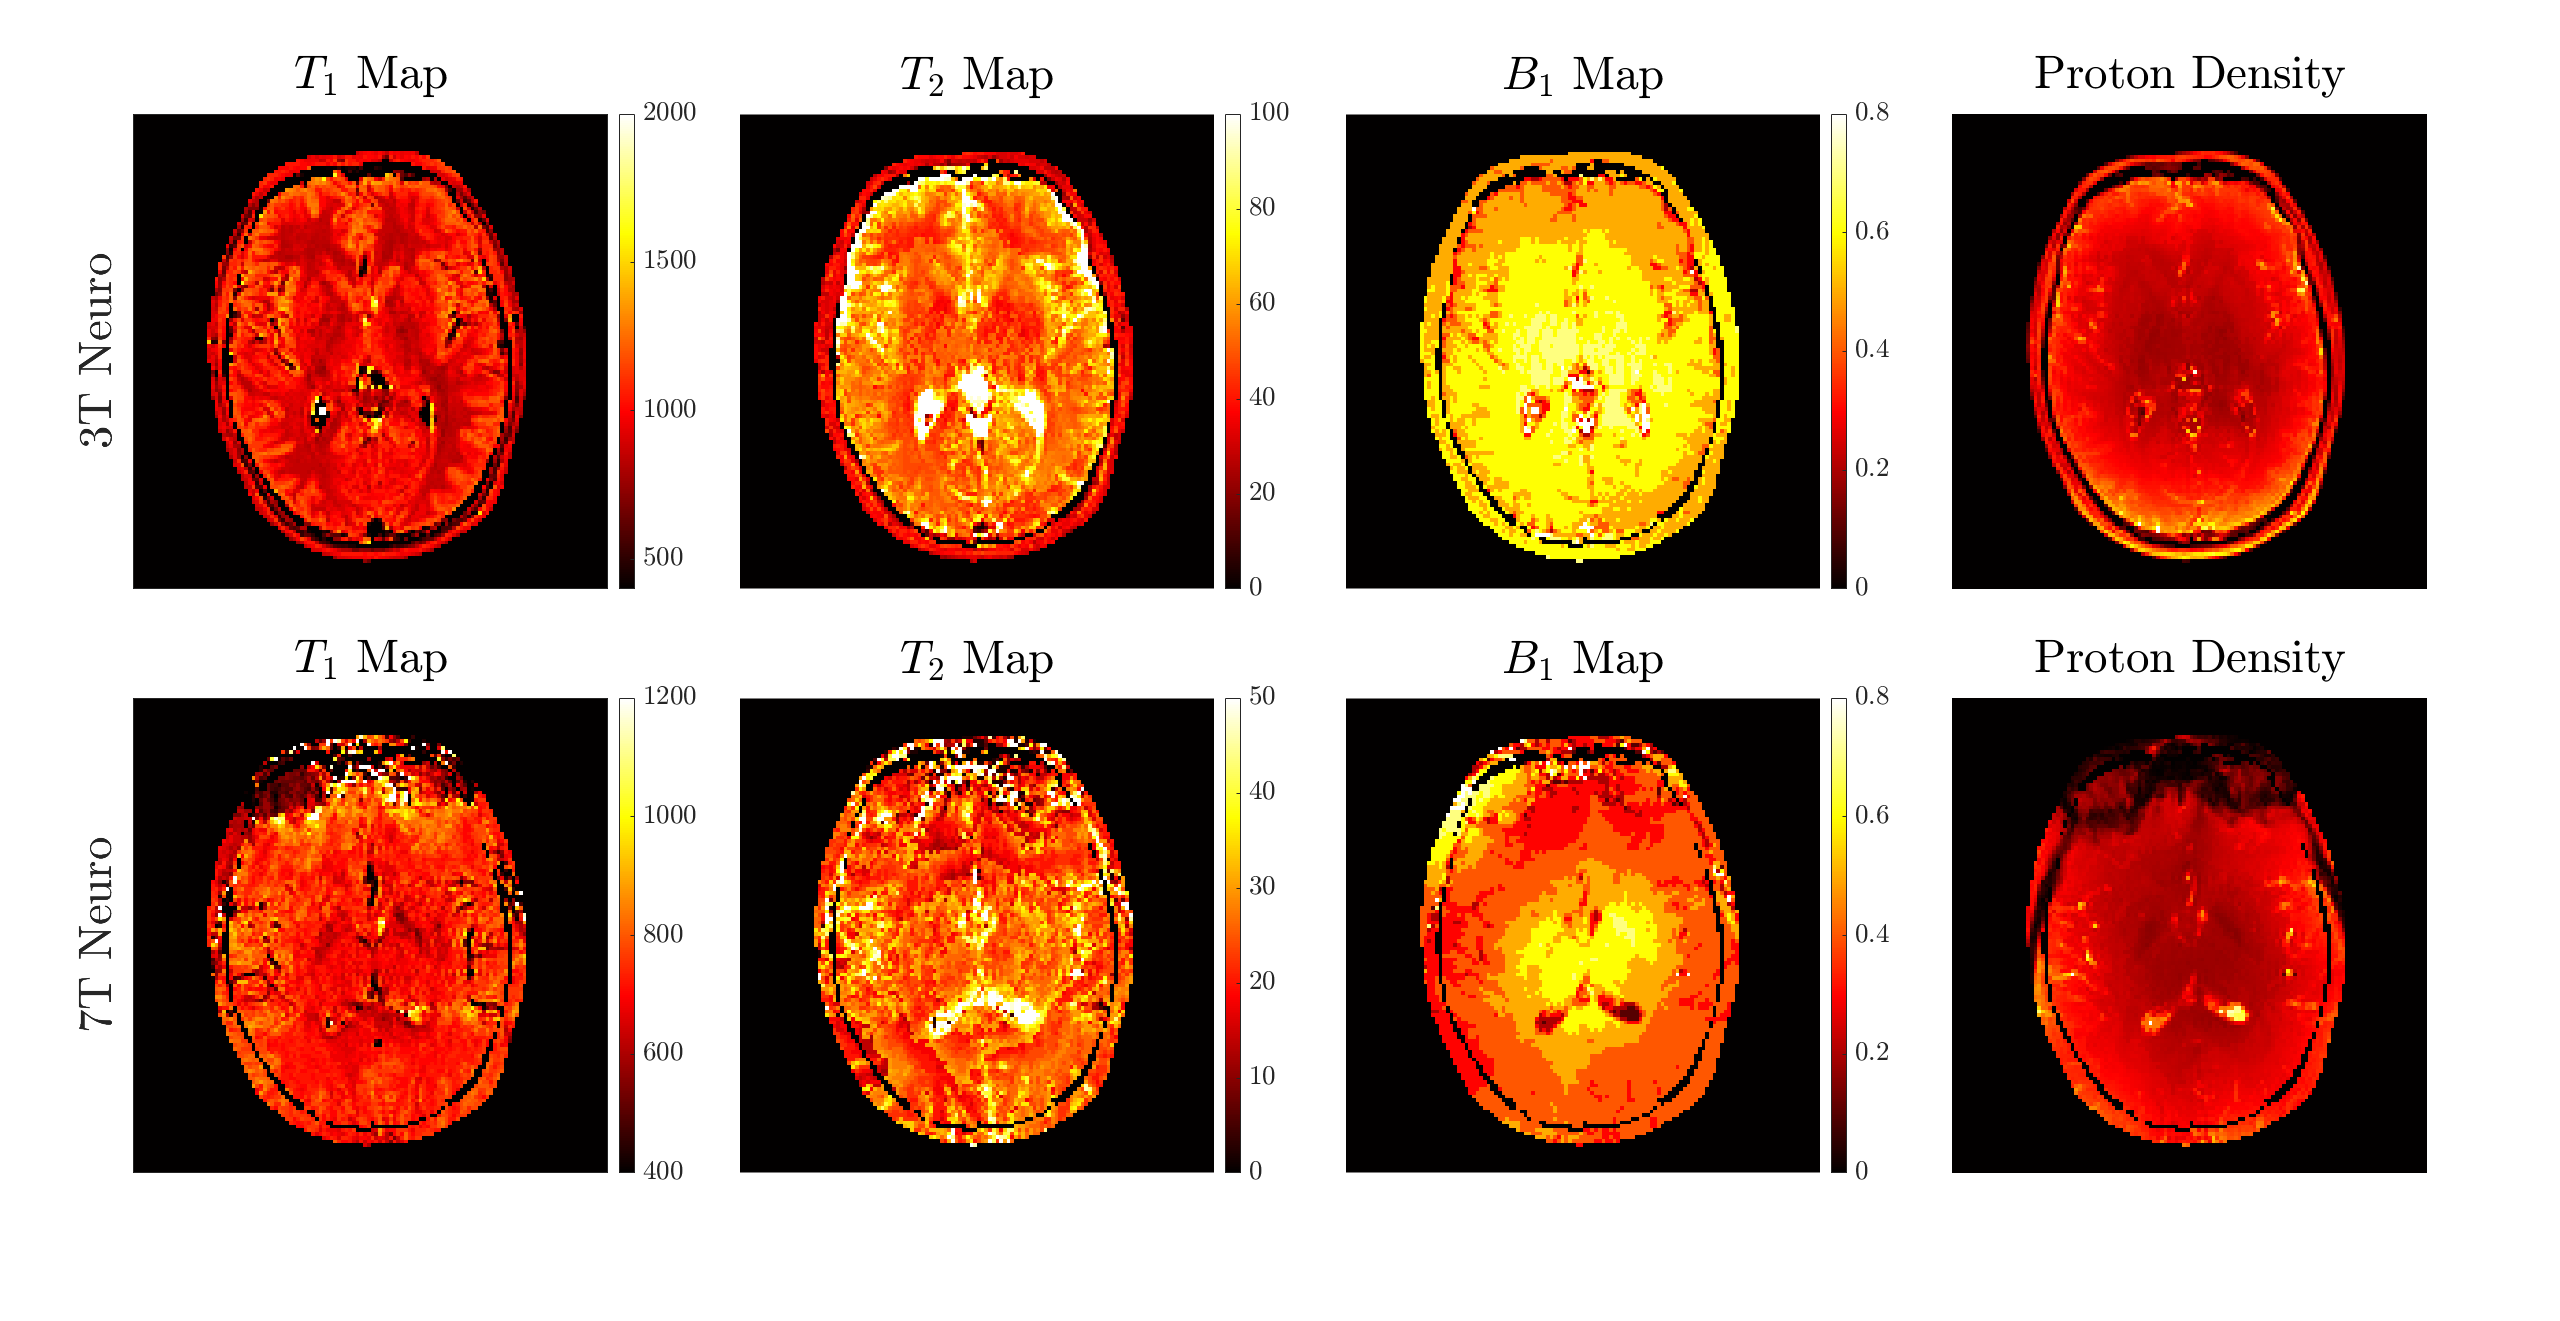
Figure 3. MR Fingerprinting T1, T2, B1+, proton density reconstructed images are presented for 3T and 7T brain data in a
healthy volunteer. All methods show similar property maps throughout the brain.
Qualitatively, there are more B1+ effects observed at 7T
as expect from the theory of dielectric shading and the central brightening
artefact.
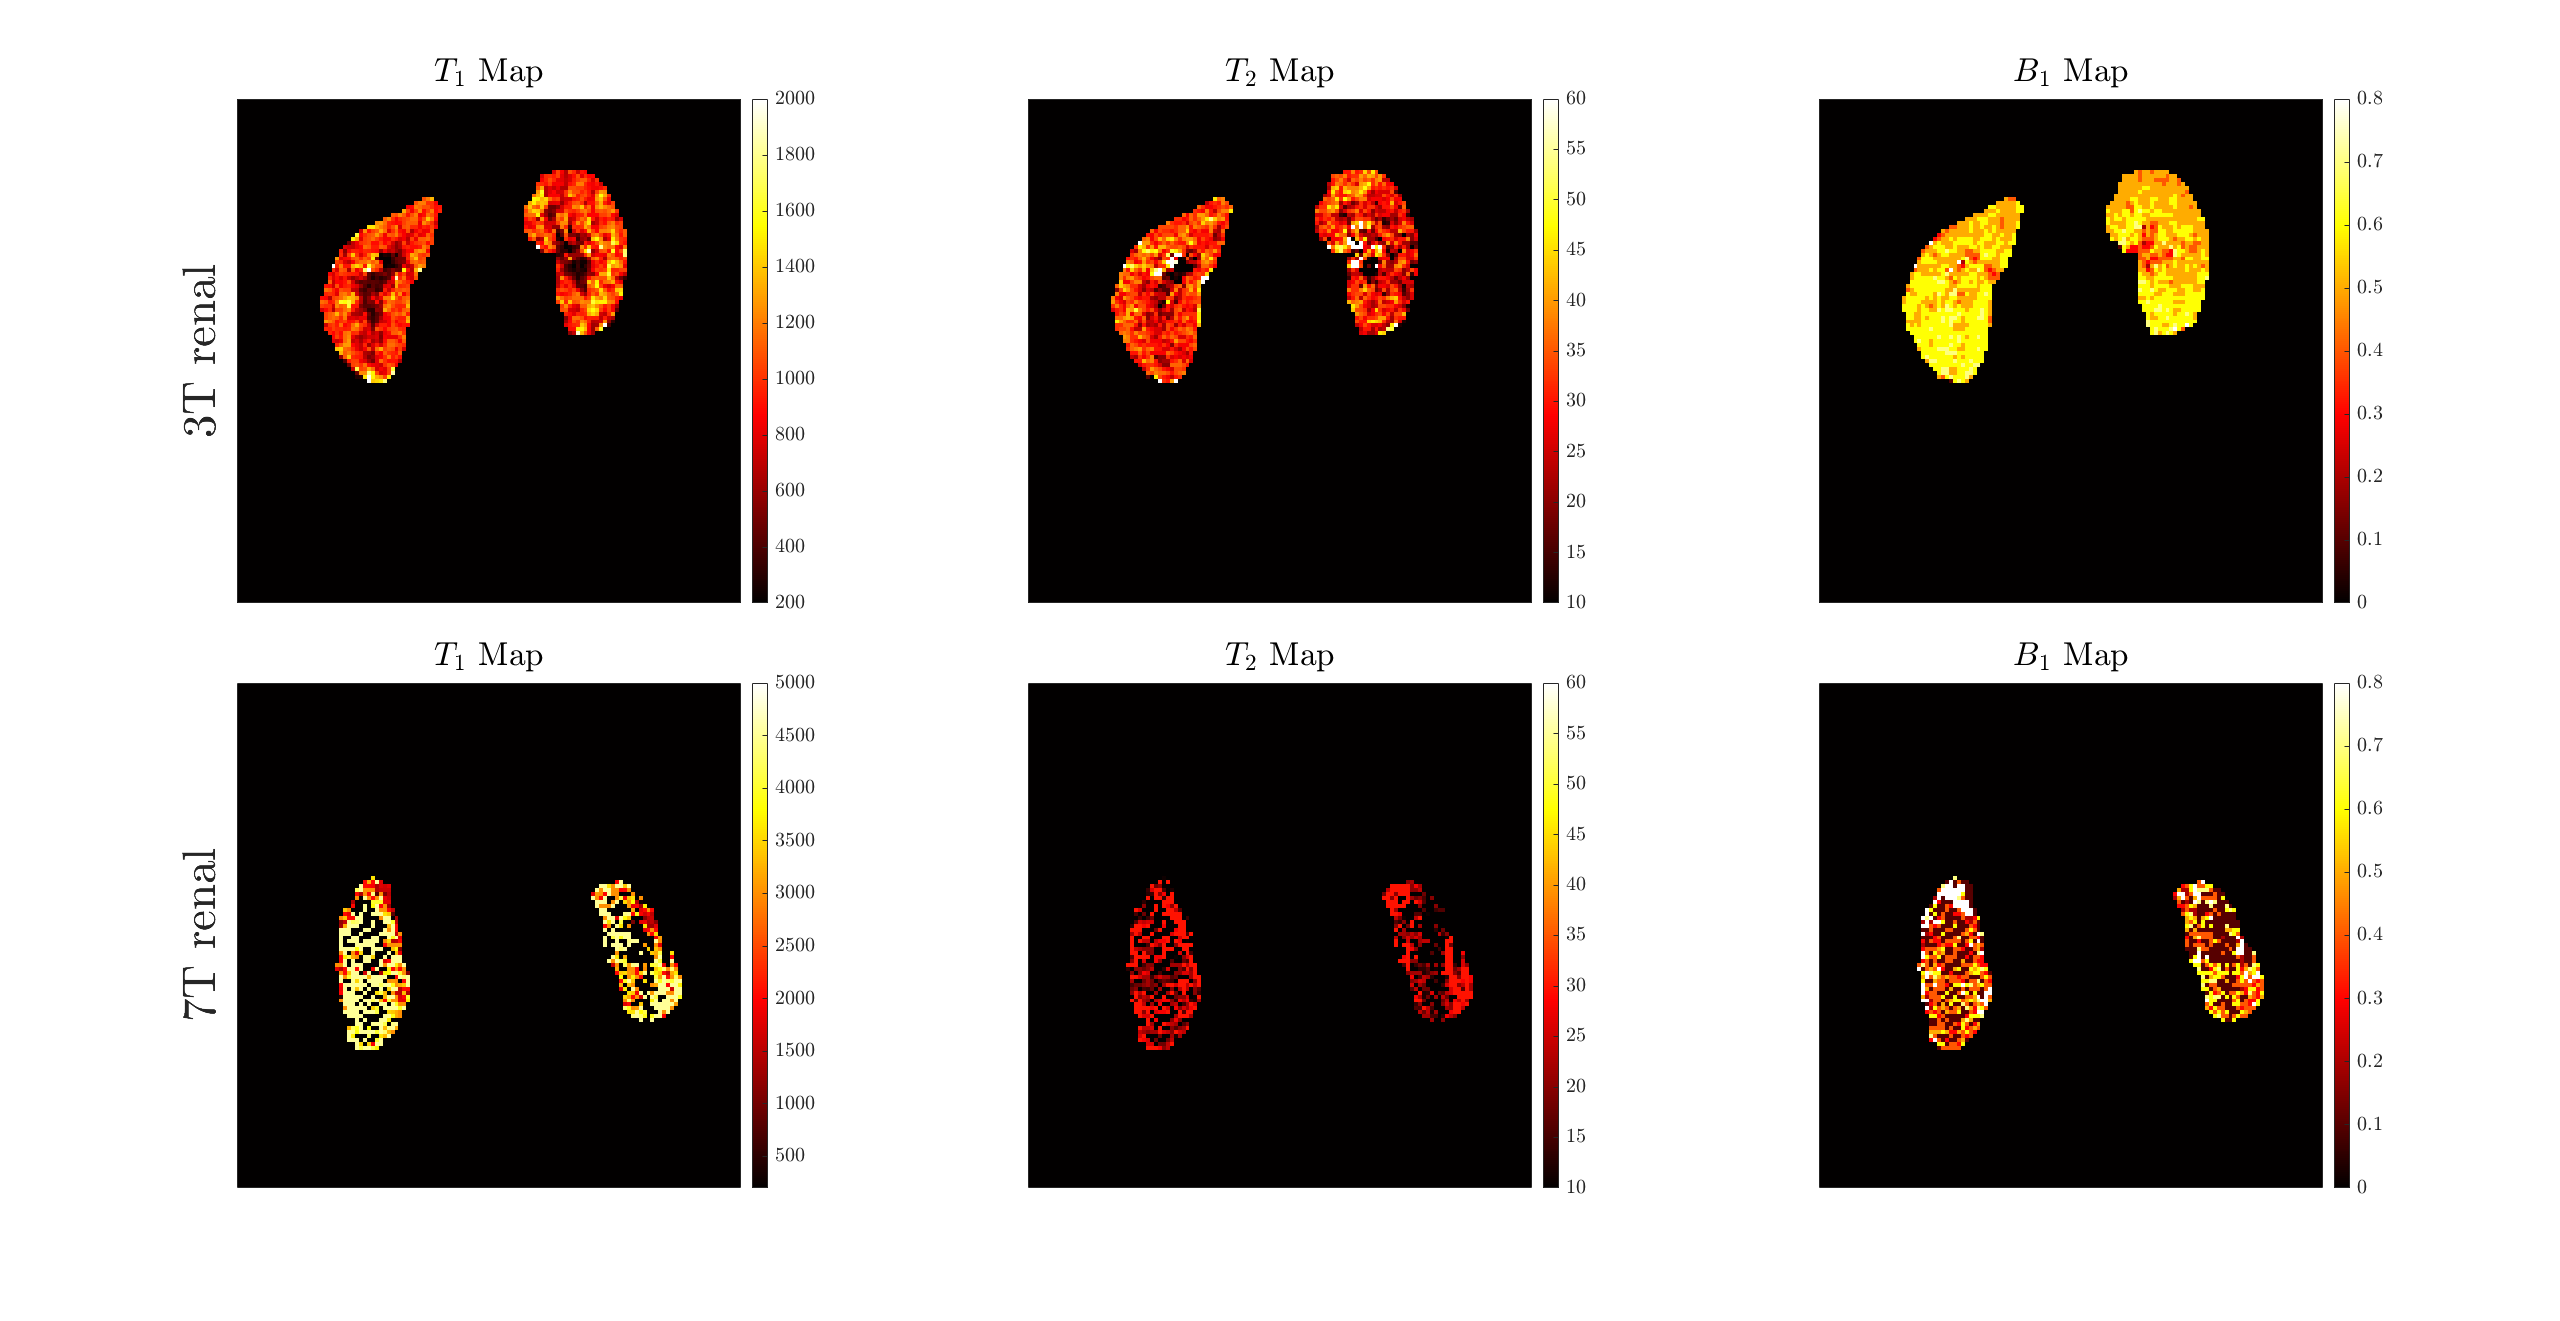
Figure 4. MR Fingerprinting T1, T2, B1+,
Proton Density reconstructed images are presented for 3T and 7T for a renal
application in a healthy volunteer.
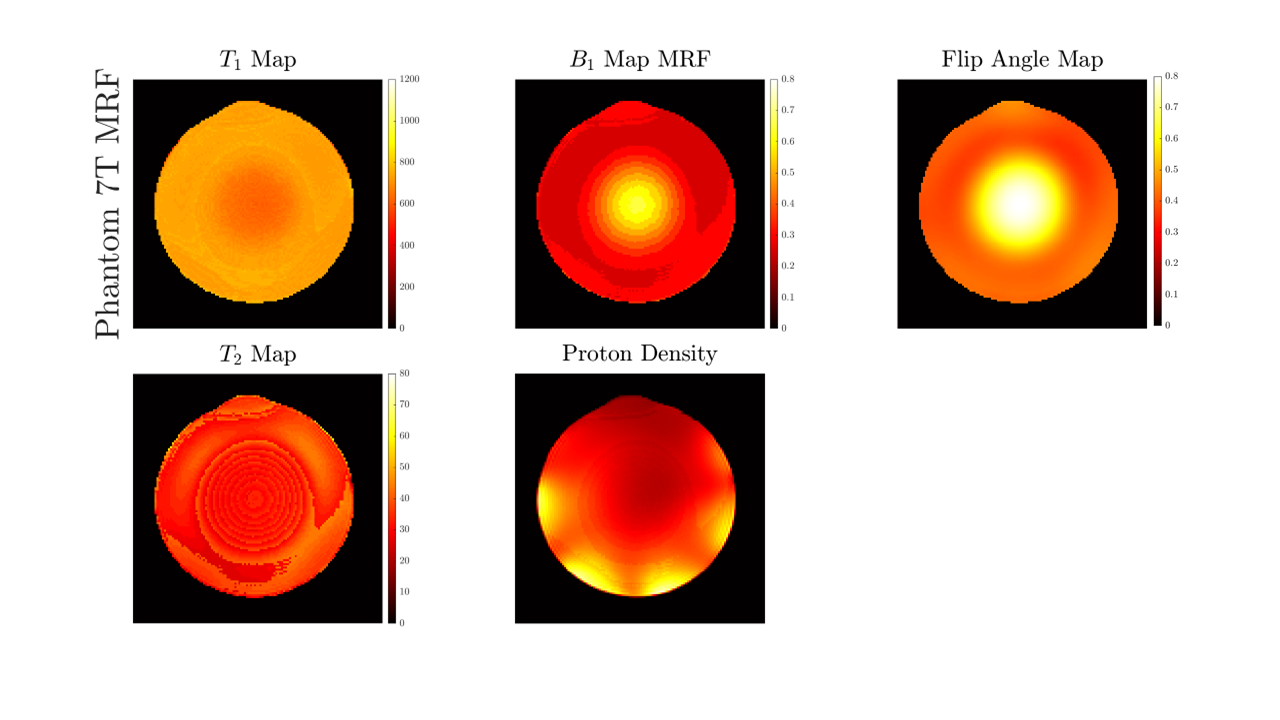
Figure 5 T1, T2, B1+ maps and proton density maps acquired from a uniform agar phantom using our MRF
approach with B1 correction, with an example reference compared to a Flip Angle Map, which is plotted as a B1 scale factor.
DOI: https://doi.org/10.58530/2023/4087