4077
Background Field Inhomogeneity Correction for High-Resolution T2* Mapping of the Human Cervical Spinal Cord at 7T1Department of Electrical and Computer Engineering, Auburn University, Auburn, AL, United States, 2Auburn University MRI Research Center, Auburn University, Auburn, AL, United States
Synopsis
Keywords: High-Field MRI, Spinal Cord, T2* mapping, Artifacts
Ultra-high-field (UHF) Spinal Cord (SC) imaging could be helpful in detecting subtle pathological changes in the human SC. The increased effect of magnetic field inhomogeneity at UHF on T2* renders the quantification unreliable. Therefore, the field correction methods are critical. We have demonstrated the application of the Voxel Spread function method, to address this issue in human SC at 7T. F-term correction was applied to the pre-processed SC images, and the T2* values were reported for SC GM and WM both before and after field inhomogeneity correction. VSF reduces magnetic field inhomogeneity effects for quantitative T2* mapping in human SC.Introduction
Spinal Cord (SC) MRI is valuable in patients suffering from Multiple Sclerosis (MS) or other neurodegenerative diseases that damage white matter 1-6. Ultra-high field (UHF) MRI can help in visualizing SC microstructures and lesions by offering higher SNR and sub-millimeter resolution. Quantitative T2* map is an important tool at high field imaging and enables tracking of disease progression. UHF MRI of the SC suffers from increased macroscopic magnetic field inhomogeneity that needs to be accounted for reliable T2* mapping. Voxel Spread Function (VSF) method is a post-processing technique that removes the background field inhomogeneity contributions on the multi-echo gradient echo (mGRE) signal, producing artifact-free T2* maps 7. Additionally, we can generate co-registered frequency contrast images from the same data. Here we demonstrate state-of-the-art processing techniques, including deep learning-based segmentation, to study the feasibility of high-resolution quantitative T2* mapping of human SC at 7T corrected for background field inhomogeneity. In addition, we also generate naturally co-registered frequency maps which may allow a comprehensive investigation of SC pathology.Methods
Experiments were performed with Siemens 7T Magnetom with an 8-channel surface coil. The 3D mGRE Images were acquired from a healthy subject with the following parameters: 22 slices with a resolution of 0.5×0.5x3 mm3, TR = 40 ms, flip angle 45˚, and nine gradient echo images with TE(0) = 2.42 ms and echo spacing of 3.6 ms. Raw data was transferred to a workstation and analyzed with the Spinal Cord Processing Toolbox (SCT) 8 and MATLAB (MathWorks, Natick, MA). Data from all channels were combined using the following formula to remove the channel phase dependence as described in 7 :$${S_{comb}}(T{E_n}) = {1 \over M} \cdot \sum\nolimits_{m = 1}^M {{\eta _m} \cdot S_m^*(T{E_1})} \cdot {S_m}(T{E_n}),{\rm{ (1)}}$$
$${\eta _m} = {1 \over {M\sigma _m^2}} \cdot \sum\nolimits_{m' = 1}^M {\sigma _{m'}^2} ,{\rm{ (2)}}$$
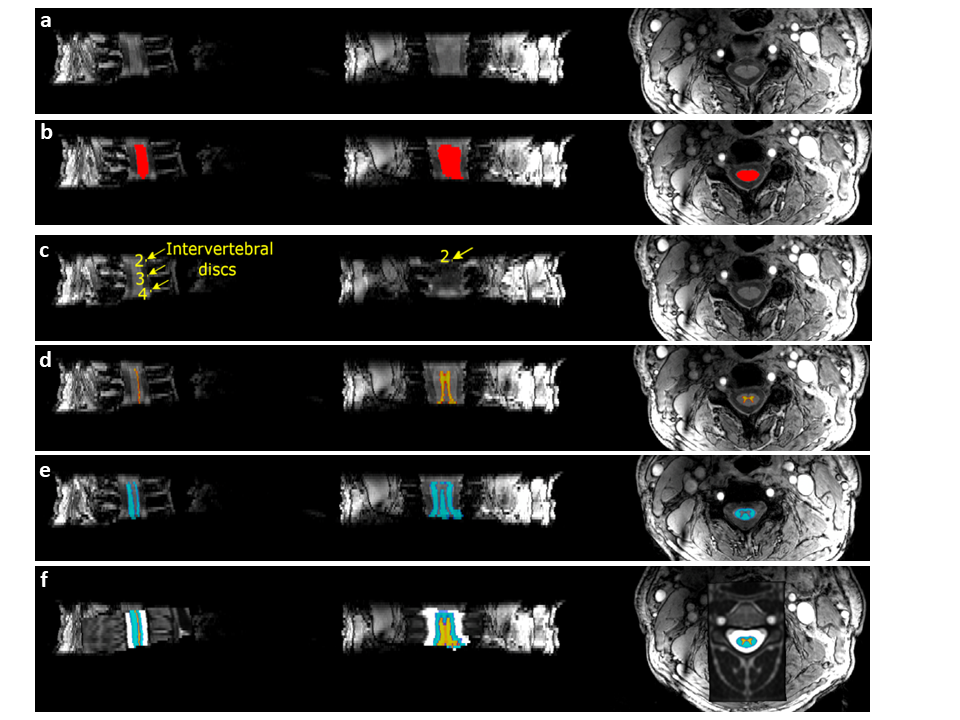
M is the number of channels, S(TE) is the signal at a given TE, S*(TE) is the complex conjugated signal, and $$${\sigma _m}$$$ is the noise level at channel m. The magnitude image from the first echo (Figure 1a) was used for SC segmentation. The SC was segmented using the deep learning-based algorithm in the SCT toolbox (Figure 1b). Vertebral labeling was performed manually on the segmented SC by selecting the posterior tip of each of the imaged intervertebral discs (Figure 1c). The resulting segmented, labeled image was then registered to the PAM50 SC Template 9, and the SC GM and WM masks were generated (Figure 1d-1f). VSF method was then applied to the segmented regions. The VSF approach calculates F-function (F(.)) from multi-gradient echo phase images to determine the contribution of the magnetic field inhomogeneity on signal decay. This F-function is then used to eliminate/reduce the effect of magnetic field inhomogeneity in T2* calculations using the following signal model:
$$S(TE) = S(0) \cdot \exp ({{ - TE} \over {T_2^*}}) \cdot \exp ( - i2\pi f \cdot TE + i\varphi ) \cdot F(TE),{\rm{ (3)}}$$
Where S(0) is the amplitude, T2* is the relaxation time constant, f is the frequency map, $$$\varphi $$$ is the phase, and TE is the echo time. Least-squares fitting was performed on the complex data in MATLAB. T2*-maps were also generated without background field inhomogeneity correction.
Results
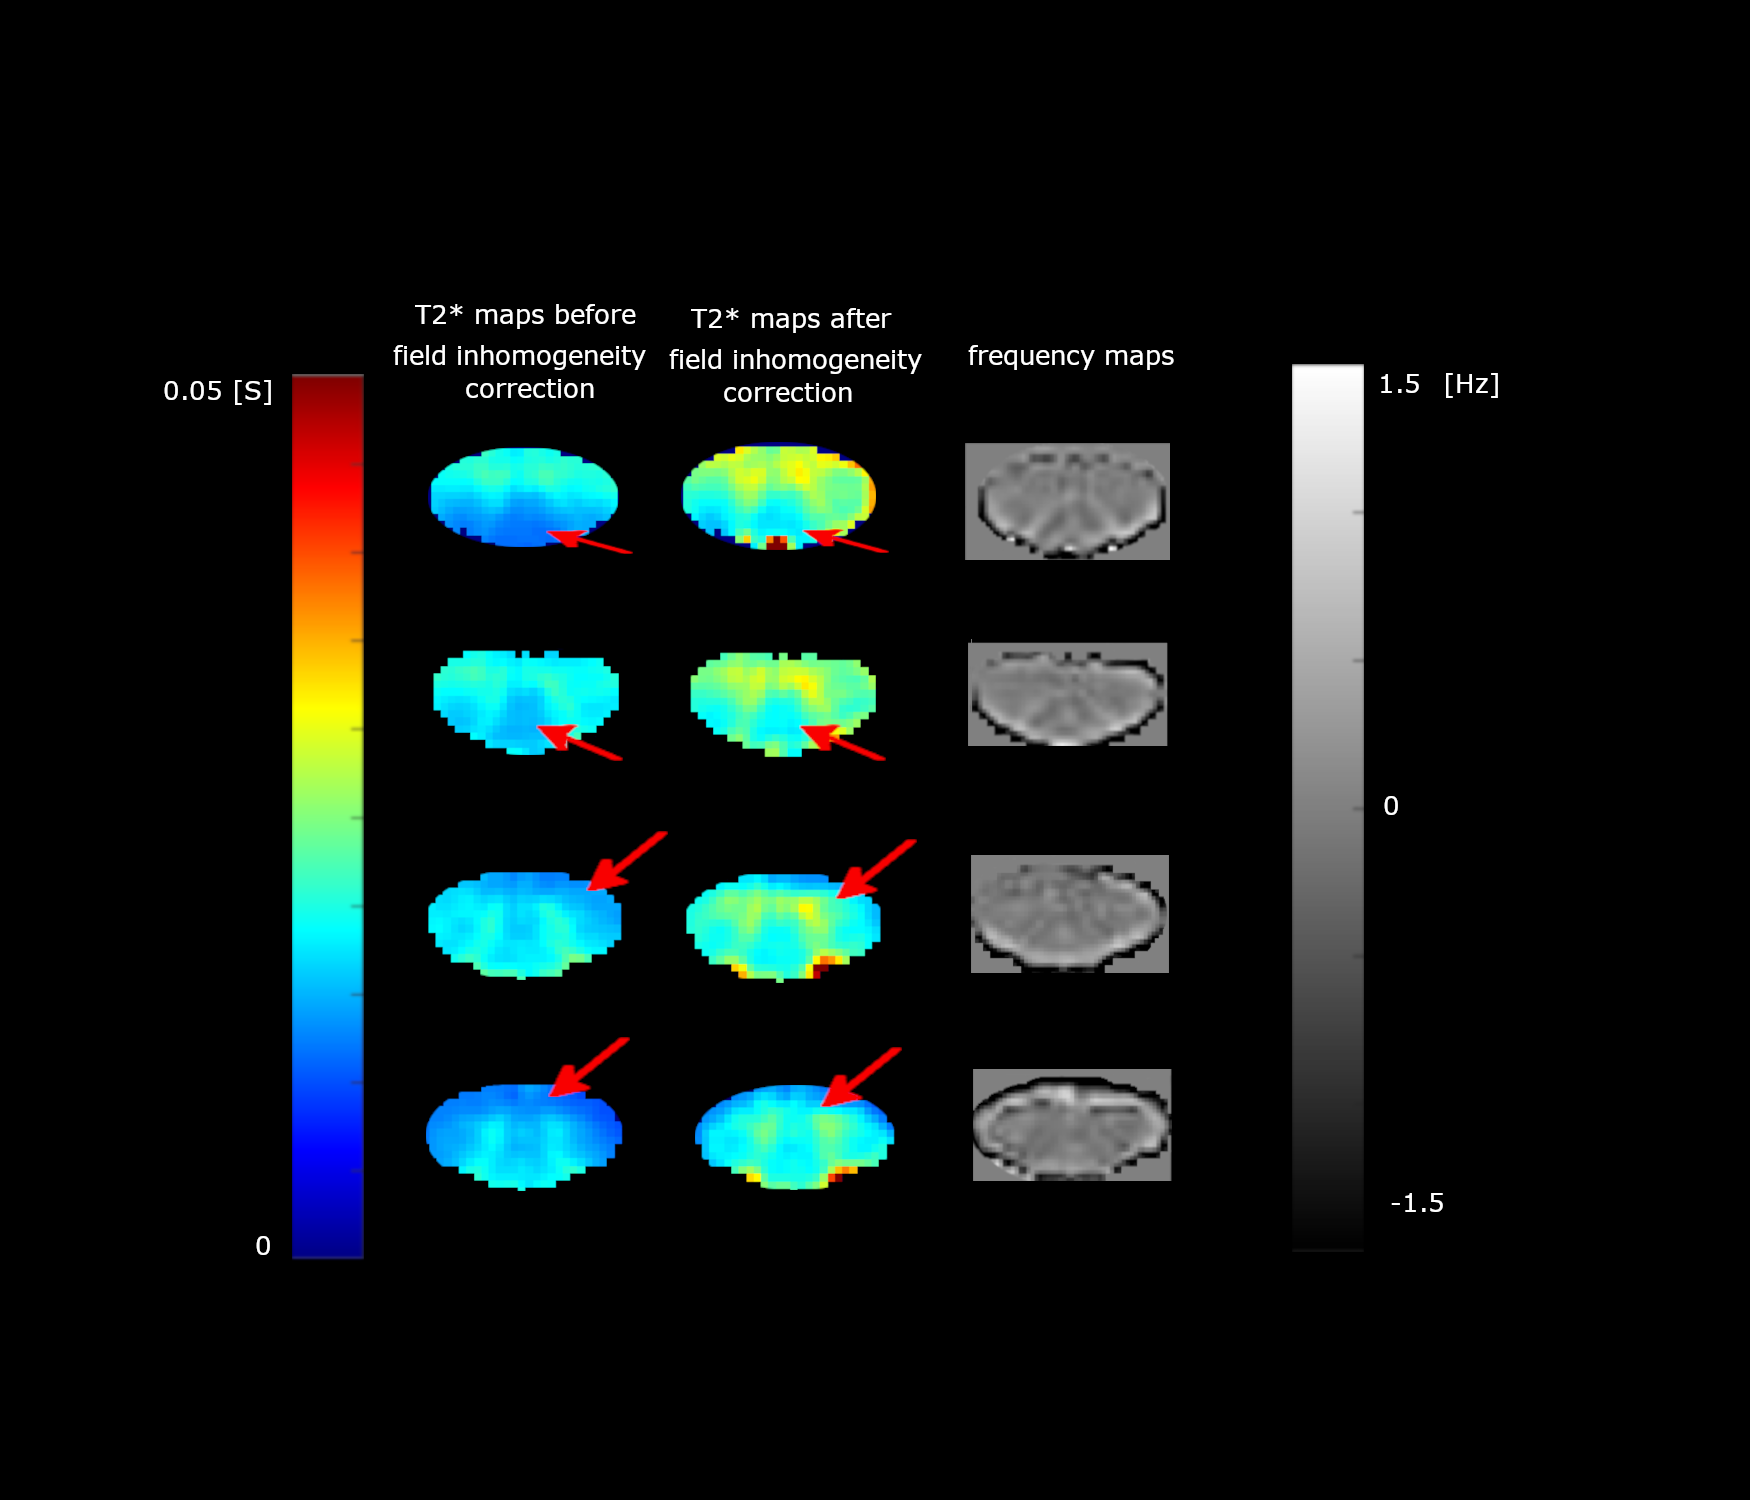
Figure 2 shows the T2* and frequency maps of different slices obtained after fitting Eq. 3 to the complex data. T2* values increased in both SC GM and WM and T2* contrast between the two regions was also enhanced. In addition to improving the estimate of gray and white matter T2*, the VSF correction significantly reduces magnetic field inhomogeneity artifacts in the regions marked with red arrows. The average T2* values in the GM and WM with/without accounting for the background field correction are in Table 1.Table 1. Average T2* in human SC GM and WM. The average T2* values increased after background field inhomogeneity correction for both SC GM and WM.
| Slice number | SC GM T2* (mean ± std) [ms] | SC WM T2* (mean ± std) [ms] | ||
| Before background field inhomogeneity correction | After background field inhomogeneity correction | Before background field inhomogeneity correction | After background field inhomogeneity correction | |
| 1 | 19 ± 2.3 | 26.6 ± 2.6 | 16.1 ± 3.3 | 23.3 ± 4.7 |
| 2 | 19.8 ± 1.2 | 26.7 ± 2.3 | 17.8 ± 1.7 | 22.5 ± 2.8 |
| 3 | 18.9 ± 1.5 | 25.4 ± 2.3 | 17.2 ± 2.1 | 21.3 ± 4.6 |
| 4 | 16.6 ± 1.5 | 22.4 ± 1.8 | 14.8 ± 2.5 | 19 ± 4 |
Discussion and Conclusion
In this work, we successfully implemented SCT analysis and VSF to generate high-resolution quantitative T2* and frequency maps in the spinal cord. T2* maps are generated from the same mGRE data that was used for segmentation and registration, hence there is no need re-register the obtained maps. The T2* value in general increased after background field correction and the method was able to enhance gray/white matter T2* contrast. This work shows that the VSF method is effective in reducing background field inhomogeneity from T2* estimates in SC. it is possible to generate other contrast-weighted images such as T1-weighted, and susceptibility-weighted images from the same dataset. Application at ultra-fields will enable an increased SNR and improved spatial resolution that helps visualize the human SC micro-structures.Acknowledgements
No acknowledgement found.References
1. Dula AN, Pawate S, Dortch RD, Barry RL, George-Durrett KM, Lyttle BD, et al. Magnetic resonance imaging of the cervical spinal cord in multiple sclerosis at 7T. Multiple Sclerosis Journal. 2016;22(3):320-8.
2. Ciccarelli O, Werring DJ, Barker GJ, Griffin CM, Wheeler-Kingshott CA, Miller DH, et al. A study of the mechanisms of normal-appearing white matter damage in multiple sclerosis using diffusion tensor imaging. Journal of neurology. 2003;250(3):287-92.
3. Demir A, Ries M, Moonen CT, Vital J-M, Dehais J, Arne P, et al. Diffusion-weighted MR imaging with apparent diffusion coefficient and apparent diffusion tensor maps in cervical spondylotic myelopathy. Radiology. 2003;229(1):37-43.
4. Wheeler-Kingshott C, Stroman PW, Schwab J, Bacon M, Bosma R, Brooks J, et al. The current state-of-the-art of spinal cord imaging: applications. Neuroimage. 2014;84:1082-93.
5. Kreiter DJ, van den Hurk J, Wiggins CJ, Hupperts RM, Gerlach OH. Ultra-high field spinal cord MRI in multiple sclerosis: Where are we standing? A literature review. Multiple Sclerosis and Related Disorders. 2022;57:103436.
6. Bussas M, El Husseini M, Harabacz L, Pineker V, Grahl S, Pongratz V, et al. Multiple sclerosis lesions and atrophy in the spinal cord: Distribution across vertebral levels and correlation with disability. NeuroImage: Clinical. 2022;34:103006.
7. Yablonskiy DA, Sukstanskii AL, Luo J, Wang X. Voxel spread function method for correction of magnetic field inhomogeneity effects in quantitative gradient‐echo‐based MRI. Magnetic resonance in medicine. 2013;70(5):1283-92.
8. De Leener B, Lévy S, Dupont SM, Fonov VS, Stikov N, Collins DL, et al. SCT: Spinal Cord Toolbox, an open-source software for processing spinal cord MRI data. Neuroimage. 2017;145:24-43.
9. De Leener B, Fonov VS, Collins DL, Callot V, Stikov N, Cohen-Adad J. PAM50: Unbiased multimodal template of the brainstem and spinal cord aligned with the ICBM152 space. Neuroimage. 2018;165:170-9.
Figures