4070
The Feasibility Study of Extraocular Muscle Volume in Patients with Myasthenia Gravis Based on 3D TOFMRA
Qin Zhou1, Pei Chen1, Zhiyun Yang1, Xiaoxiao Zhao2, Yingxi Chen1, and Mengzhu Wang3
1The first affiliated hospital of sun yat-sen university, Guangzhou, China, 2The first affiliated hospital of sun yat-sen university, Guanzhou, China, 3MR Scientific Marketing, Siemens Healthineers Ltd, Guanzhou, China
1The first affiliated hospital of sun yat-sen university, Guangzhou, China, 2The first affiliated hospital of sun yat-sen university, Guanzhou, China, 3MR Scientific Marketing, Siemens Healthineers Ltd, Guanzhou, China
Synopsis
Keywords: Muscle, MR Value, myasthenia gravis, TOF MRA, extraocular muscle
The study investigated the feasibility of TOF MAR sequence in evaluating extraocular muscle morphological changes in patients with myasthenia gravis. The results show that volume measurement of EOM based on TOF MRA imaging can effectively quantify atrophy of EOM in MG patients, which is significantly related to the poor response to medication and the long duration of the disease, meaning that it can be used as a non-invasive auxiliary diagnostic tool for prognosis evaluation of MG patients.Introduction/Purpose
Diplopia and limited eye movement are prominent features of myasthenia gravis (MG), seen in most patients and often the onset symptom. The evaluation of extraocular muscle (EOM) in MG patients is helpful for the diagnosis of ocular MG. On the other hand, a reliable evaluation method for EOM can be used to understand the pathophysiological process of MG patients and judge their prognosis. Various morphological and functional MR imaging have been used to evaluate EOM in MG patients, including extraocular muscle volume measurements1, fat substitution, and T2 relaxation time changes22,3. Among these methods, volume measurement of EOM is the most commonly used quantitative MR assessment to understand the volume changes of muscle tissue. 3D Time-of-flight (TOF) magnetic resonance angiography (MRA) with a strong contrast between blood vessels and background is a conventional tool for vascular imaging. As a sequence based on gradient echo, a repetitive RF pulse is used to saturate the spin magnetization of the static structure in the imaging field. The addition of fat inhibition counteracts the bright signal of fat internal rapid rotation recovery 44. We found that there was a clear boundary between EOM and intraorbital fat in 3D TOF images. Therefore, this study plans to use 3D TOF MRA sequence to measure extraocular muscle volume of ocular MG patients and compare the obtained data with that of normal subjects.Methods
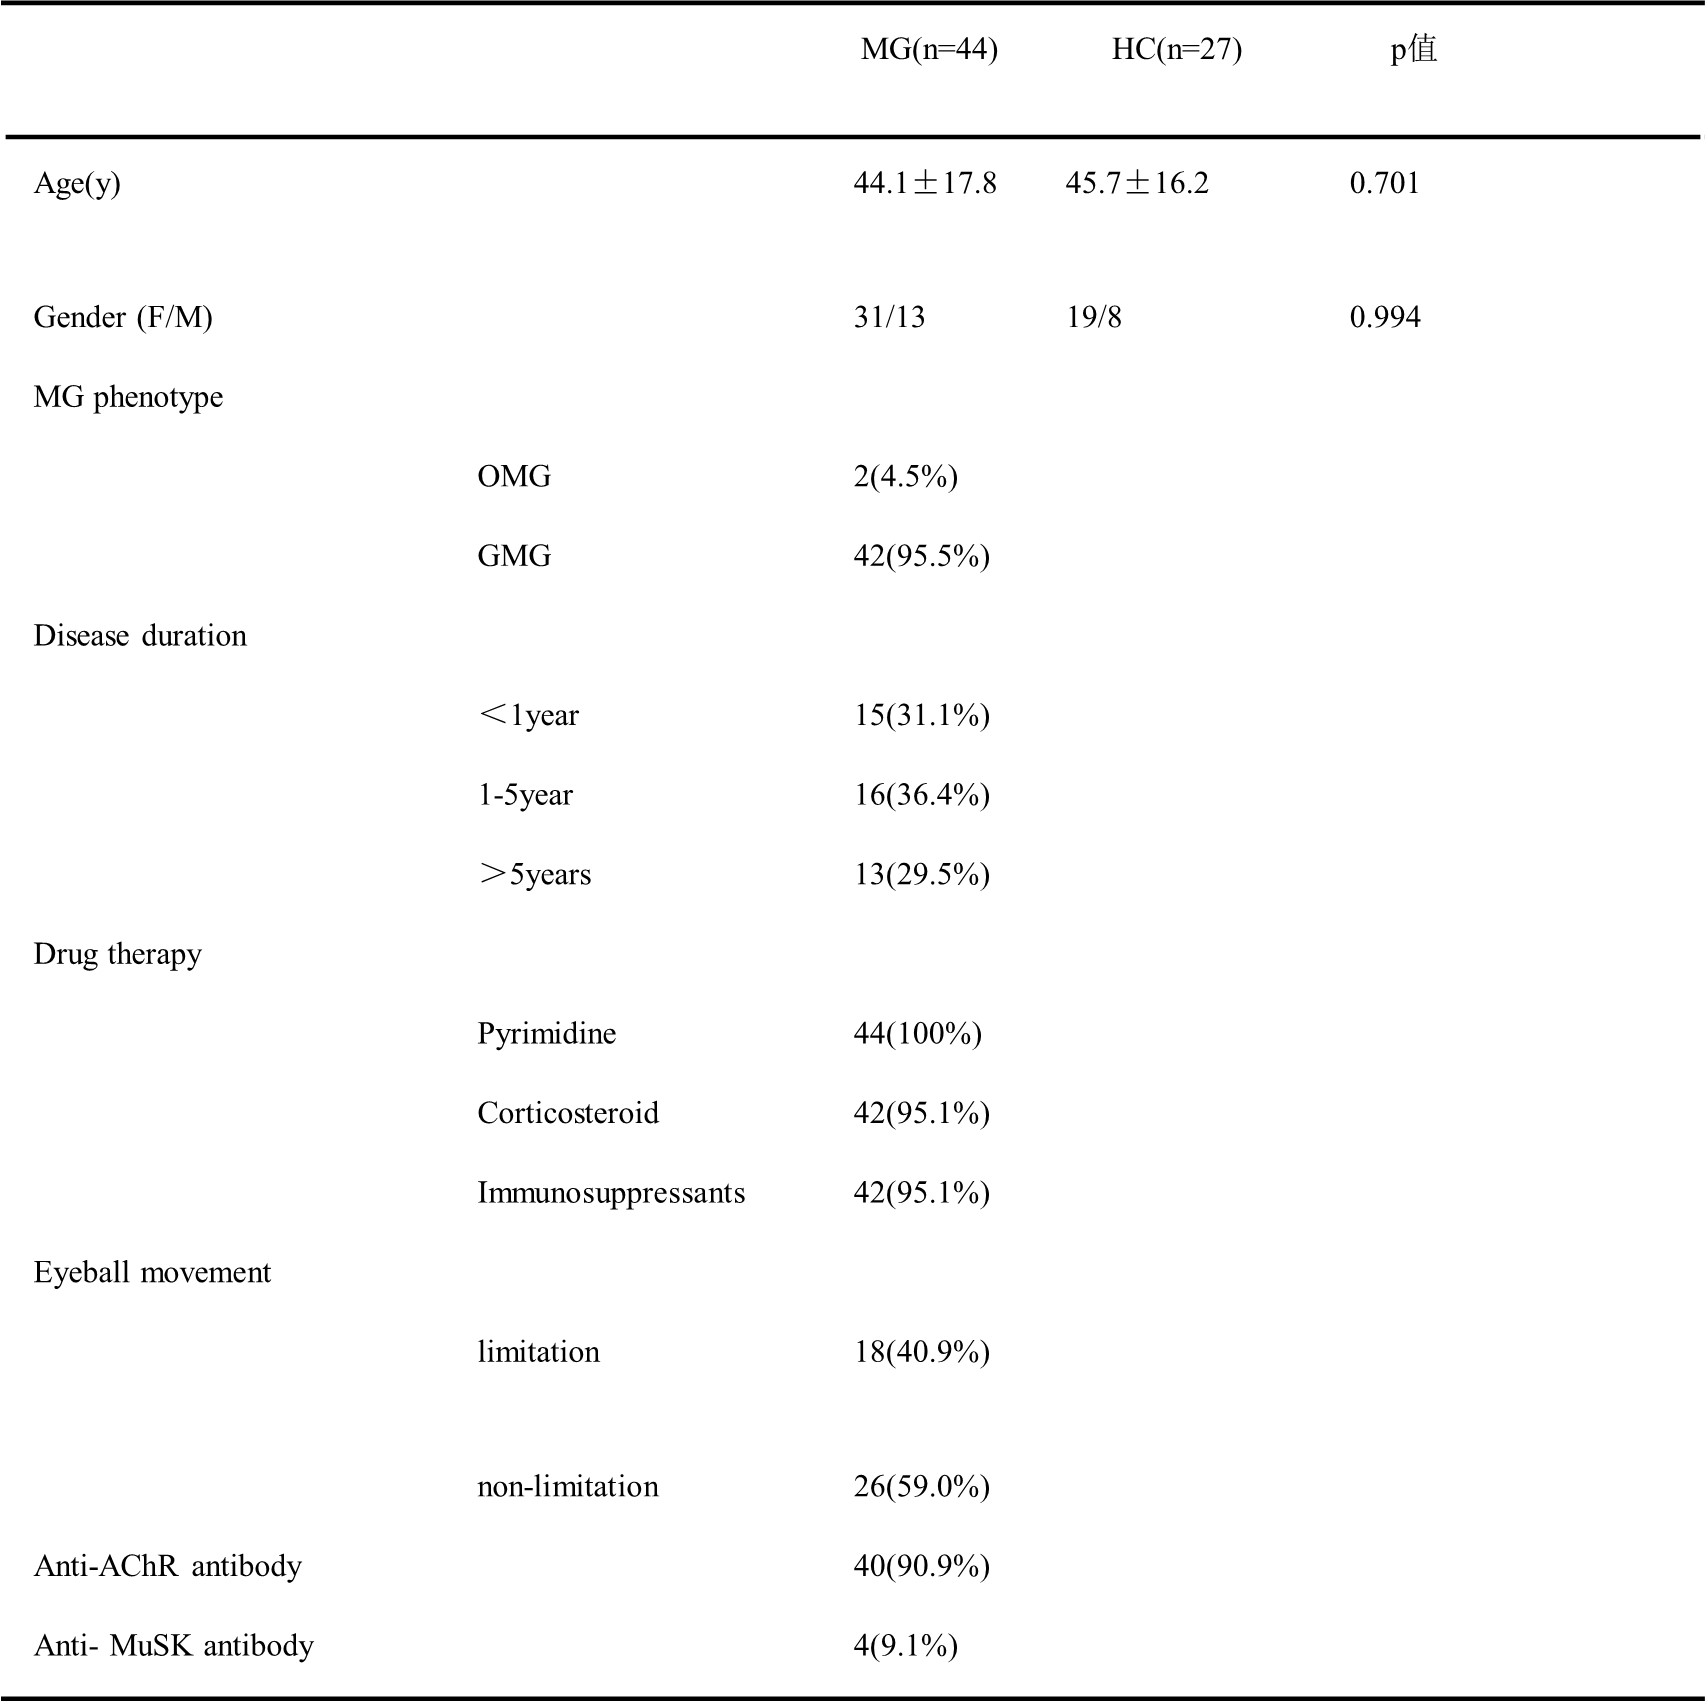
Forty-four patients with MG (44.1±17.8 years old, F/M=31/13) and 27 age-matched HCs ( 45.7±16.2 years old, F/M=19/8) underwent head TOF MRA scans on a 3T MR scanner ( (Magneton PRISMA; Siemens Healthcare, Erlangen, Germany). At the same time, the demographic and clinical data of patients with myasthenia gravis and ordinary people were collected for further analysis. TOF MRA images were acquired using a conventional gradient echo (GRE) based sequence with the following scanning parameters: repetition time =20ms, echo time =3.69ms, the field of view=200× 170 mm2, matrix= 256× 256, band-width=160 Hz/Px, 44 slices, slice thickness =0.6 mm, voxel size = 0.3× 0.3 × 0.6 mm3, flip angle = 18°, and acquisition time =3:55 min. ITK-SNAP software was used for labeling and volume calculations of the extraocular muscles. As much previous research focused on measuring the volume of the extraocular muscle (EOM) suggested, the current research preferred to collect data from the four rectus muscles of the EOM of myasthenia gravis (MG). Two experienced physicians used TOF MRA sequences in patients with MG and HCs to observe and measure the four rectus muscles on both sides (Figure 1 b, d). Since the EOM and intra-orbital fat formed distinct boundaries in the TOF MRA sequence (Figure 1 ), it was very convenient to outline the rectus muscles at each slide to calculate their volume (Figure 1 d). The student test was used to evaluate the differences of volume between patients and HCs, linear regression was used to assess the correlation between the two groups. A p-value < 0.05 indicates a significant difference.Results
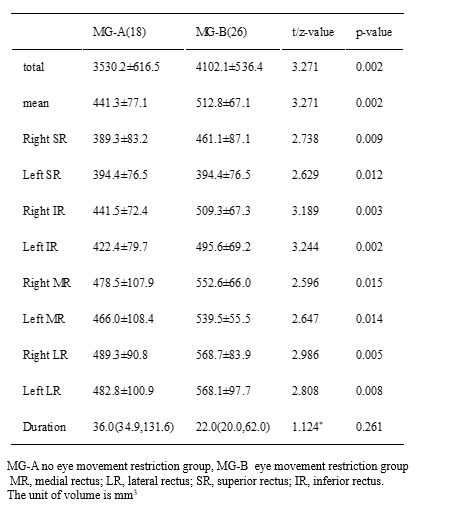
The total, mean and all individual EOM muscle volumes in the MG group were significantly smaller than that of HCs (p<0.05), except for the medial rectus muscle of the right eye (551.9 Vs 522.3, p=0.209) (Table 2). In this study, eighteen MG patients beard apparent eye movement restriction (EOM palsy) during MR examination. Patients with EOM palsy had smaller extraocular muscles in total volume than that in the other 26 MG patients (3530.2±616.5 Vs 4102.1±536.4, p=0.002), but there was no difference of disease course between the two groups (P=0.261) (Table 3). The EOM volume of MG patients with EOM palsy was negatively correlated with their disease duration (r=0.524, p=0.026)(Figure 2).Discussion
Previous studies have used T1-weighted MRI and fat-suppressed contrast-enhanced T1-weighted MRI to measure the volume of extraocular muscles in patients with myasthenia gravis5.But the boundary between the EOM and the surrounding adipose tissue is not clear in the conventional T1W images, leading it difficult to calculate the exact EOM volume. The EOM and intra-orbital fat form distinct boundaries in the 3D TOF sequence, which makes it much easier to outline the EOM for the calculation, and we also found that the EOM volume in MG patients was reduced, meaning that the extraocular muscle is atrophied. And further analysis of MG patients grouping by clinical manifestation (EOM palsy) revealed that the EOM volume of MG patients is closely related to their treatment response to drugs and the course of the disease. The poor response to medication and the long duration of the disease will lead to significant atrophy of the EOM in MG patients, which may result from limited eye movement.Conclusions
In conclusion, the TOF MRA sequence has the advantage of displaying and calculating the volume of extraocular muscle compared with the traditional T1 structural images, it is worthy of application in EOM imaging monitoring of patients with myasthenia gravis. MG extraocular muscle atrophy is more common in patients with limited eye movement, and the longer the course of the disease, the more pronounced atrophy.Acknowledgements
We thank all patients and healthy controls for their willingness to participate in the present study.References
1. Rana K, Juniat V, Rayan A, Patel S, Selva D. Normative measurements of orbital structures by magnetic resonance imaging. Int Ophthalmol. 2022 Dec;42(12):3869-3875. doi: 10.1007/s10792-022-02407-1. Epub 2022 Jul 14. 2. Luo B, Wang W, Li X, Zhang H, Zhang Y, Hu W. Correlation Analysis between Intraocular Pressure and Extraocular Muscles Based on Orbital Magnetic Resonance T2 Mapping in Thyroid-Associated Ophthalmopathy Patients. J Clin Med. 2022 Jul 8;11(14):3981. 3. Keene KR, van Vught L, van de Velde NM, Ciggaar IA, Notting IC, Genders SW, Verschuuren JJGM, Tannemaat MR, Kan HE, Beenakker JM. The feasibility of quantitative MRI of extra-ocular muscles in myasthenia gravis and Graves' orbitopathy. NMR Biomed. 2021 Jan;34(1):e4407. doi: 10.1002/nbm.4407. Epub 2020 Sep 7. 4. Kuo AH, Nagpal P, Ghoshhajra BB, Hedgire SS. Vascular magnetic resonance angiography techniques. Cardiovasc Diagn Ther. 2019 Aug;9(Suppl 1):S28-S36. 5. Rana K, Juniat V, Rayan A, Patel S, Selva D. Normative measurements of orbital structures by magnetic resonance imaging. Int Ophthalmol. 2022 Dec;42(12):3869-3875. doi: 10.1007/s10792-022-02407-1. Epub 2022 Jul 14.Figures
Table
1 Demographic and clinical characteristics of MG patients (MG) and health
controls (HCs)
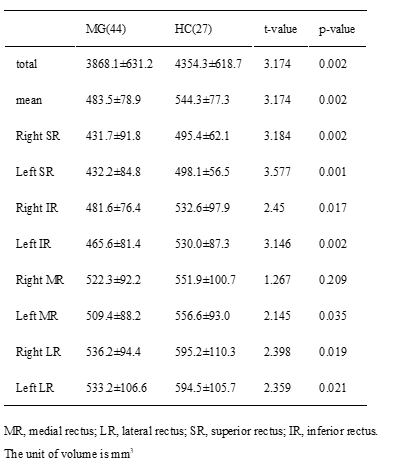
Table
2 Summary of muscle volume results of single extra-ocular muscles in both eyes
of MG patients (MG) and health controls (HCs)
Table
3 Summary of muscle volume results of
four extra-ocular muscles in both eyes of different MG patients (MG) groups
distinguished by the clinical manifestation of eyes.
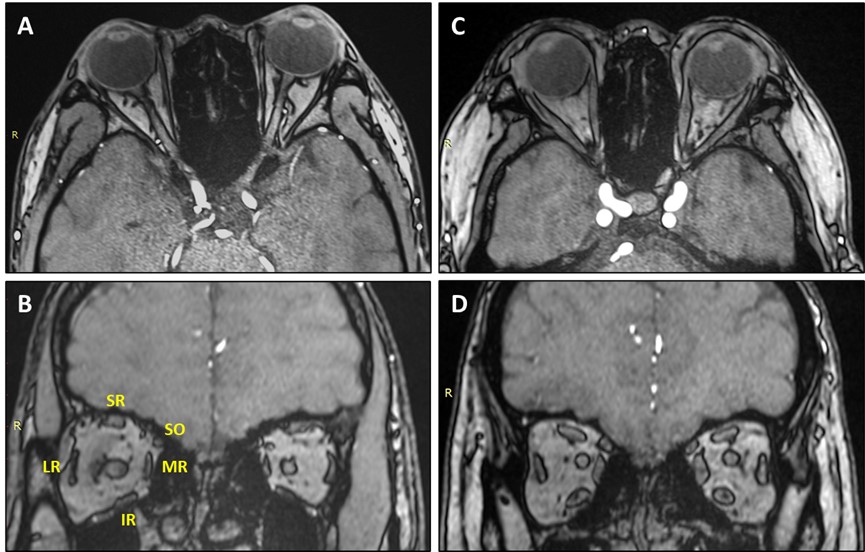
Figure
1 (A-B) a 27-year-old MG patient, the ptosis and ophthalmoparesis onset at
5-year-old; (C-D) an age-matched normal control. The transverse (A) and coronal
sections (B) of TOF MRA images in MG patient show the extraocular muscles
atrophy compared with fullness extraocular muscles of images (C)(D) in normal
control MR, medial rectus, LR lateral rectus, SR, superior rectus, IR, inferior
rectus, and SO, superior oblique.
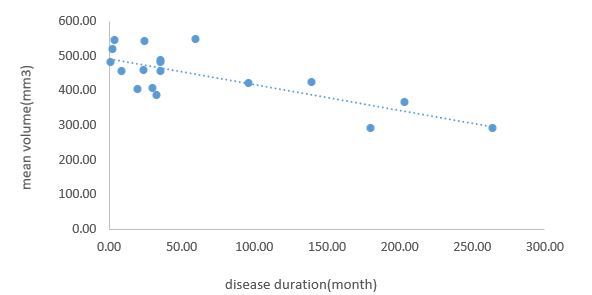
Fig.
2. Scatter plot showing the correlation between the disease duration and four
extraocular muscle mean volume in EOM palsy MG patient.
DOI: https://doi.org/10.58530/2023/4070