4068
Monitoring changes of the muscles around the knee joint in amateur marathon athletes using synthetic MRI: a preliminary study1Department of Radiology,Fifth Affiliated Hospital, Sun Yat-Sen University, Zhuhai, China, 2MR Research, GE Healthcare, Beijing, China, 3University of California, San Diego, Department of Radiology, San Diego, CA, United States
Synopsis
Keywords: Muscle, Muscle
To investigate the value of synthetic MRI sequences for quantitative detection of the muscles around the knee joints before and after a marathon. Marathon runners were examined with Synthetic MRI sequences of both knees. Quantitative profiles of T1, T2, and PD were obtained after scanning. The differences in T1, T2, and PD values of each muscle were analyzed. Most muscle subregions had elevated T1, T2, and PD values 48 hours after the marathon compared to pre-race, and decreased after 1 month of post-race rest. The synthetic MRI sequences can be useful for detecting dynamic changes in the knee muscles.INTRODUCTION
Muscle injury is one of the most common sports injuries in long-distance runners1. Magnetic resonanceimaging (MRI) is currently the most commonly used tool to detect muscle injuries in clinical practice. Conventional MR imaging techniques can detect lesions such as muscle fiber tears and hemorrhages, but are less sensitive to minor muscle damage or degeneration caused by fatigue2,3. This study aims to investigate the value of synthetic MRI sequences for quantitative detection of the muscles around the knee joints before and after amateur marathon runners participated in a full marathon.METHODS
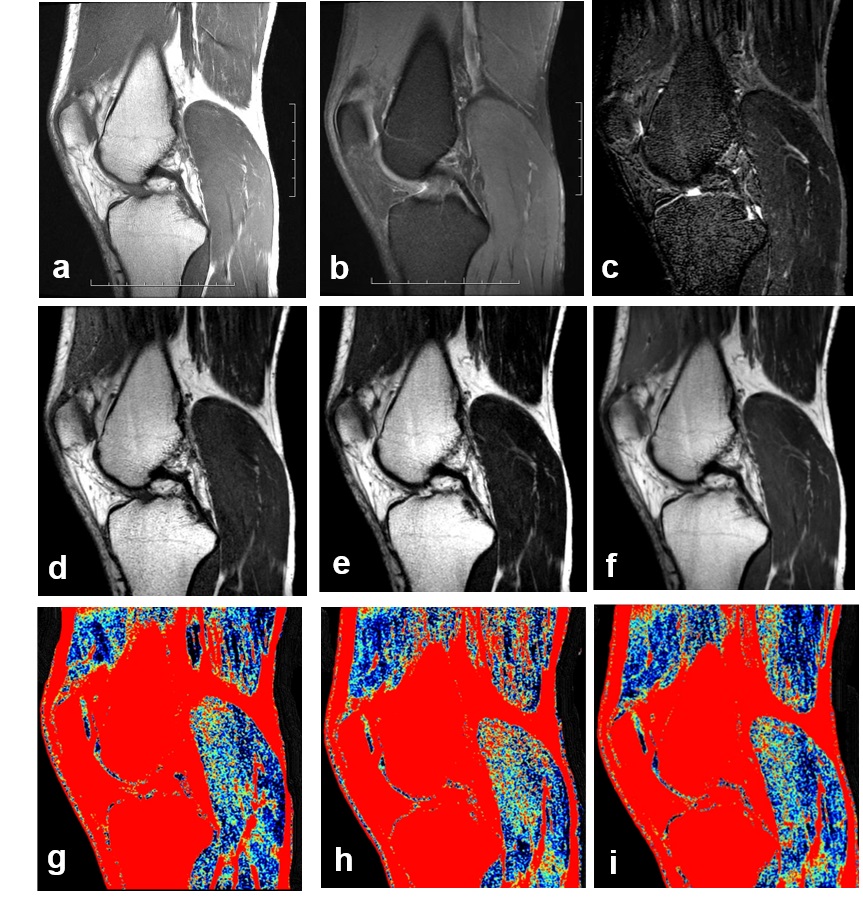
Twenty-four amateur marathon runners (48 knees), 21 males and 3 females, aged 24 to 50 (40±6) years, were prospectively recruited. All subjects were examined with GE SIGNA Pioneer 3.0 T MRI. Synthetic MRI sequences of both knees were performed 1 week before the marathon, 48 hours after the marathon, and 1 month after the marathon. Conventional contrast-weighted images as well as 3 quantitative profiles of T1, T2, and PD were obtained after scanning. ITK-SNAP software was applied in the post-processing platform to measure the T1, T2, and PD values of the semimembranosus, biceps femoris, lateral femoris, medial femoris, medial head of the gastrocnemius, and lateral head of gastrocnemius, popliteus, and tibialis anterior muscles in sagittal images of the knee joint. The differences in T1, T2, and PD values of each muscle were analyzed before and 48 hours after the race and 1 month after the race.RESULTS
All subjects showed no significant abnormalities in muscle morphology or signal around the knee during the examination. The values of T1, T2 and PD of the muscles around the knee joint measured by two radiologists were good consistent, with ICC values of 0.801, 0.909 and 0.921, respectively. Most muscle subregions had elevated T1, T2, and PD values 48 hours after the marathon compared to pre-race, and decreased after 1 month of post-race rest. There were statistically significant changes in T2 values for semimembranosus, biceps femoris, lateral femoris, medial femoris, medial head of the gastrocnemius, and lateral head of gastrocnemius, and statistically significant changes in PD values for medial femoris.DISCUSSION
Compared to conventional knee MRI sequences, which require at least 12 minutes per scan, in 8 minutes and 5 seconds, the integrated MRI sequence in this study not only provides a conventional diagnostic imaging sequence, but also gives us more quantitative information. In this study, we found that T1, T2, and PD values of most muscle tissues around the knee joint were elevated to varying degrees 48 h after the marathon, and their quantitative values largely returned to pre-running levels 1 month after the race. The increase in muscle T2 values after exercise may be related to a number of factors, and in general, changes in the muscle occur at the microscopic level, including changes in intra- and extracellular water content, infiltration of inflammatory cells and changes in the extracellular space4. The posterior femoral muscles (biceps femoris, semimembranosus, semitendinosus) of track and field athletes are prone to injury during exercise, of which the biceps femoris is the most vulnerable part, with an injury rate of about 10%-15%, which may be related to the unbalanced development of the muscles of the anterior and posterior thigh muscle groups5.CONCLUSION
The quantitative parameter values of synthetic MRI sequences can be useful for detecting dynamic changes in the knee muscles before and after marathon exercise.Acknowledgements
This article is supported by the National Natural Science Found (No. 82101995); the National Natural Science Found(82172053).References
[1] van Gent, R.N., D. Siem, M. van Middelkoop, et al. Incidence and determinants of lower extremity running injuries in long distance runners: a systematic review[J]. Br J Sports Med, 2007. 41(8):469-80.
[2] Heiderscheit, B.C., M.A. Sherry, A. Silder, et al. Hamstring strain injuries: recommendations for diagnosis, rehabilitation, and injury prevention[J]. J Orthop Sports Phys Ther, 2010. 40(2):67-81.
[3] Mueller-Wohlfahrt, H.W., L. Haensel, K. Mithoefer, et al. Terminology and classification of muscle injuries in sport: the Munich consensus statement[J]. Br J Sports Med, 2013. 47(6):342-50.
[4] Ababneh, Z.Q., R. Ababneh, S.E. Maier, et al. On the correlation between T(2) and tissue diffusion coefficients in exercised muscle: quantitative measurements at 3T within the tibialis anterior[J]. Magma, 2008. 21(4):273-8.
[5] Malliaropoulos, N., E. Papacostas, O. Kiritsi, et al. Posterior Thigh Muscle Injuries in Elite Track and Field Athletes[J]. The American Journal of Sports Medicine, 2010. 38(9):1813-1819.
Figures