4065
Large coverage, high temporal and spatial resolution lower extremity blood oxygen level-dependent imaging
Jianxun Qu1, Xiaoyuan Fan2, Tianye Lin3, Xiaoxi Yu4, and Feng Feng2
1SIEMENS Healthineers, Beijing, China, 2Radiology Department, Peking Union Medical College Hospital, Beijing, China, 3Radiology Department, Peking University Cancer Hospital & Institute, Beijing, China, 4Vascular Surgery Department, Peking Union Medical College Hospital, Beijing, China
1SIEMENS Healthineers, Beijing, China, 2Radiology Department, Peking Union Medical College Hospital, Beijing, China, 3Radiology Department, Peking University Cancer Hospital & Institute, Beijing, China, 4Vascular Surgery Department, Peking Union Medical College Hospital, Beijing, China
Synopsis
Keywords: Muscle, Perfusion
Multi echo gradient echo (GRE) sequence is usually used in lower extremity BOLD experiments. This study replaced the GRE acquisition by SMS EPI and achieved broader coverage and higher temporal and spatial resolution. The minimum ischemia value (MIV) during the ischemia session and the R2* change rate (Grad) during the reperfusion session were calculated. Both MIV and Grad present muscle group-wise distribution. This study demonstrated the feasibility of the SMS GRE-EPI sampling strategy in the skeletal muscle BOLD experiment.Introduction
The reactive hyperemia experiment has been used in clinical research and basic physiological studies to assess skeletal muscle perfusion. Conventionally, the technique uses a multi-phase multi-echo gradient echo (GRE) sequence to sample the T2* change along the ischemia-reperfusion process, termed as lower extremity blood oxygen level-dependent (BOLD) imaging [1-3]. The imaging coverage is usually restricted to a single slice to reduce the time for a single measurement. Even so, the multi-echo GRE acquisition scheme still limits the temporal resolution. GRE Echo planar imaging (EPI) has long been used to record the T2* induced signal change in functional imaging. The advances in the EPI acceleration technique permit large coverage and high temporal and spatial resolution imaging, especially with the aid of the simultaneous multi-slice (SMS) method. This study explored the feasibility of applying the SMS GRE-EPI in the lower extremity BOLD experiment. A semi-quantitative analysis was performed to evaluate the perfusion status of the lower extremity muscle.Methods
Two subjects were recruited, with informed consent acquired before the study. The experiment was performed on a 3T whole-body scanner (MAGNETOM Vida, Siemens Healthcare, Erlangen, Germany) equipped with an 18-channel Ultraflex large coil. The reactive hyperemia experiment consisted of a 50-second resting state section, a 250-second cuff-induced ischemia section, and a 100-second recovery section after the pressure was released. The subject position and experiment setting were the same as in our previous study [4]. The experiment used GRE-EPI to sample the dynamic process with the following parameters, repetition time (TR) 1000 ms, echo time (TE) 15 ms, the field of view (FOV) 154 x 154 mm2, resolution 96 x 96, slice thickness 6 mm, number of slice 24, voxel size 1.6 x 1.6 x 6.0 mm3, phase Partial Fourier 6/8, acceleration factor in the phase encoding direction 2, and in the slice direction 2, the total imaging acceleration factor 4. The flip angle was set to 45 degrees to reduce the influence of T1 recovery. In post-processing, ANTs (Advanced Normalization Tools, version 2.1) was used for the non-rigid registration, consisting of a cascade of rigid, affine, and non-rigid transformations. B-Spline was used for the interpolation in the registration. The coregistered data was smoothed both spatially and temporally. The experiment and post-processing pipeline is shown in Figure 1. Unlike the multi-echo GRE-based approach where T2* is used, R2* is used as the metric in the EPI-based method. The minimum ischemia value (MIV) was calculated as the R2* change from the beginning to the end of the ischemia session. The gradient during reactive hyperemia (Grad) was calculated as the R2* change rate over the continuous 10 seconds of the highest slope during the reactive hyperemia state. A pixel-wised MIV and Grad map was generated.Results
The non-rigid registration process can effectively reduce the influence of deformation during the BOLD acquisition, as exemplified by the comparison between the measurement at the beginning and the end of the ischemia session (Fig.1B). The MIV map of the entire volume is shown in Figure. 2B. Taking the anatomical images (Fig.2A) as a reference, the MIV map (Fig. 2B) presents a conspicuous muscle group-wise distribution, so is the Grad map (Fig.2C). The MIV and Grad map in sagittal, coronal, and axial plane, overlaid on anatomical images, are shown in Figure 3.Discussion and Conclusion
This study applied the SMS accelerated GRE-EPI acquisition to the lower extremity BOLD experiment. Compared to the conventional multi-echo GRE acquisition, the SMS GRE-EPI approach achieved broader coverage, higher temporal resolution, and comparable spatial resolution. Unlike the conventional lower extremity BOLD experiment, where a quantitative T2* relaxation map was generated for each measurement, the GRE-EPI based method offers the change of R2*. As demonstrated in the result, the R2* changes could reflect the perfusion status of each muscle group conspicuously. To reduce the influence of T1 relaxation, a reduced flip angle of 45 degrees was used. As a limitation, only healthy subjects were included temporarily. Later, subjects with altered perfusion status, for instance, patients with peripheral artery disease (PAD), will also be recruited to study the feasibility of the proposed technique.Acknowledgements
No acknowledgement found.References
[1] Shiteng Suo, Lan Zhang, et al., Evaluation of skeletal muscle microvascular perfusion of lower extremities by cardiovascular magnetic resonance arterial spin labeling, blood oxygenation level-dependent, and intravoxel incoherent motion techniques, Journal of Cardiovascular Magnetic Resonance, 2018 [2] Jacobi B, Bongartz G, Partovi S, et al. Skeletal muscle BOLD MRI: from underlying physiological concepts to its usefulness in clinical conditions. J Magn Reson Imaging, 2012;35(6):1253-65. [3] Bajwa A, Wesolowski R, Patel A, et al. Blood Oxygenation Level-Dependent CMR-Derived Measures in Critical Limb Ischemia and Changes With Revascularization. J Am Coll Cardiol, 2016;67(4):420-431. [4] Xiaoxi Yu, Zhaoxi Liu, Jianxun Qu, et al. Blood Oxygen Level-Dependent Imaging of Lower Limbs: Perfusion and Clinical Assessment of Peripheral Artery Disease, 2022, ISMRMFigures
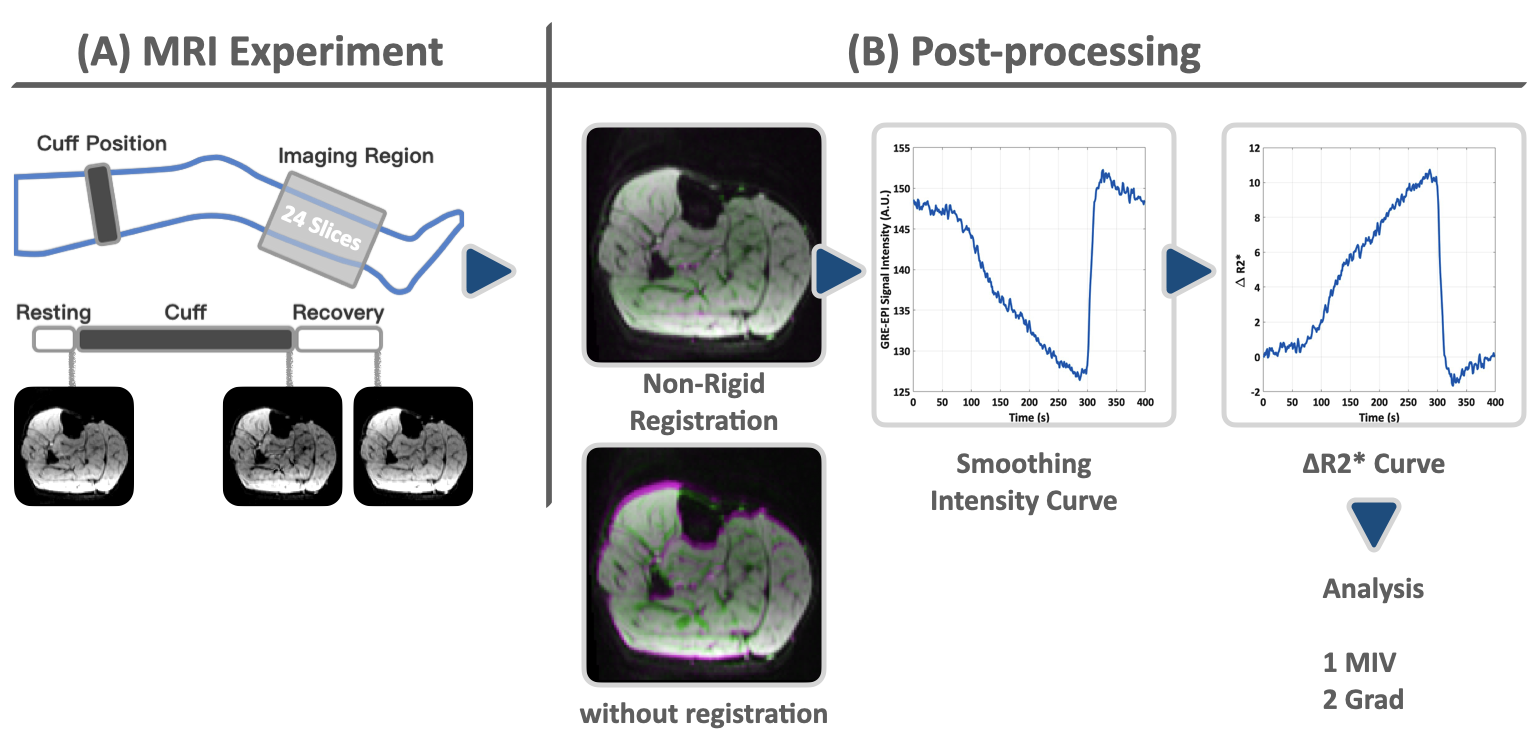
Figure 1, The lower extremity reactive hyperemia experiment setting (A) and the post-processing pipeline (B). During the ischemia session, the signal decreases, as shown in the images in (A). The post-processing consists of non-rigid registration, time series smoothing, and pixel-wise analysis.
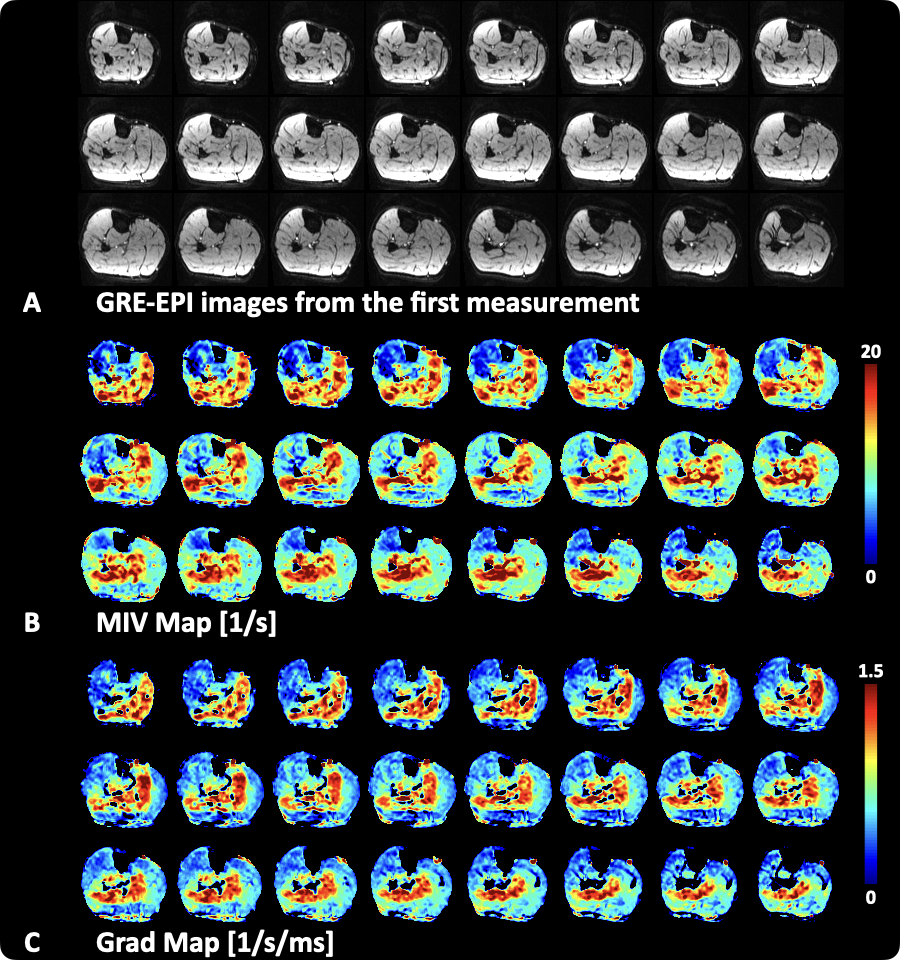
Figure 2, (A) shows the GRE-EPI images from the first measurement, which served as the anatomical images, and the MIV map (B) and Grad map (C). Both the MIV and Grad maps showed a conspicuous muscle group-wise distribution.
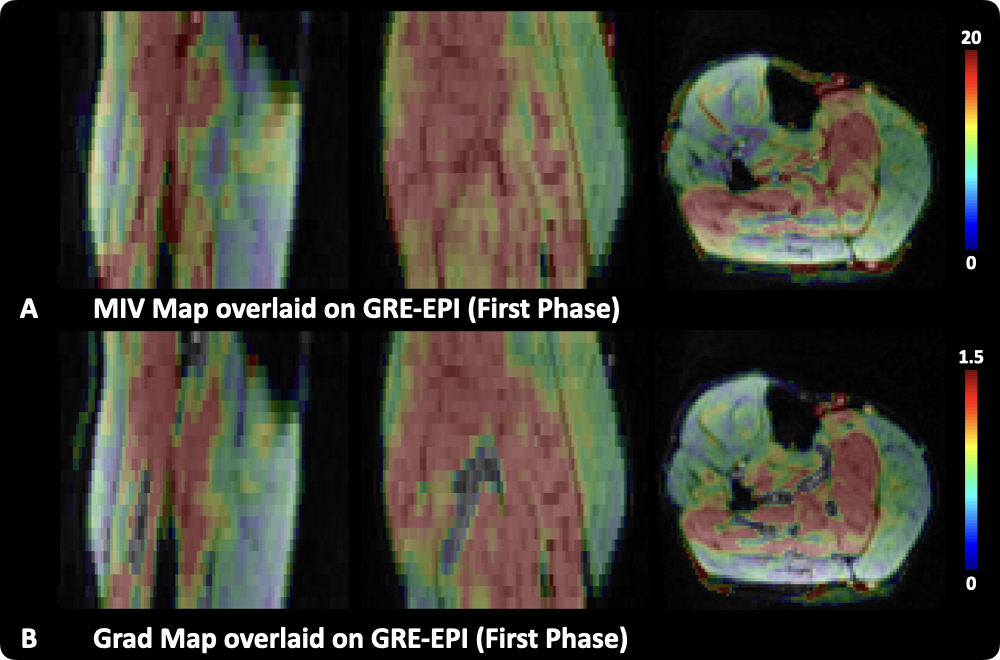
Figure 3, The MIV and Grad map overlaid on anatomical images are presented in sagittal, coronal, and axial planes.
DOI: https://doi.org/10.58530/2023/4065