4063
The effects of exercise on ankle mobility and lower leg hyaluronan distribution in type 2 diabetes1Radiology, NYU Grossman School of Medicine, New York, NY, United States, 2Department of Physical Therapy, New York University, New York, NY, United States, 3Johns Hopkins University School of Medicine, Baltimore, MD, United States
Synopsis
Keywords: Muscle, Diabetes, exercise intervention
Type 2 Diabetes Mellitus (T2DM) is a major cause of a number of systemic pathological processes, including muscle stiffness. In this study, we examine the effects of exercise on peak ankle dorsiflexion, and ankle stiffness and investigate hyaluronan distribution with 3D-T1ρ MRI in 10 individuals with T2DM. Our findings suggest that participation in a 10-week moderate intensity exercise intervention may alter hyaluronan distribution in the compartments of the lower leg calf muscle, and is accompanied by increased dorsiflexion, reduced stiffness in individuals with diabetes, and a reduction in MRI based T1ρ measures
INTRODUCTION
Type 2 Diabetes Mellitus (T2DM) affects nearly 37 million people in the US, with an additional estimated 98 million people with pre-diabetes1. Due to insulin resistance, T2DM triggers a range of pathological processes in different organs, including skeletal muscle2. One of the downstream effects is increased muscle stiffness. Exercise is well established holistic technique to improve and alleviate T2DM and its effects3. In this study, we examine the effects of exercise on peak ankle dorsiflexion, and ankle stiffness and investigate hyaluronan (HA) distribution with 3D-T1ρ MRI in patients with T2DM.METHODS
An overview of the study is shown in Figure 1. The study group consisted of 10 patients (3 males, 7 females, age = 58 ± 8 years) with T2DM who completed a supervised 10-week moderate intensity exercise program with aerobic and resistance training components. The study was HIPAA compliant, with all procedures approved by the IRB. All patients provided written informed consent.In this pilot single-group mechanistic clinical trial, we evaluated the effects of a 10-week moderate intensity exercise program on hyaluronan distribution in the lower leg calf muscle. Prior work has established the safety and efficacy of this intervention4,5.
The imaging protocol was used to assess hyaluronan distribution using 3D-T1ρ imaging. The validity and reliability of all imaging procedures have been established in our previous work6,7 The MRI was conducted on a 3T clinical scanner (Prisma, Siemens Healthcare, Germany) using a 1Tx/15 Rx knee coil (QED, OH). Pre- and post-exercise intervention MRI of the same calf muscles were done. As shown in Figure 2(a), a 3D turbo-FLASH sequence with a customized T1ρ preparation module was used to enable varying spin locks durations (TSLs). A paired self-compensated spin-lock pulse was used to minimize B0 and B1 variations. The sequence parameters included FOV=130 mm, matrix size=256x64x64, TR=1500ms, resolution = 0.7mmx0.7mmx4 mm, spin-lock frequency = 500Hz, 4 optimized TSL durations were used = 0.5, 4.2, 9.8 and 21.8 ms. acquisition duration = 6m40s. The T1ρ weighted images were fit using a mono-exponential model to generate T1ρ maps. Regions of interest were manually drawn as shown in Figure 2(b).
Change in outcomes (Mean T1ρ values) were expressed as absolute and percent change from baseline, and statistical significance was evaluated using effect size (Cohen’s d) and paired t-tests with alpha = 0.05.
RESULTS
All ten individuals completed baseline and post-intervention testing (3 male / 7 female).Figure 3 shows the MRI results of two representative patients pre-treatment and post-treatment. Figure 4 shows the results from the cohort. Trends towards lower T1ρ values were noted in all muscle groups following exercise intervention. The table shows the decrease in MRI based T1ρ measures for each ROI, showing consistent improvement with exercise intervention.
DISCUSSION
The results observed in this study are in excellent agreement with previous studies using T1ρ to quantify hyaluronan6,8. Increased T1ρ values reflect greater deposits of hyaluronan in the extra-cellular matrix of the muscles. As shown in figure 5, increased hyaluronan form aggregates that clump together and cause muscle stiffness (Figure 5(b)). Moderate and regular exercise intervention is able to breakdown some of the hyaluronan aggregates (figure 5(c)).Musculoskeletal complications contribute substantially to the costs and disability associated with T2DM. Exercise interventions have the potential to reduce ankle stiffness and increase ankle range of motion in individuals with diabetes, however existing evidence is limited and conflicting. To address this critical gap, we assessed the mechanistic effects of exercise using a novel combination of well-established clinical outcomes combined with sensitive non-invasive quantitative MRI. Additional recruitment and enrollment is underway to extend sample size and strengthen our preliminary findings.
CONCLUSION
Our findings suggest that participation in a 10-week moderate intensity exercise intervention may alter hyaluronan distribution in the compartments of the lower leg calf muscle, and is accompanied by a reduction in MRI based T1ρ measuresAcknowledgements
Foundation for Physical Therapy Research Georgeny High Priority Award
This study was supported by NIH grants, R01-AR076328-01A1, R01-AR076985-01A1, and R01-AR078308-01A1 and was performed under the rubric of the Center of Advanced Imaging Innovation and Research (CAI2R), an NIBIB Biomedical Technology Resource Center (NIH P41-EB017183).
References
(National Diabetes Information Clearinghouse, Centers for Disease Control and Prevention. National Diabetes Statistics Report website).
2 Parasoglou, P., Rao, S. & Slade, J. M. Declining Skeletal Muscle Function in Diabetic Peripheral Neuropathy. Clin Ther 39, 1085-1103, doi:10.1016/j.clinthera.2017.05.001 (2017).
3 Stanford, K. I. & Goodyear, L. J. Exercise and type 2 diabetes: molecular mechanisms regulating glucose uptake in skeletal muscle. Adv Physiol Educ 38, 308-314, doi:10.1152/advan.00080.2014 (2014).
4 Menon, R. G., Raghavan, P. & Regatte, R. R. Quantifying muscle glycosaminoglycan levels in patients with post-stroke muscle stiffness using T1rho MRI. Sci Rep 9, 14513, doi:10.1038/s41598-019-50715-x (2019).
5 Menon, R. G., Raghavan, P. & Regatte, R. R. Pilot study quantifying muscle glycosaminoglycan using bi-exponential T1rho mapping in patients with muscle stiffness after stroke. Sci Rep 11, 13951, doi:10.1038/s41598-021-93304-7 (2021).
Figures
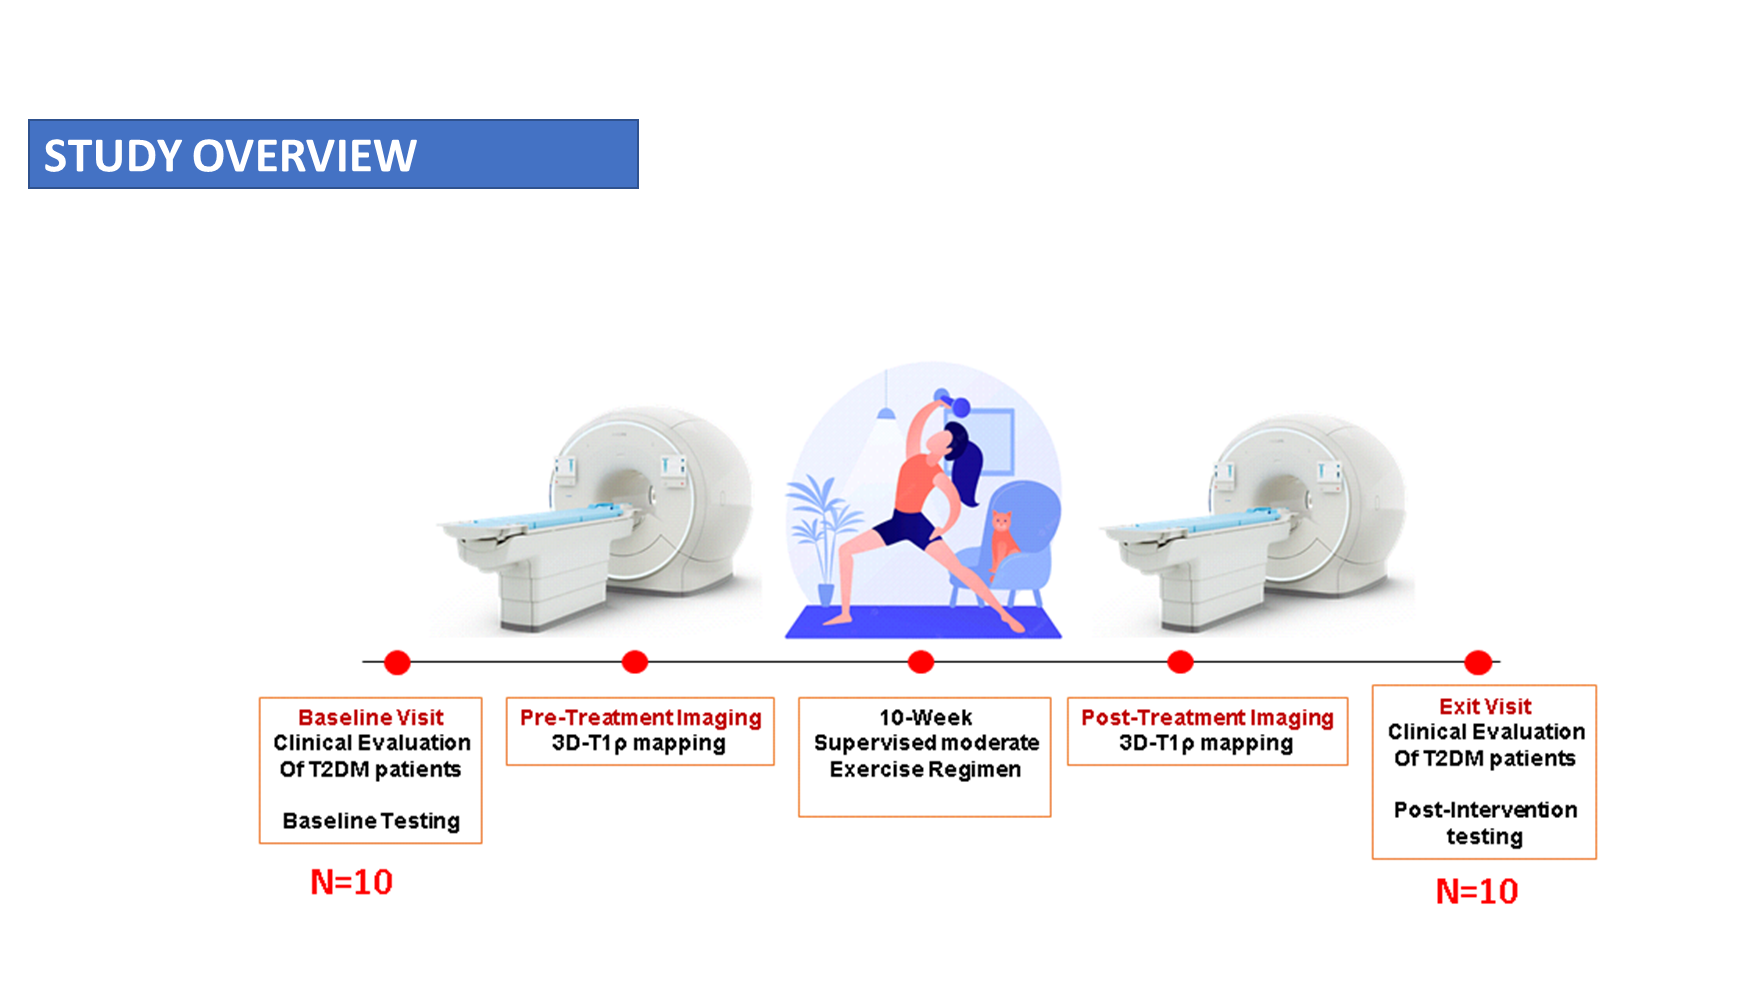
Figure 1: Study Overview. T2DM patients are recruited, they undergo clinical evaluation and pre-treatment testing, then are scheduled for pre-treatment MRI, followed by a 10-week exercise regimen. Post-treatment imaging is done after that followed by an exit visit and post-intervention testing
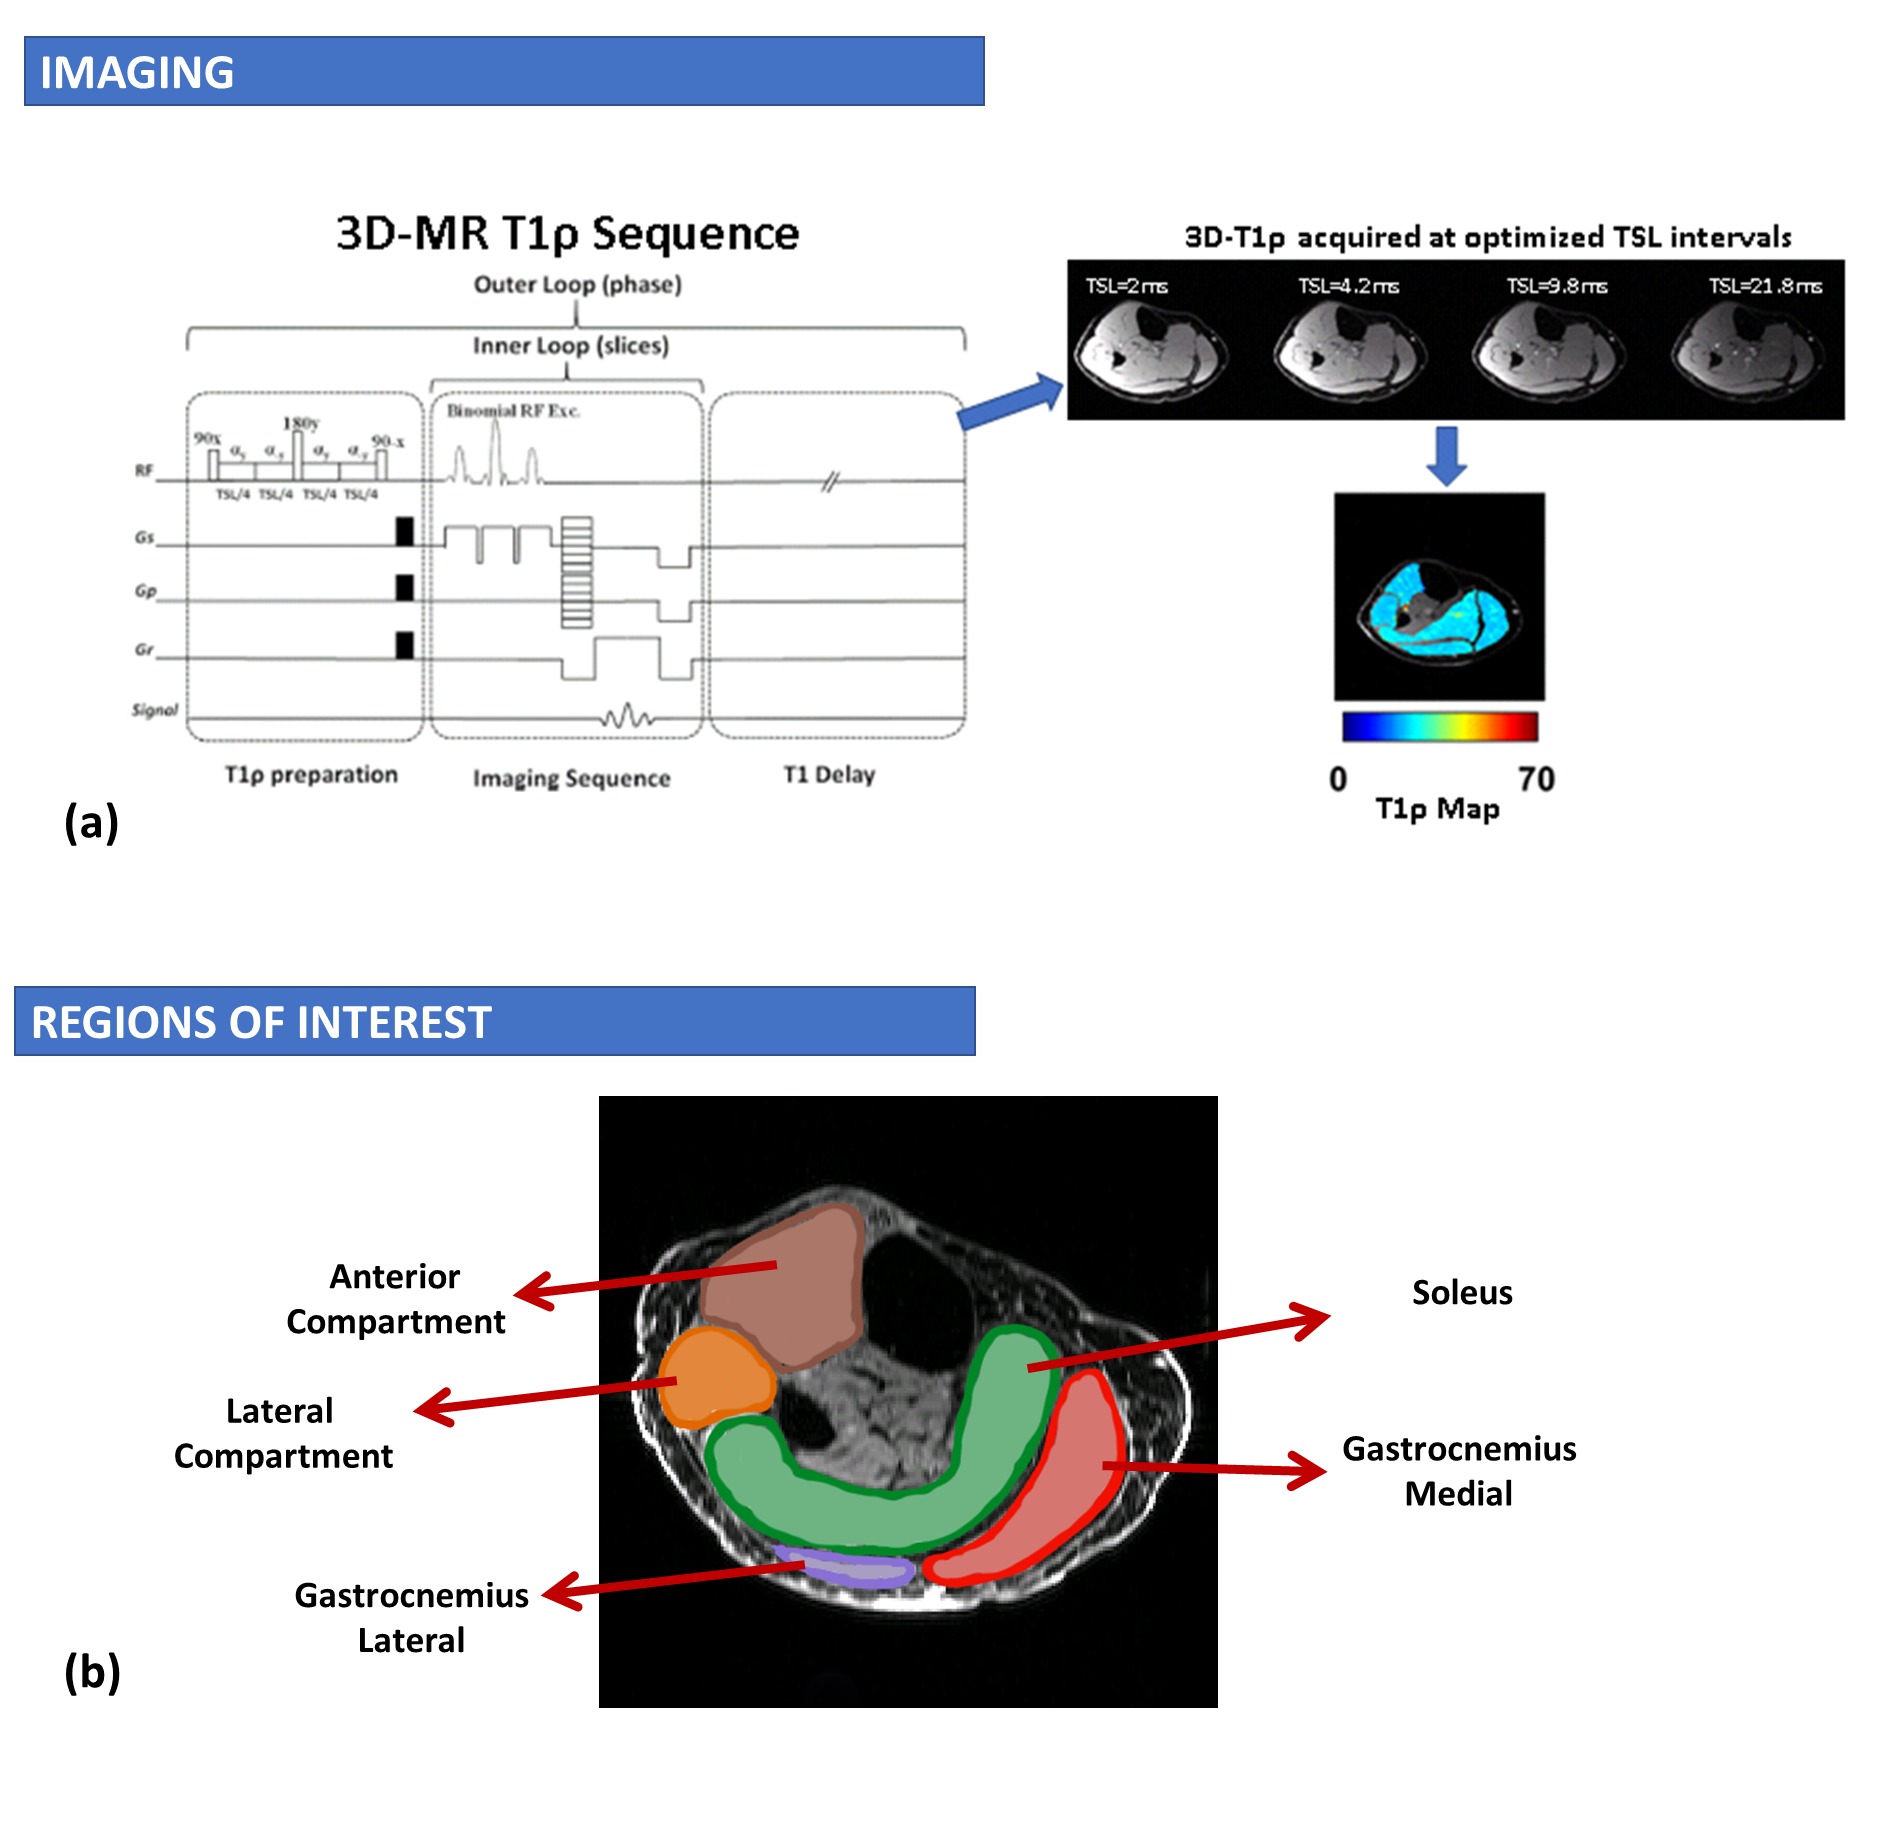
Figure 2: MRI Sequence. (a) shows the 3D-T1ρ imaging sequence used for T1ρ mapping of the calf muscle. (b) shows the Regions of interest that are manually segmented for each patient and matched with pre- and post-treatment imaging
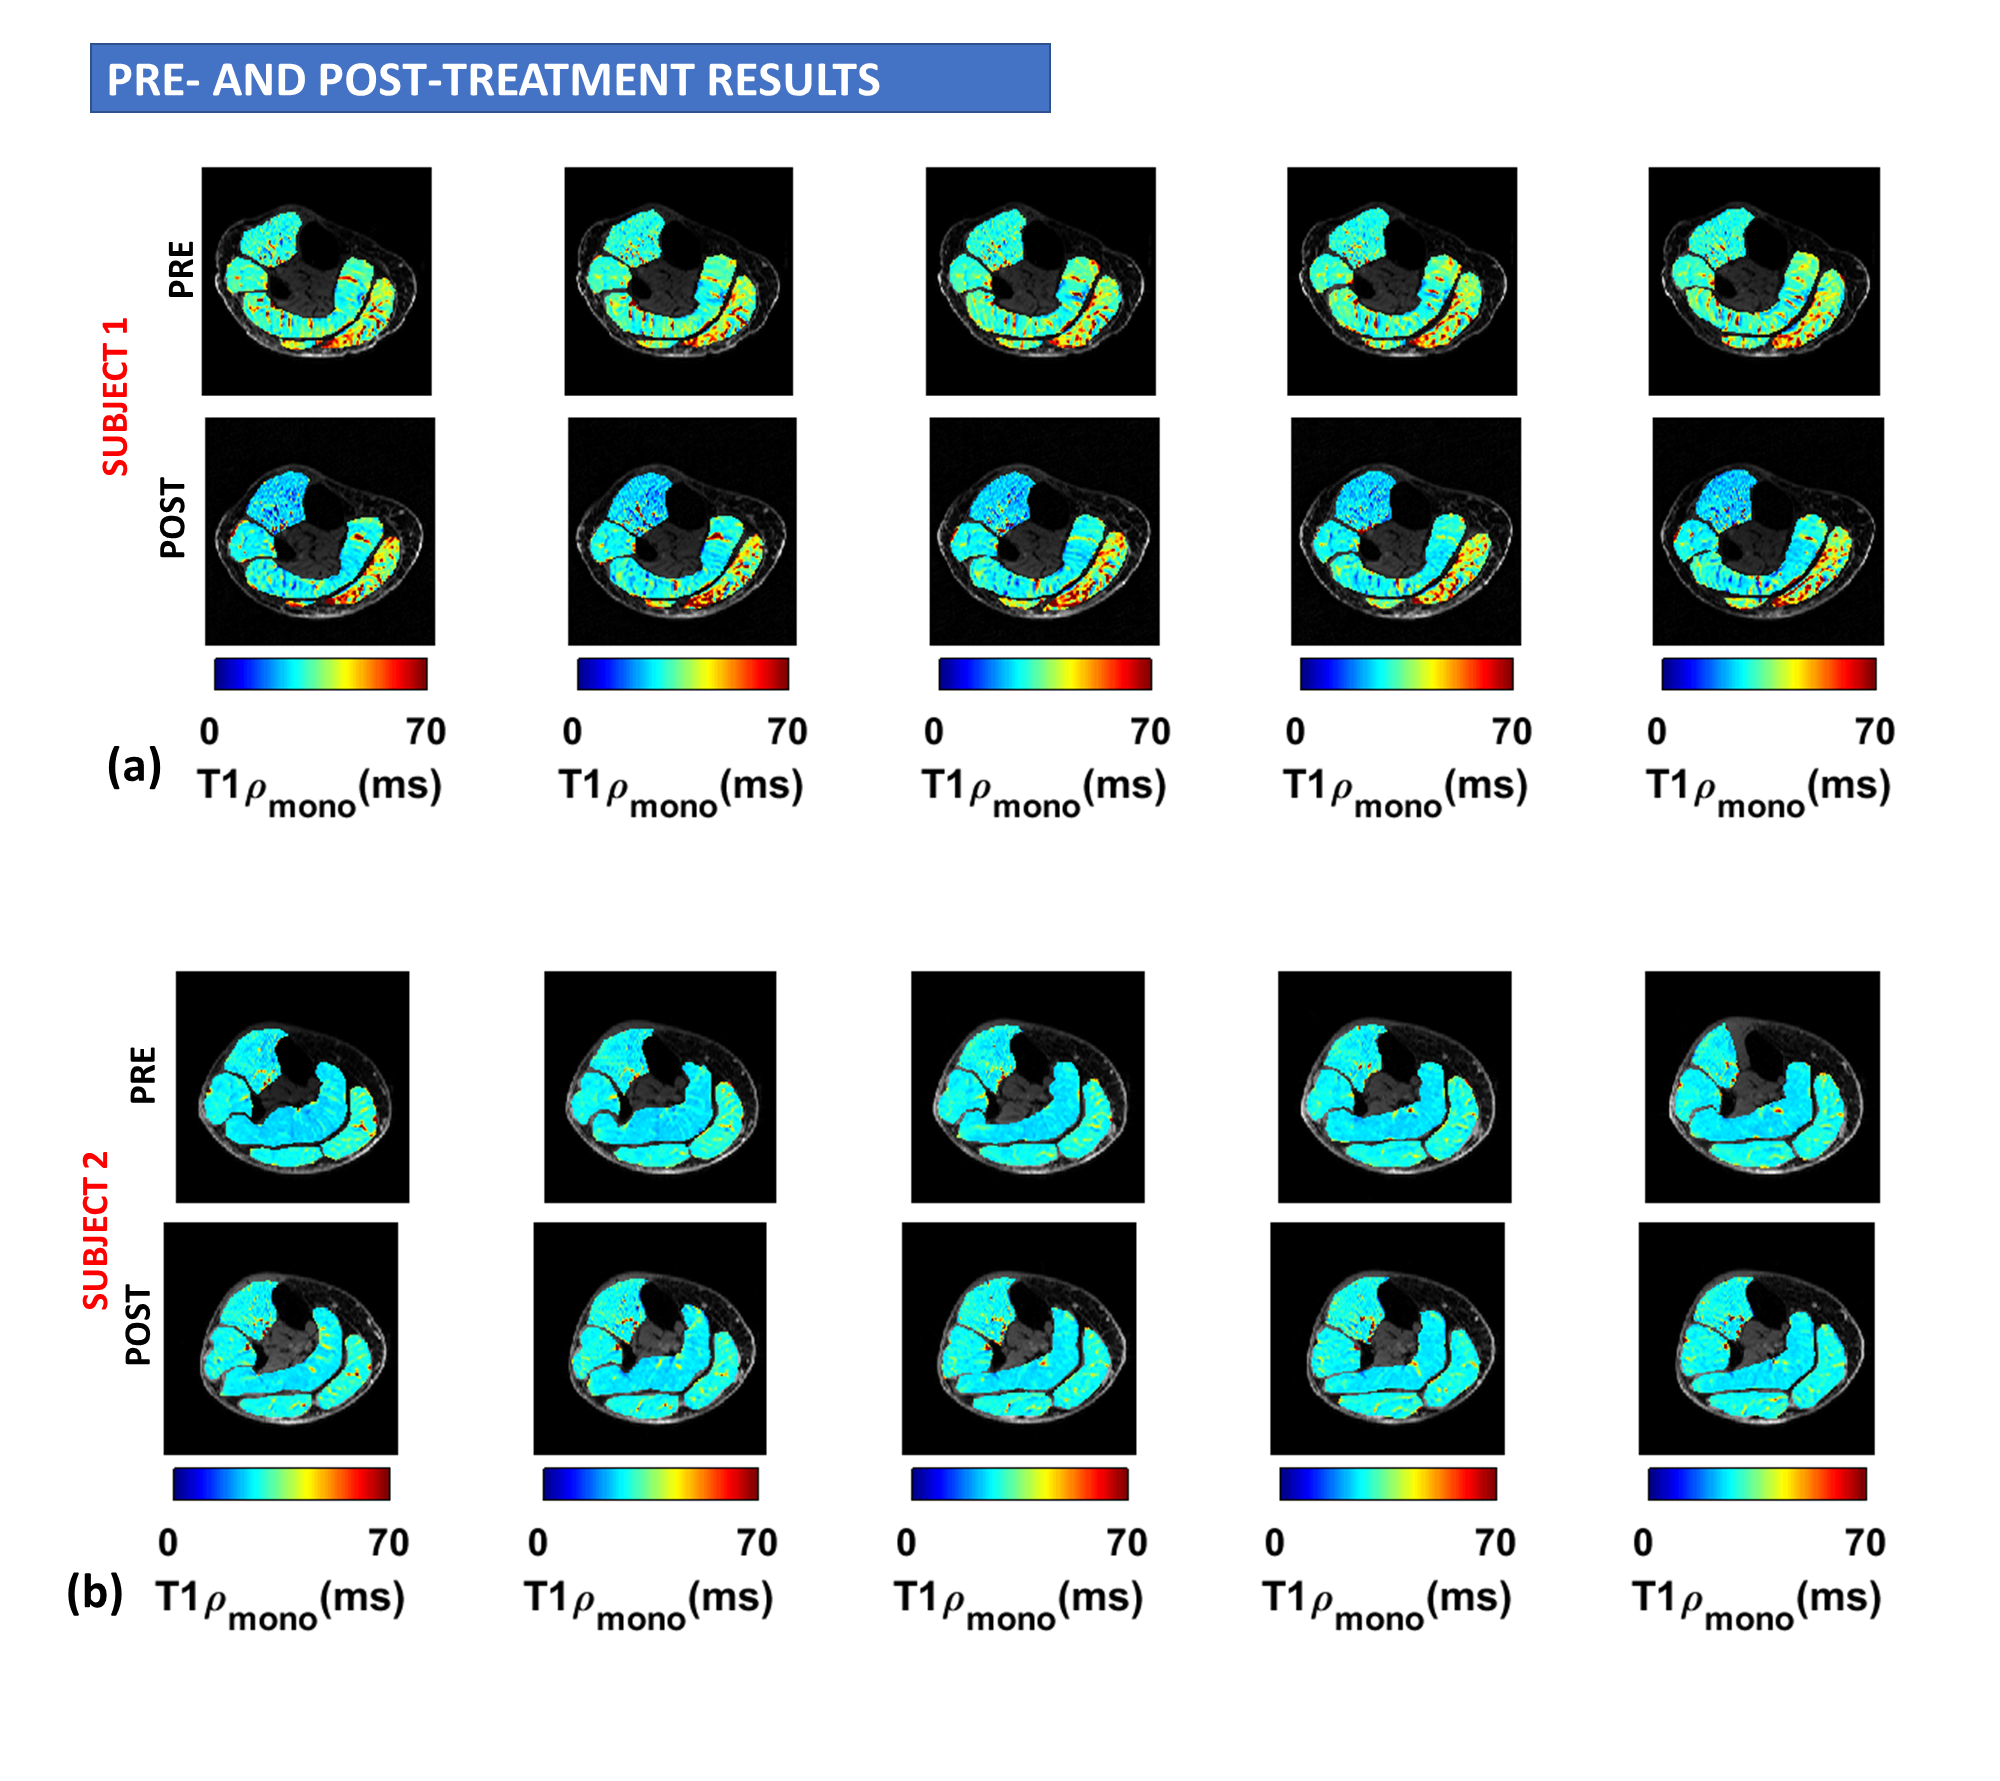
Figure 3: Results from pre- and post-treatment imaging. (a) In representative Subject 1, improvement from exercise intervention is seen across the ROI (b) in representative Subject 2, improvement from the exercise treatment are seen in focal areas.
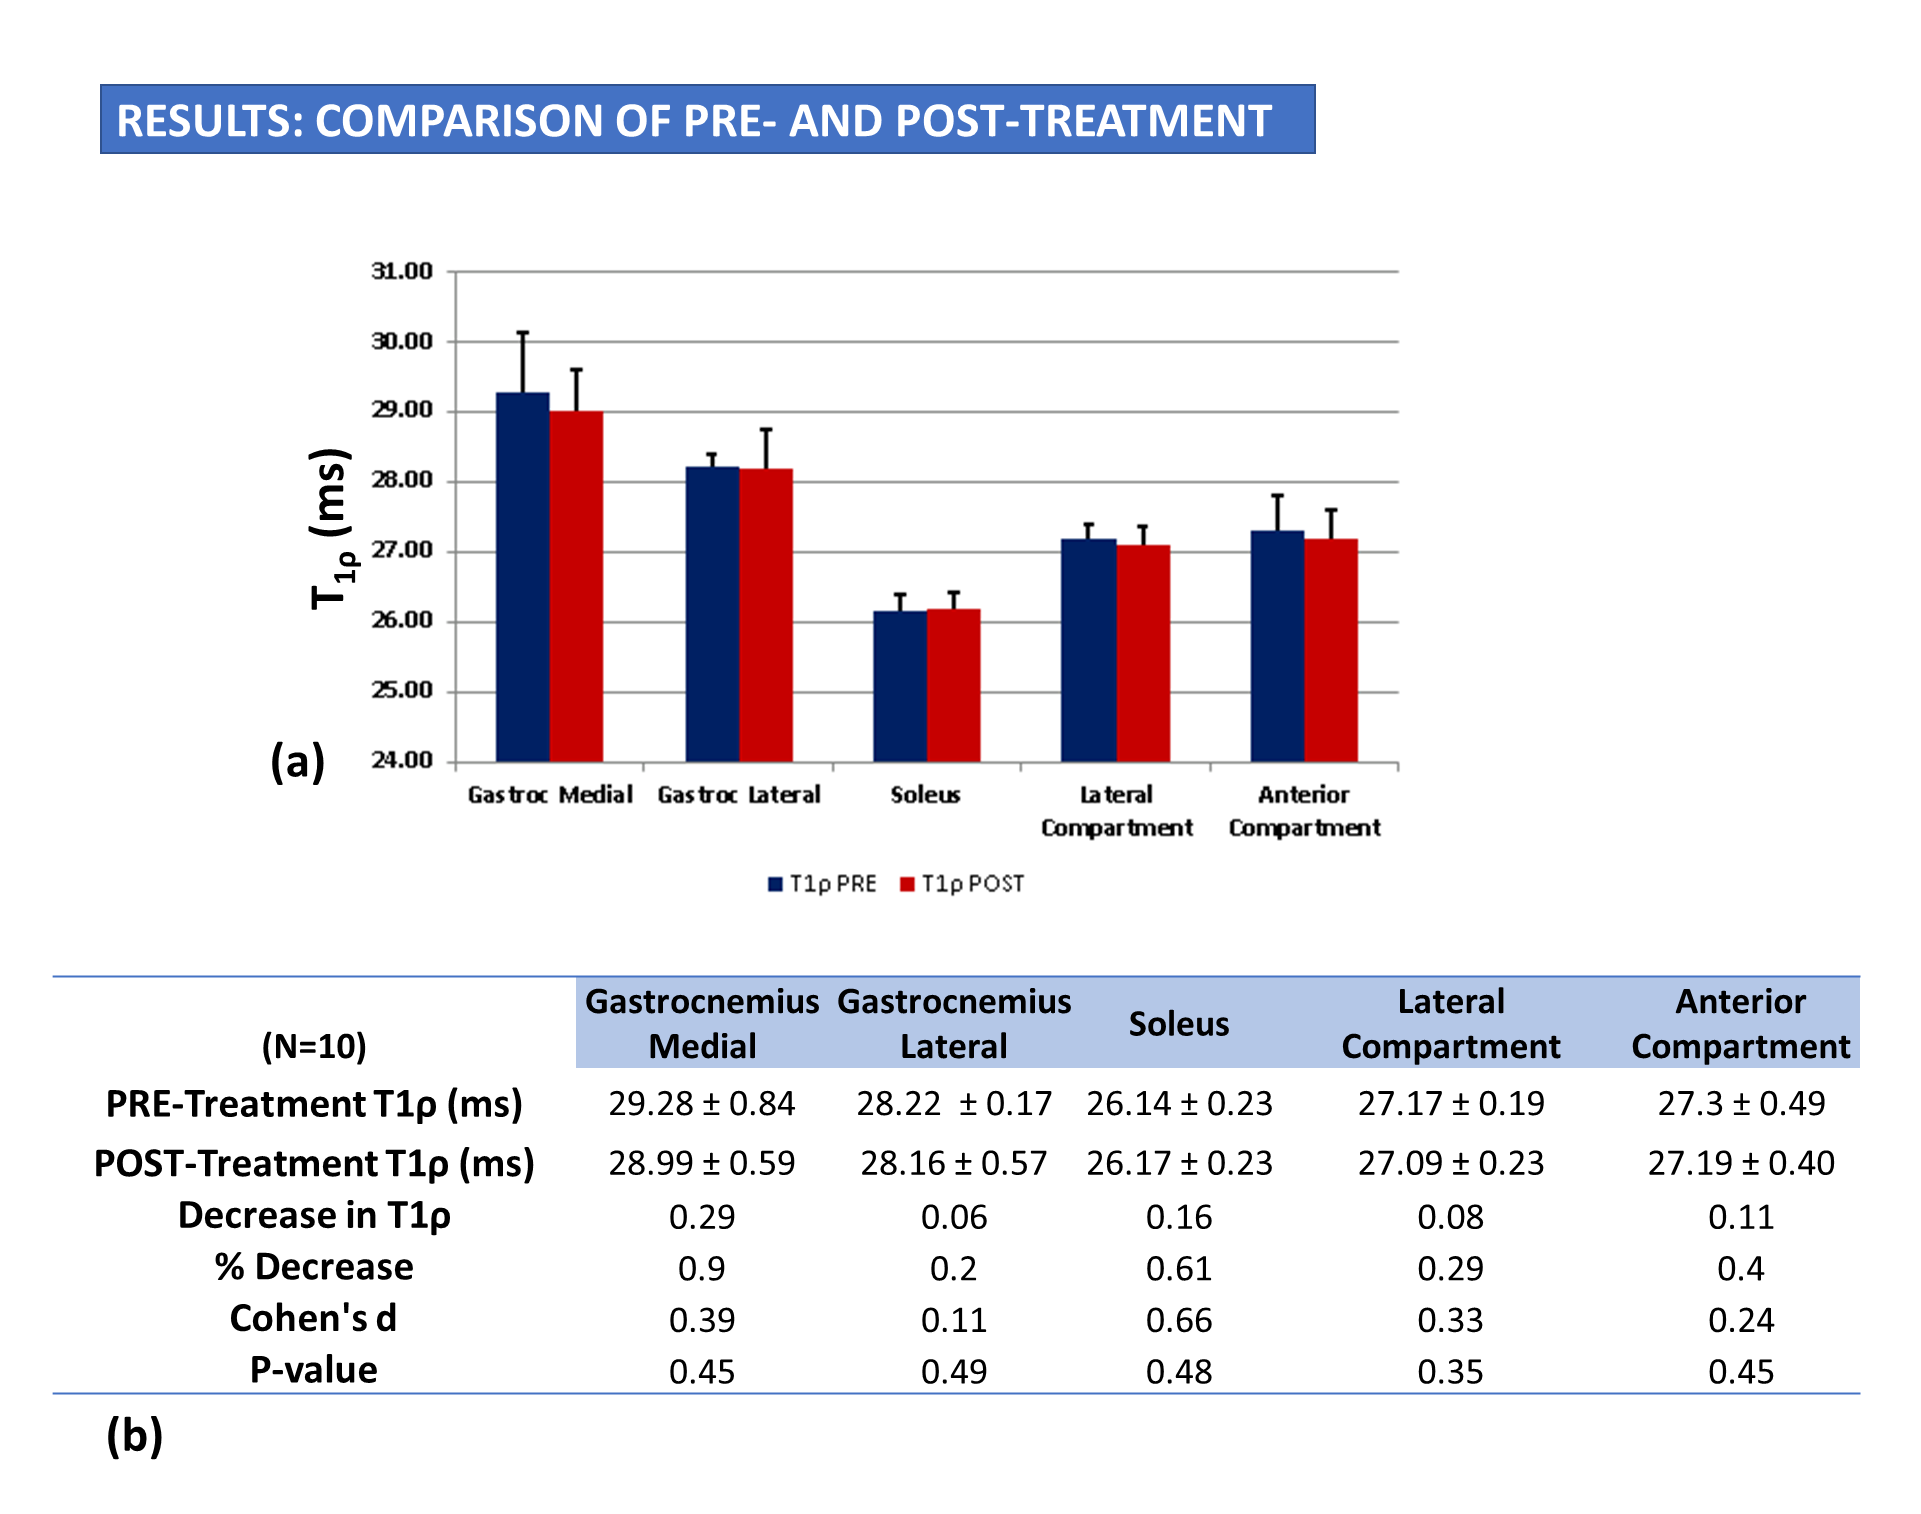
Figure 4: (a) Results show the comparison of pre- and post-treatment across all subjects in the ROIs tested. (b) table shows the mean and standard deviation in pre- and post-treatment T1ρ values from each ROI
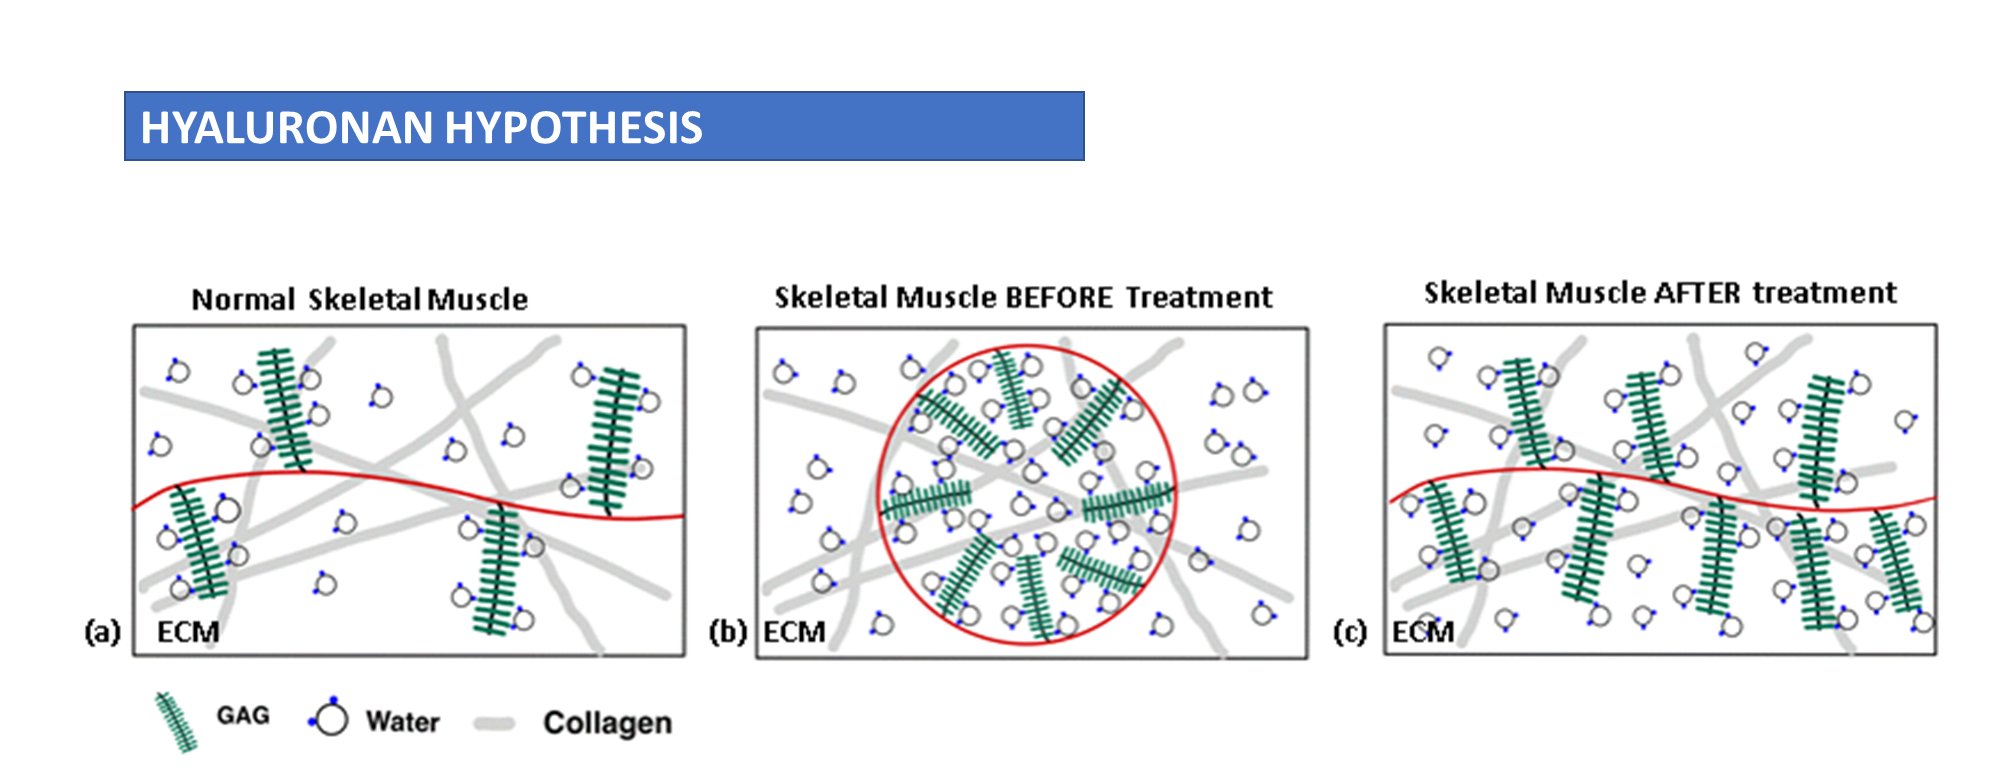
Figure 5:Schematic of micro-evironment and Hyaluronan Hypothesis (a) shows normal skeletal muscle physiology. (b) in T2DM, a number of pathological processes result in hyaluronan aggregates that manifest as muscle stiffness (c) Following movement and exercise treatment these aggregates can be loosened leading to a reduction in muscle stiffness.