4062
Towards patient-friendly arterial-spin-labeling MRI in muscle: Effect of exercise intensity and standardisation on perfusion parameters1C.J. Gorter MRI Center, Department of Radiology, Leiden University Medical Center, Leiden, Netherlands, 2Department of Neurology, Leiden University Medical Center, Leiden, Netherlands, 3Laboratoire des Maladies Neurodégénératives, Université Paris-Saclay, Fontenay-aux-Roses, France
Synopsis
Keywords: Muscle, Perfusion, Exercise
Perfusion is fundamental to muscle function, and is limited in muscular dystrophies—representing a promising biomarker for clinical trials. However, in-magnet exercise paradigms for measuring ASL perfusion are seldom standardised and require high-intensity exercise, which is impracticable in patients. In volunteers, we tested the acceptability of three protocols: two standardised paradigms with different intensities, and a non-standardised paradigm at a single intensity. Exercise standardisation improved SNR. In general, muscle blood flow, T2*, and SNR decreased, while arterial transit time increased with time after exercise; T2* was higher after high-intensity exercise. SNR at lower exercise-intensity was insufficient for robust perfusion-parameter estimation.Introduction
Progressive loss of muscle strength and function are hallmarks of muscular dystrophies. In dystrophinopathies in particular, impaired muscle perfusion is observed during exercise. This is due to decreased or absent vasodilation, leading to muscle damage through insufficient oxygen supply.1,2 Potential treatments aim to improve perfusion and minimise such damage.2 These could be evaluated via non-invasive arterial-spin-labelling MRI; however, patients are expected to show lower post-exercise perfusion than controls, and thus lower perfusion SNR. Further, many dystrophinopathy patients are known to have limited muscle functional capacity, so exercise paradigms should be relatively low intensity, to minimise burden.In this study, we compare three in-magnet ASL exercise paradigms—two standardised, with different exercise intensities, and one non-standardised at a single intensity—to develop a patient-acceptable ASL protocol. We report muscle blood flow (MBF), arterial transit time (ATT), T2*, and SNR for all comparisons.
Methods
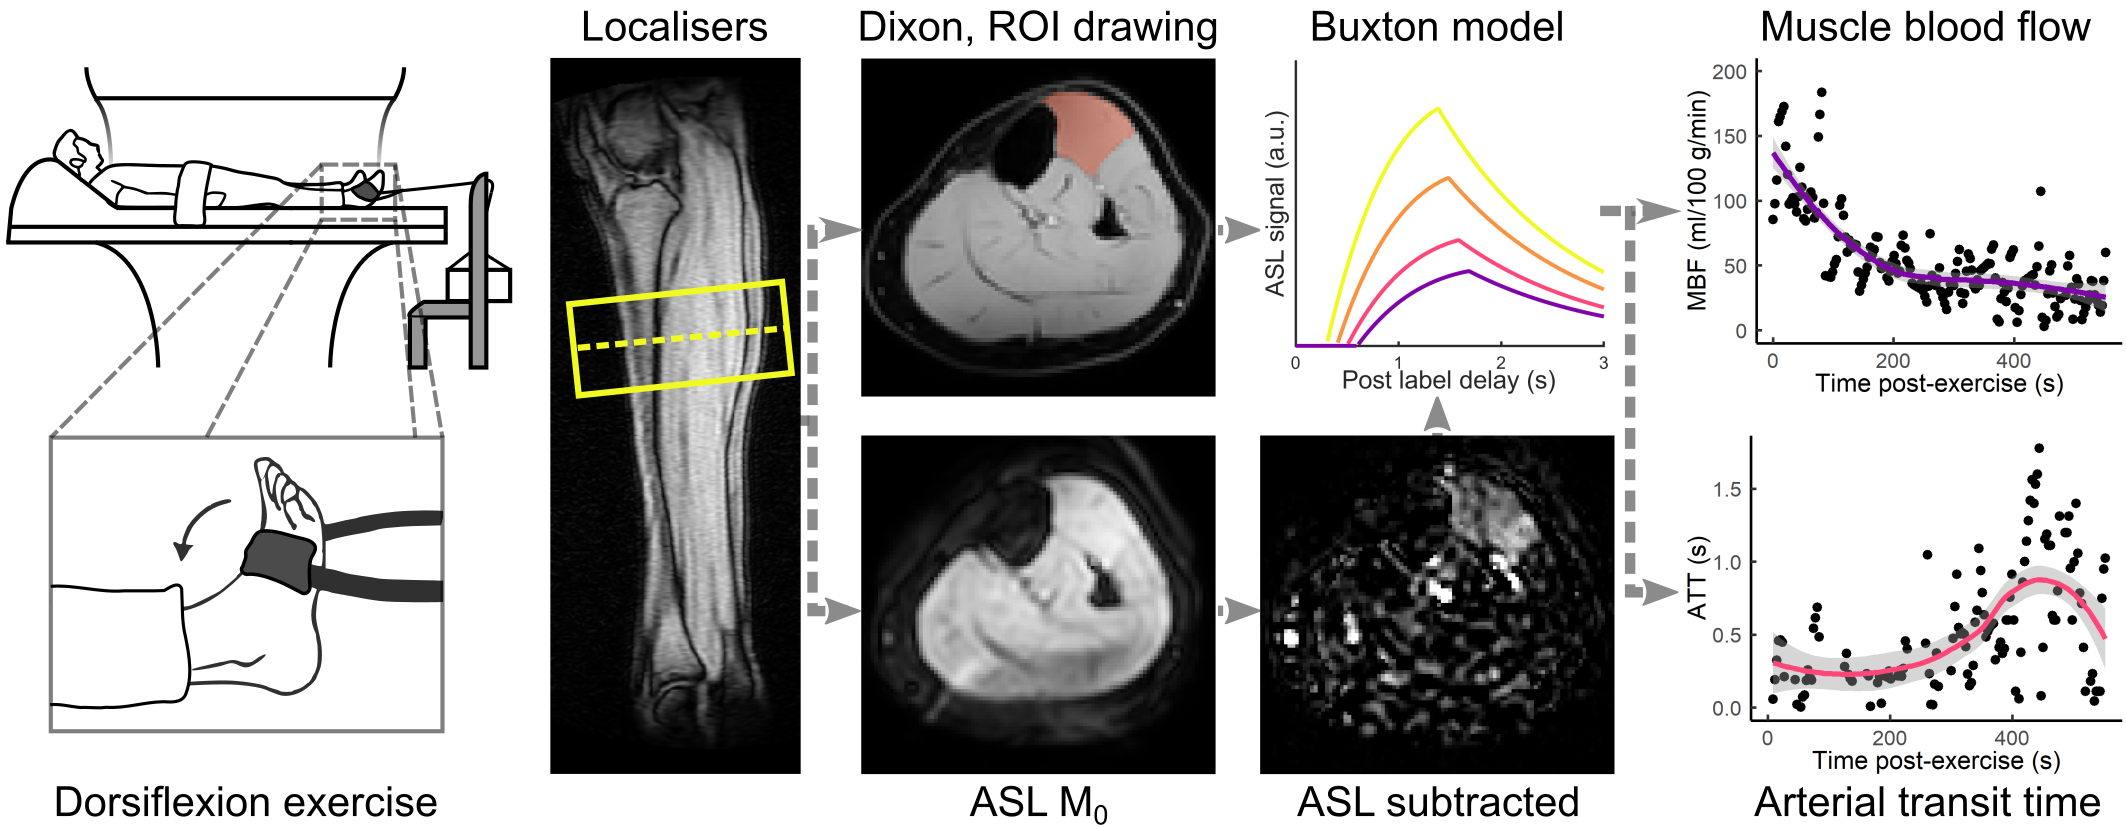
We recruited 5 volunteers, who were scanned at 3T (Philips Ingenia) with an eight-element receive array wrapped around the lower leg. An axial three-point multi-acquisition chemical-shift-based fat-water-separation scan was acquired inferior to the tibial plateau at 40% of the length of the tibia. Split-label pulsed-ASL MRI3 consisted of single-shot three-echo EPI (TR/TE/∆TE=3000/14.0/17.4ms; SENSE factor=2.3; FOV=190mm×190mm×86mm; voxel-size=3×3×8mm3; 2 slices, gap=70mm, SPIR fat suppression) with ten Look-Locker-sampled post-label delays (PLDs, 600:200:2400ms) for perfusion quantification. A QUIPSS module was applied between PLDs 3–4 to produce a sharp labelling bolus after 1,000ms. Finally, SNR was determined via noise scans, without RF or gradients, that were otherwise identical to the ASL-scans.4ASL-MRI was performed during 3mins rest, 5mins exercise, and 10mins post-exercise recovery. The non-standardised exercise was self-guided; for comparison with standardised data, we added historical ASL data (n=12) obtained with this paradigm and identical scan parameters.5 The standardised exercise (n=5) used PsychoPy (v2)6 animations to synchronise motion to dead time during scanning. Both paradigms consisted of 5mins dynamic dorsiflexion with a load set to 25% of the maximum voluntary contraction (MVC, determined using a handheld dynamometer) for the non-standardised exercise, or both 25% and 15% MVC for the standardised exercise. When testing both loads, one exercise bout was performed per leg, in random order.
Analysis was performed in Python (v3.10). Regions of interest (ROIs) were drawn in the tibialis anterior on water images, and registered to ASL source images in SimpleElastix (v0.10). Average ASL signals were calculated per ROI, slice, PLD, and dynamic, and used for SNR determination.4 M0 was estimated per dynamic and MBF and ATT were least-squares fitted with the Buxton kinetic model.7
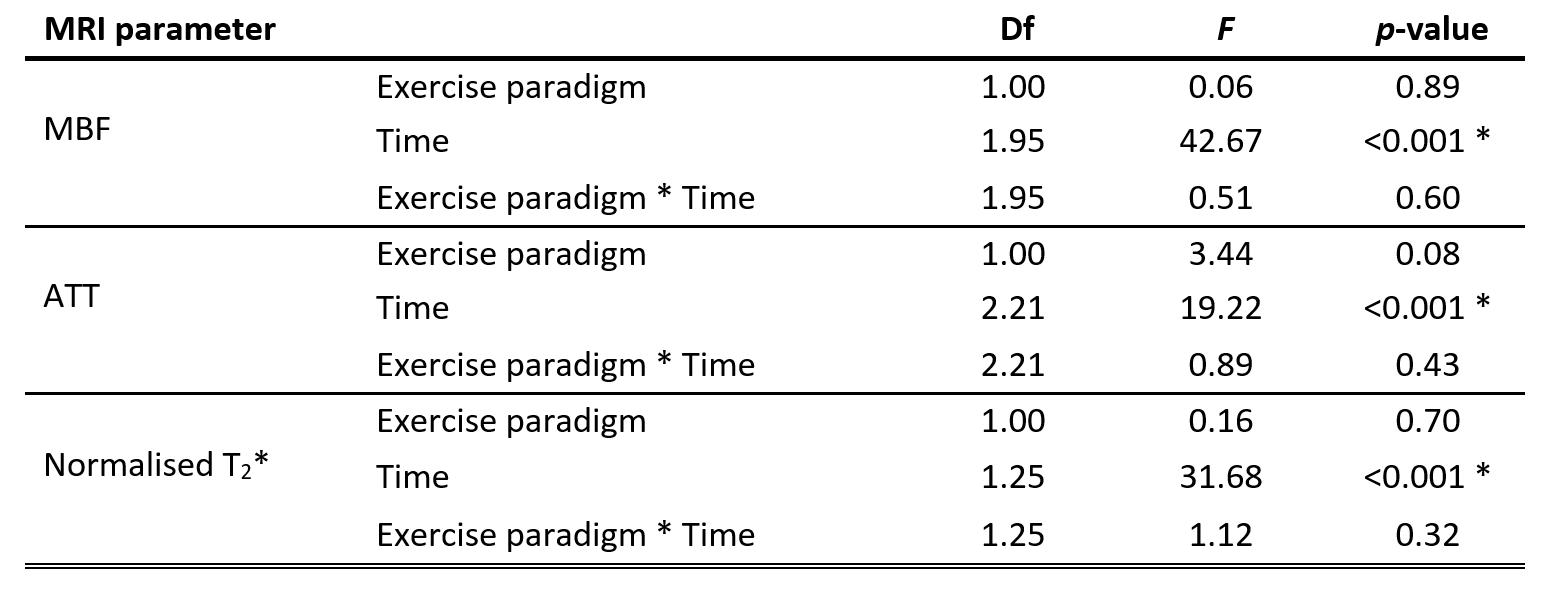
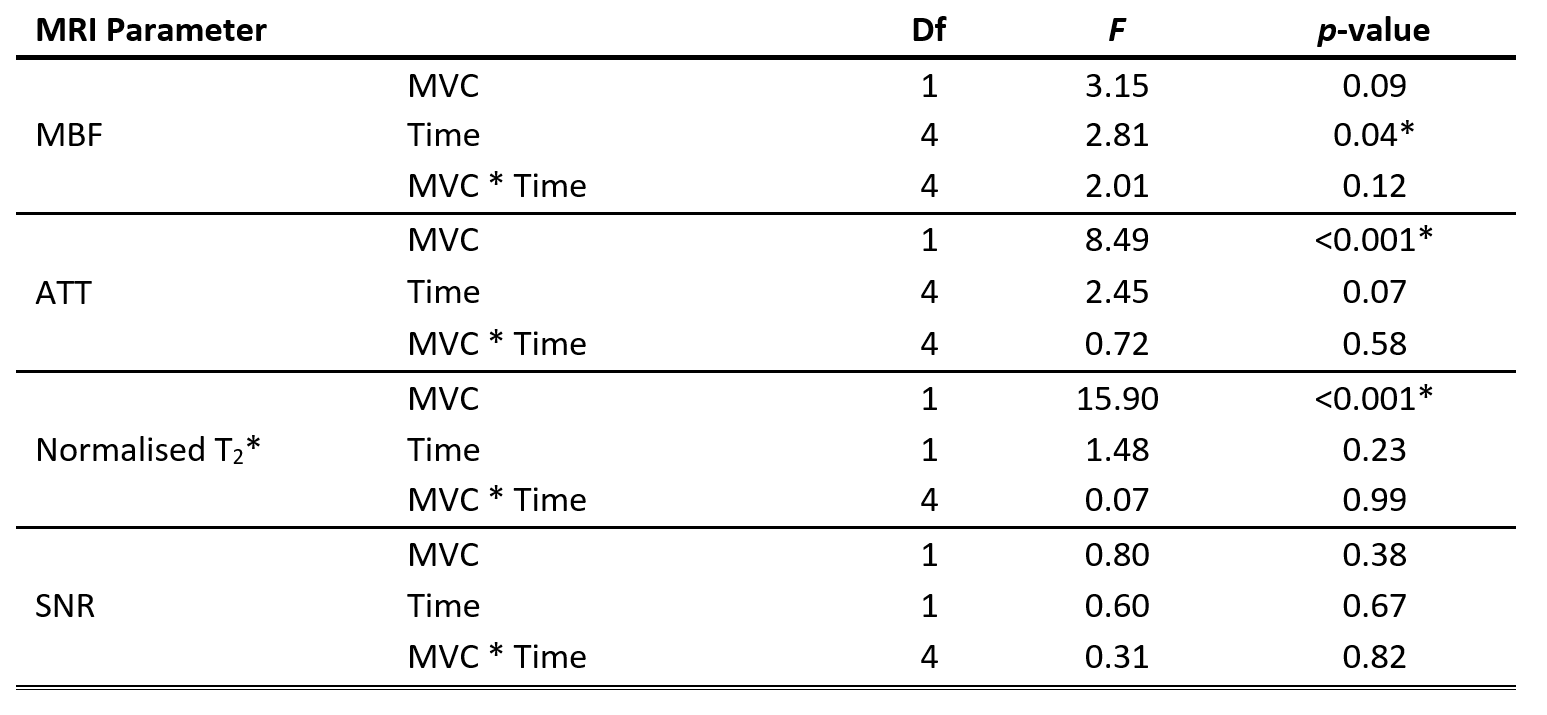
For statistical analysis in R (v4.1), post-exercise data were split into five equal epochs, and parameter medians and interquartile ranges for different paradigms were compared using two-way repeated-measures/mixed ANOVA.
Results
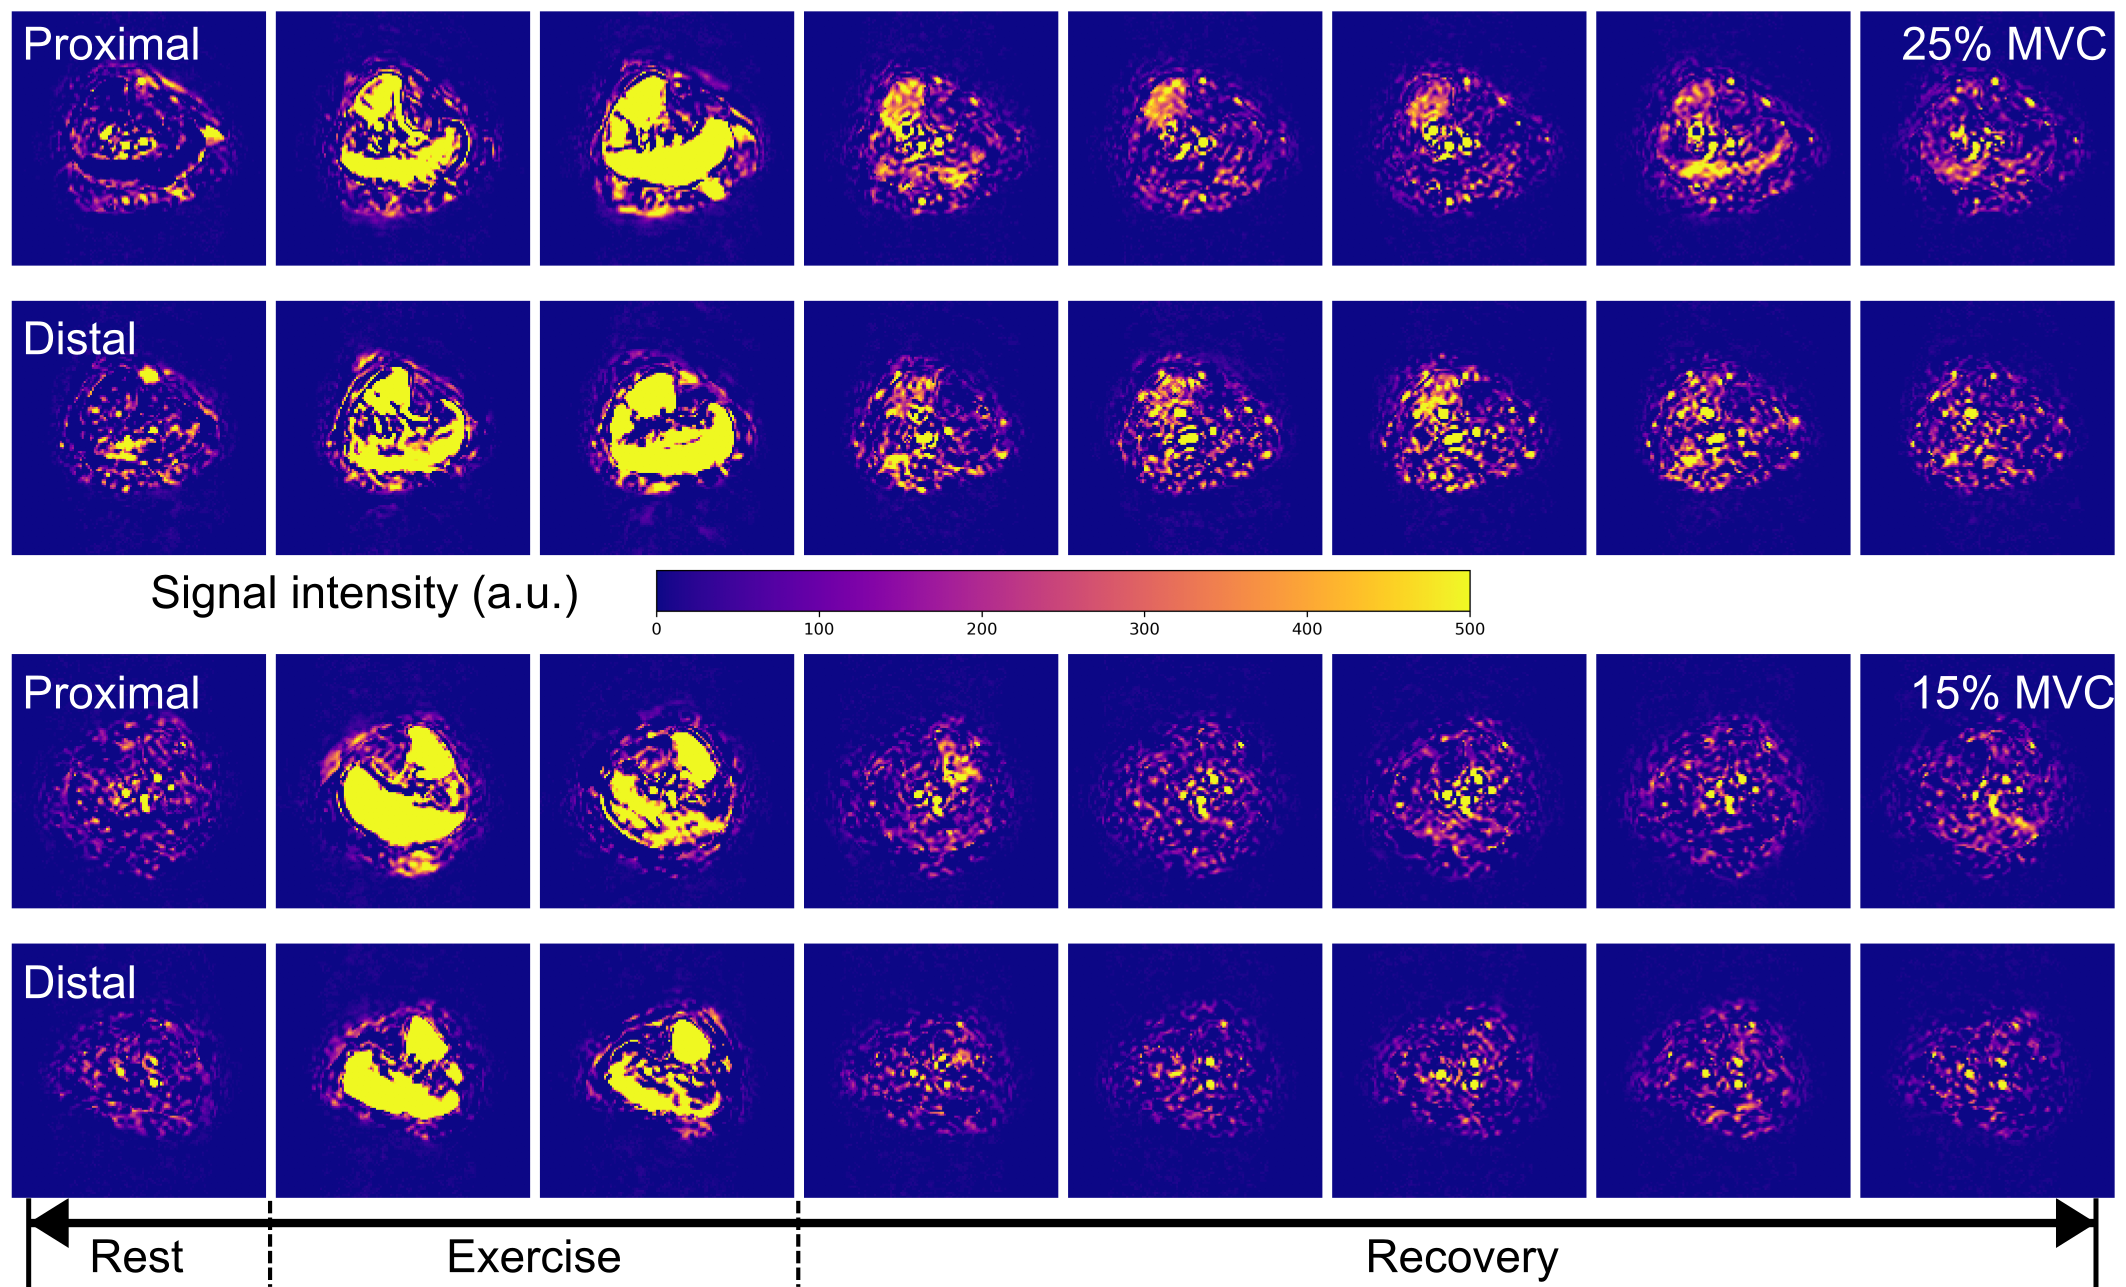
Figure 1 illustrates the set-up, example images, and representative MBF and ATT time-course data, and mixed/repeated-measures ANOVA results are shown in Tables 1 and 2. Most participants reported cramps towards the end of the 25% MVC bout, but not for 15% MVC.Data acquired with standardised exercise tended to show less dispersion than those acquired with non-standardised exercise (p<0.05 for MBF, T2*), as did data acquired at 25% MVC versus 15% MVC. The MBF area-under-the-curve did not differ between 25% and 15% MVC. T2*, was higher for the 25% MVC data, particularly in the proximal slice. Finally, perfusion was elevated for longer in 25% than in 15% MVC data, as represented in Figure 2; data acquired at 15% MVC did not achieve an SNR of at least 6, as we previously recommended for accurate ASL parameter estimation.8
Discussion
We investigated whether exercise standardisation improves ASL parameter estimates and whether exercise intensity can be lowered while maintaining adequate SNR. We observed less variability in data obtained with a standardised protocol and higher exercise intensities (25% MVC). Ultimately, the observed SNR was too low at 15% MVC for accurate parameter estimation.Standardised exercise paradigms are expected to lead to less inter-individual variability and better longitudinal consistency, as preferred for group comparisons and clinical trials. Though our standardised data appeared less variable than the non-standardised data, this was not consistently statistically significant. Expectations for lower-MVC exercise protocols are lower MBF and SNR, longer ATT, and smaller T2* differences pre- and post-exercise; these differences were indeed significant in our data, except for MBF and SNR. We also observed greater variability in ASL parameters at 15% MVC, likely due to lower SNR. Indeed, low SNR may explain the non-physiological ATTs we observed—including negative values. We previously reported a minimum SNR of 6 for accurate ASL parameter estimation8, and data at 15% MVC did not reach this threshold. For 25% MVC data, the SNR decreased below this threshold over time, leading to increased errors at later timepoints. This is a particular challenge for model-based analyses.
Lastly, T2* was higher at 25% than at 15% MVC, and may reflect the muscle cramps reported at this intensity, and changes in pH.9 This phenomenon could be used to determine the exercise stop-point, though improved motion-correction and real-time processing would be required.
Conclusions
Exercise standardisation improves ASL data quality, but a near-50% reduction in exercise intensity is not possible without unacceptable quality loss. Further improvements are required to develop patient-friendly exercise ASL protocols.Acknowledgements
No acknowledgement found.References
1. Sander M, Chavoshan B, Harris SA, Iannaccone ST, Stull JT, Thomas GD, Victor RG. Functional muscle ischemia in neuronal nitric oxide synthase-deficient skeletal muscle of children with Duchenne muscular dystrophy. Proceedings of the National Academy of Sciences 2000; 97(25), 13818–23. doi:10.1073pnas.250379497
2. Martin EA, Barresi R, Byrne BJ, Tsimerinov EI, Scott BL, Walker AE, Gurudevan SV, Anene F, Elashoff RM, Thomas GD, Victor RG. Tadalafil alleviates muscle ischemia in patients with Becker muscular dystrophy. Science Translational Medicine 2012; 4(162). doi:10.1126/scitranslmed.3004327
3. Baligand C, Hirschler L, Veeger TT, Václavů L, Franklin SL, van Osch MJ, Kan HE. A split‐label design for simultaneous measurements of perfusion in distant slices by pulsed arterial spin labeling. Magnetic Resonance in Medicine. 2021; 86:2441– 2453.
4. Yu J, Agarwal H, Stuber M, Schär M. Practical signal‐to‐noise ratio quantification for sensitivity encoding: Application to coronary MR angiography. Journal of Magnetic Resonance Imaging. 2011; 33(6):1330-40.
5. Veeger TT, Hirschler L, Baligand C, Franklin SL, Webb AG, de Groot JH, van Osch MJ, Kan HE. Microvascular response to exercise varies along the length of the tibialis anterior muscle. NMR in Biomedicine. 2022;35(11):e4796. doi:10.1002/nbm.4796
6. Peirce JW., Gray JR., Simpson S, MacAskill MR, Höchenberger R, Sogo H, Kastman E, Lindeløv J. PsychoPy2: experiments in behavior made easy. Behavior Research Methods 2019; doi:10.3758/s13428-018-01193-y
7. Buxton RB, Frank LR, Wong EC, Siewert B, Warach S, Edelman RR. A general kinetic model for quantitative perfusion imaging with arterial spin labeling. Magnetic Resonance in Medicine. 1998; 40:383–96. doi:10.1002/mrm.1910400308
8. Cameron D, Veeger TTJ, Schrama E, Baligand C, Hirschler L, van Osch MJP, Kan HE. Signal-to-noise requirements for accurate and precise perfusion parameter estimation with pulsed arterial spin labeling MRI in skeletal muscle. Proceedings of the International Society of Magnetic Resonance in Medicine 31, 2022, London, UK.
9. Vandenborne K, Walter G, Ploutz-Snyder L, Dudley G, Elliott MA, De Meirleir K. Relationship between muscle T2* relaxation properties and metabolic state: a combined localized 31P-spectroscopy and 1H-imaging study. European journal of applied physiology. 2000 May;82(1):76-82.
Figures