4058
Association Between Modic Change and Paraspinal Muscle Fat Infiltration Based on MRI1Chengdu Sport University, Chengdu, Sichuan, China, 2GE Healthcare China, Beijing, China, 3Sichuan Province Orthopedic Hospital, Chengdu, Sichuan, China
Synopsis
Keywords: Muscle, Fat, Quantitative imaging, Modic change
Paraspinal muscles play an important role in maintaining the stability of lumbar spine. The influencing factors of paraspinal muscle degeneration are still controversial. IDEAL-IQ MR sequence can provide quantitative fat fraction map to objectively and accurately evaluate the fat infiltration in paraspinal muscles. By using IDEAL-IQ MR sequence, this study investigated the influence of Modic change (MC) on quantitative propertied of paraspinal muscles in patients with low back pain (LBP). Our results showed that MC can aggravate the degeneration of paraspinal muscles, especially the multifidus, in LBP patients.Introduction
Paraspinal muscles quality was closely related to lumbar disc herniation (LDH) and low back pain (LBP) (1,2). The muscle cross-sectional area (CSA) and fat content are two common imaging indicators to assess muscle quality. Most previous studies used semi-quantitative MR techniques to evaluate the fat content of paraspinal muscles (3,4), which can be subjective and inaccurate. As a new quantitative MR technique, chemical shift-encoded IDEAL-IQ (5) sequence can provide accurate fat fraction (FF) values of paraspinal muscles (6,7). Whether the paraspinal muscle CSA changes in LBP patients is still controversial (4,5). These may affect the clinical judgment of the condition of LPB patients and result in poor treatment effect. Modic change (MC) is also an independent risk factor for LBP (8), previous studies (3) used semi quantitative scores to evaluate the relationship between MC and fat content of paraspinal muscles, which concluded that subjects with MC had more severe steatosis. This study aimed to evaluate the correlation between MC and the properties (CSA and FF) of paraspinal muscles in LBP patients through quantitative MR technique, to understand the role of MC in the process of paraspinal muscle degeneration.Methods
Patients: After IRB-approved written informed consent was obtained, 194 preoperative LBP patients were scanned on 3.0 T MRI (SIGNA Architect, GE Healthcare, USA) and enrolled in this study. Routine lumbar MR examination and axial IDEAL-IQ sequence scan were performed for each patient.Imaging parameters: The MR scan included routine sagittal T2- and T1-weighted imaging, axial IDEAL-IQ (2.0×2.0×2.0 mm3, TR=8.0 ms, TE=3.6 ms, number of TEs=6, number of shots=2).
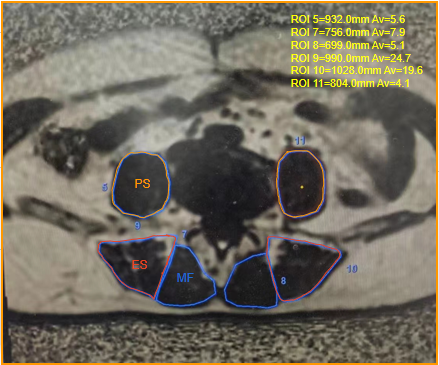
Data processing: The IDEAL-IQ images were processed in the AW4.7 workstation (GE Healthcare) to calculate the FF map. The mean FF and CSA values of the bilateral paraspinal muscles, including multifidus (MF), erector spinae (ES) and psoas major (PS), were obtained on a ROI basis at the central level of L4/5 and L5/S1 (Figure 1). The sagittal T2- and T1-weighted images were used to identify whether MC appears in the L4 to S1 subchondral vertebral bone marrow, according to the standard proposed by Modic et al (9). The patients were divided into 4 groups according to whether LDH and MC exist in L4 to S1 segments: (1) group 1, no MC or LDH; (2) group 2, with MC but no LDH; (3) group 3, with LHD but no MC; and (4) group 4, with both MC and LDH. We hypothesize that the four grades represent different degrees of spinal degeneration. The degeneration from grade 1 to grade 4.
Statistical analysis: All analyses were performed using SPSS 22.0 software. The differences of FF and CSA in PS, ES and MF muscles among 4 groups were assessed by one-way analysis of variance (ANOVA) followed by post-hoc LSD test. Spearman’s rank correlation was used to assess the correlation between FF/CSA values of paraspinal muscles and groups (grades). Pearson correlation coefficient was used for analyzing the correlation between continuous variables.
Results
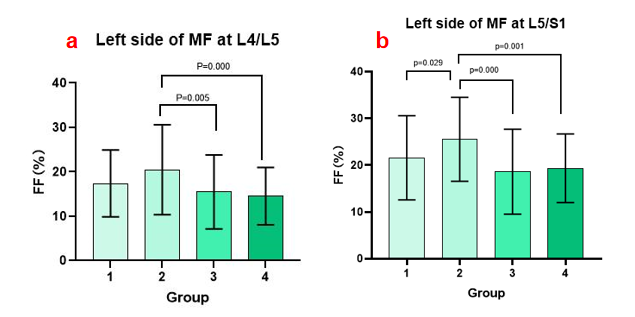
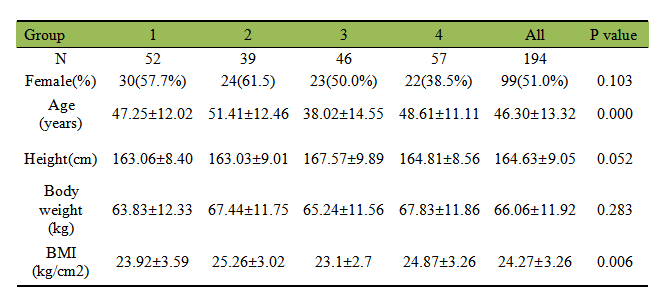
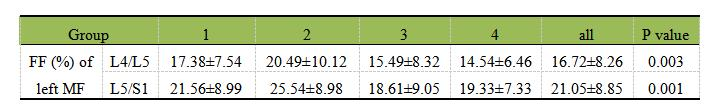
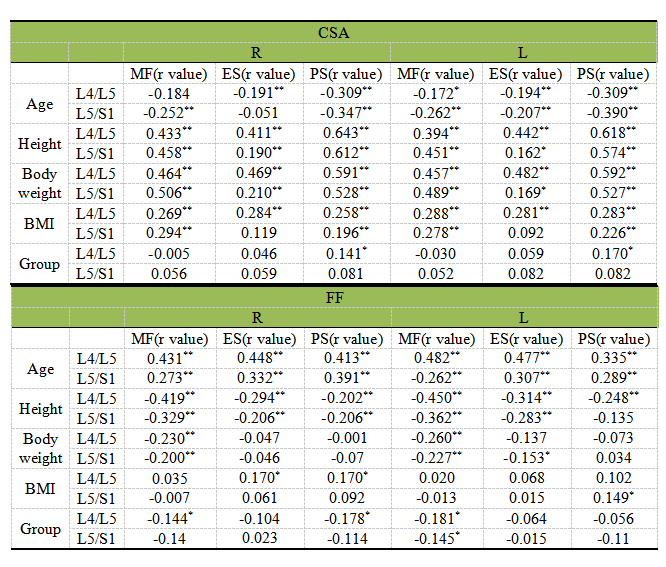
As shown in Table 1, there was statistically significant differences in age among groups. As shown in Figure 2 and Table 2, at L4/L5 level, FF of the left side MF was statistically different (P=0.003) among groups. The FF (%) values in groups 1 to 4 were 17.38±7.54, 20.49±10.1, 15.49±8.32 and 14.54±6.46. In detail, FF was significantly different between group 2 and 3 (p=0.005), as well as group 2 and 4 (p=0.000). At L5/S1 level, FF of the left side MF was statistically different among groups (P=0.001). The FF (%) values in groups 1 to 4 were 21.56±8.99, 25.54±18.61, 18.61±9.05, and 19.33±7.33. In detail, FF was significantly different between group 1 and 2 (p=0.029), group 2 and 3 (p=0.000), as well as group 2 and 4 (p=0.001). As shown in Table 3, age was positively correlated with FF but negatively correlated with CSA of paraspinal muscles. Height and body weight were positively correlated with CSA but negatively correlated with FF of paraspinal muscles.Discussion
According to our results, patients with MC showed a stronger degeneration tendency in MF than those without MC (group1 and 2 in Figure2b). Different from our hypothesis, the patients in group 2 had the highest FF in the left MF at both L4/L5 and L5/S1 levels, while patients with LDH (group 3) have lower FF, which is inconsistent with other studies (2). According to previous findings, MC will not appear near healthy discs, and LDH occurs earlier than MC (10). Therefore, we speculated that some subjects in group 2 experienced reabsorption after LDH. In addition, patients in group 2 were the oldest (p=0.000), which may also be a reason for the highest FF in group 2. In any case, the results revealed the importance of MC in judging the quality of paraspinal muscles in LBP patients. Sometimes patients who simply show MC signs may have more severe degeneration of paraspinal muscles than those with LDH.Conclusions
Age, height and body weight were related factors of paraspinal muscle degeneration. MC could promote the degeneration of multifidus in patients with low back pain.Acknowledgements
No acknowledgement found.References
1. Ogon I, Takebayashi T, Takashima H, et al. Magnetic resonance spectroscopic analysis of multifidus muscles lipid content and association with spinopelvic malalignment in chronic low back pain. Br. J. Radiol. 2017;90:20160753.
2. Stevens S, Agten A, Timmermans A, Vandenabeele F. Unilateral changes of the multifidus in persons with lumbar disc herniation: a systematic review and meta-analysis. Spine J. 2020;20(10):1573-1585. doi:10.1016/j.spinee.2020.04.007
3. Atci IB, Yilmaz H, Samanci MY, Atci AG, Karagoz Y. The prevalence of lumbar paraspinal muscle fatty degeneration in patients with modic type i and i/ii end plate changes. Asian Spine J. 2020;14:185.
4. Ranger TA, Cicuttini FM, Jensen TS, et al. Are the size and composition of the paraspinal muscles associated with low back pain? A systematic review. Spine J. 2017;17:1729–1748.
5. Yu H, Shimakawa A, McKenzie CA, Brodsky E, Brittain JH, Reeder SB. Multiecho water-fat separation and simultaneous R estimation with multifrequency fat spectrum modeling. Magn. Reson. Med. Off. J. Int. Soc. Magn. Reson. Med. 2008;60:1122–1134.
6. Fischer MA, Nanz D, Shimakawa A, et al. Quantification of muscle fat in patients with low back pain: comparison of multi-echo MR imaging with single-voxel MR spectroscopy. Radiology 2013;266:555–563.
7. Wang Y, Zha YF, Xing D. Quantitative MRI study of the relationship between fat content in lumbar paravertebral muscles and discdegeneration. Chin J Magn Reson Imaging, 2018, 9(11): 819-824.
8. Teraguchi M, Hashizume H, Oka H, et al. Detailed Subphenotyping of Lumbar Modic Changes and Their Association with Low Back Pain in a Large Population-Based Study: The Wakayama Spine Study. Pain Ther. 2022;11(1):57-71.
9. Modic MT, Steinberg PM, Ross JS, Masaryk TJ, Carter JR. Degenerative disk disease: assessment of changes in vertebral body marrow with MR imaging. Radiology 1988;166:193–199.
10. Saukkonen J, Määttä J, Oura P, Kyllönen E, Tervonen O, Niinimäki J, Auvinen J, Karppinen J. Association Between Modic Changes and Low Back Pain in Middle Age: A Northern Finland Birth Cohort Study. Spine (Phila Pa 1976). 2020 Oct 1;45(19):1360-1367. doi: 10.1097/BRS.0000000000003529. PMID: 32341297.
Figures