4055
Intervertebral disc’s quantitative measurements from synthetic MR correlates with its degeneration and bone marrow fat fraction1Chengdu Sport University, Chengdu, China, 2GE Healthcare China, Beijing, China, 3Sichuan Province Orthopedic Hospital, Chengdu, China
Synopsis
Keywords: Muscle, Fat, Quantitative imaging, Lumbar disc herniation
The conventional Pfirrmann grading currently used to assess the degree of disc degeneration is a semi-quantitative assessment criterion. And the relationship between vertebral body bone marrow fat and disc degeneration needs further clarification. In this study, quantitative synthetic MR technique as well as fat quantification MR technique are used to investigate relationship between imaging markers and degeneration levels. Results indicates intervertebral discs’ quantitative T2, T1 and PD values are significantly different among Pfirrmann grading groups. Significant negative correlations are found between Pfirrmann grading and quantitative values. T1 and PD values have weak correlation with bone marrow fat fraction.Introduction
Lumbar disc herniation (LDH) is a common orthopedic disease. The Intervertebral disc degenerative (IDD) changes always occur in LDH patients. It has been suggested that the interaction between the intervertebral disc (IVD) and adjacent vertebral bodies may play an important role in the development of IVD degeneration, which can lead to the development of LDH (1).The intervertebral disc is the largest non-vascular tissue in the body, and its nutrition mainly comes from the adjacent vertebral body. When the bone marrow fat (BMF) of the vertebral body is higher, the nutritional pathway of the disc becomes obstructed, which will eventually lead to the appearance of IDD (2). Although the widely used Pfirrmann grading system has been modified from 5 to 8 grades (3), it is still essentially a semi-quantitative criterion for evaluating the degree of IVD degeneration, which can be subjective and prone to bias. Quantitative image marker such as T1ρ and T2 relaxation times have been investigated in the nucleus pulposus decrease with the severity of disc degeneration (4). However, traditional quantitative method took quite long scan time. A recently proposed synthetic MRI using the magnetic resonance image compilation (MAGiC) can provide quantitative measurements, i.e. T1, T2, and PD maps in a practically acceptable scan time (5). Therefore, the aim of this study was to analyze whether there is a correlation between MAGiC derived quantitative measurements and modified Pfirrmann grading; quantitative measurements and BMF, respectively.Methods
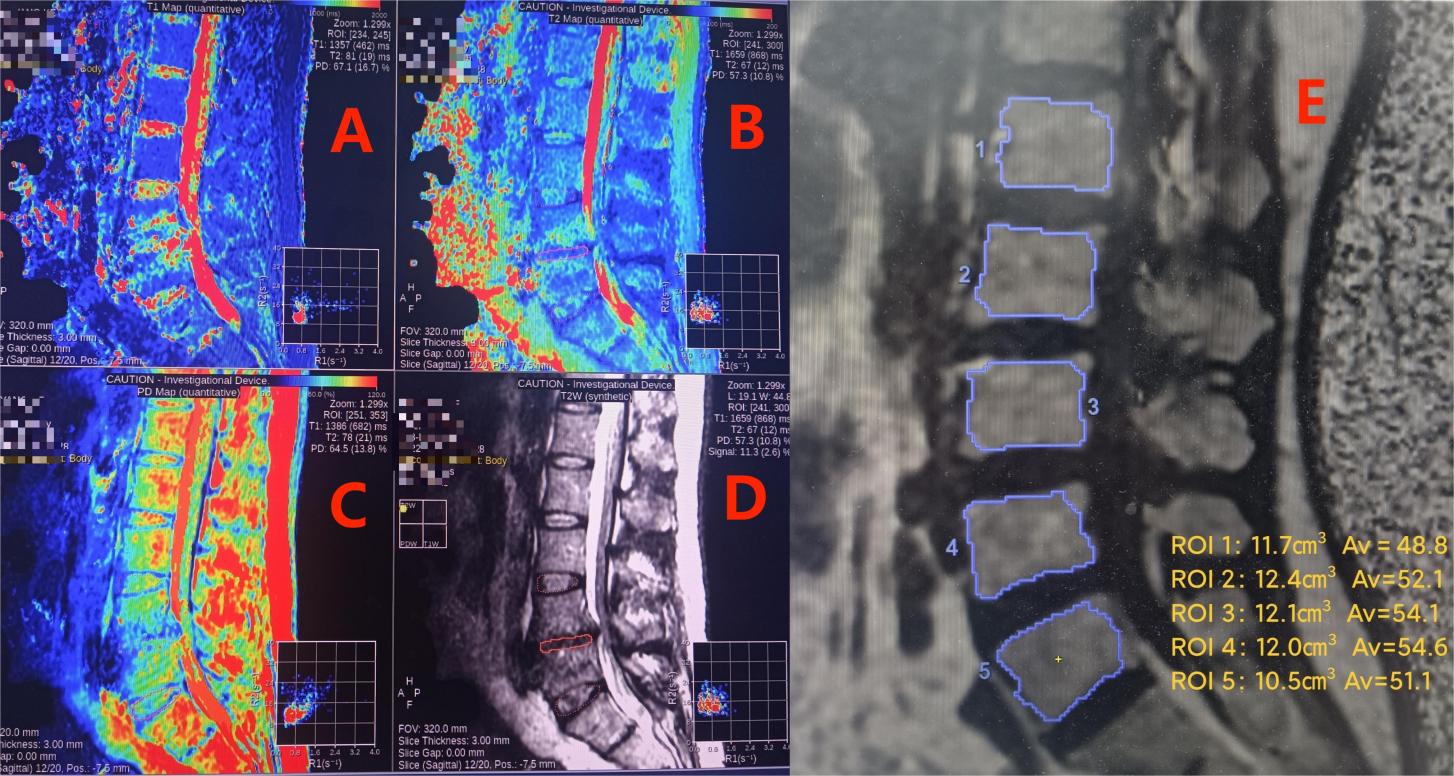
After IRB-approved written informed consent was obtained, 168 preoperative patients with low back pain were enrolled and underwent 3.0T MRI (SIGNA Architect, GE Healthcare, USA) examination. Disc levels (L1-L2, L2-L3, L3-L4, L4-L5, L5-S1) were divided into 3 groups based on modified Pfirrmann grading system (mild, grade 1 to 3; moderate, grade 4 to 5; and severe, grade 6 to 8). Routine lumbar T1/T2 weighted MR imaging, sagittal MAGiC (1.1×1.6×3.0 mm3, TR=4000 ms, TE=19.5/97.5 ms, slices=20) and IDEAL-IQ sequence were scanned for each patient. MAGiC quantitative measurements were automatically generated from the scanner console, from which the mean T1, T2, and PD values of IVD between L1 and S1 segments were measured on a ROI basis. BMF of L1-L5 vertebral bodies were derived from ROI measurement of IDEAL-IQ fat fraction maps (Figure 1).Statistical analysis: All analyses were performed using SPSS 22.0. One-way ANOVA test was used as a way to test differences in quantitative measurements and BMF among groups. p < 0.05 was considered significant. In addition, Spearman correlation tests between quantitative measurements and modified Pfirramnn grading, as well as BMF were performed separately.
Results
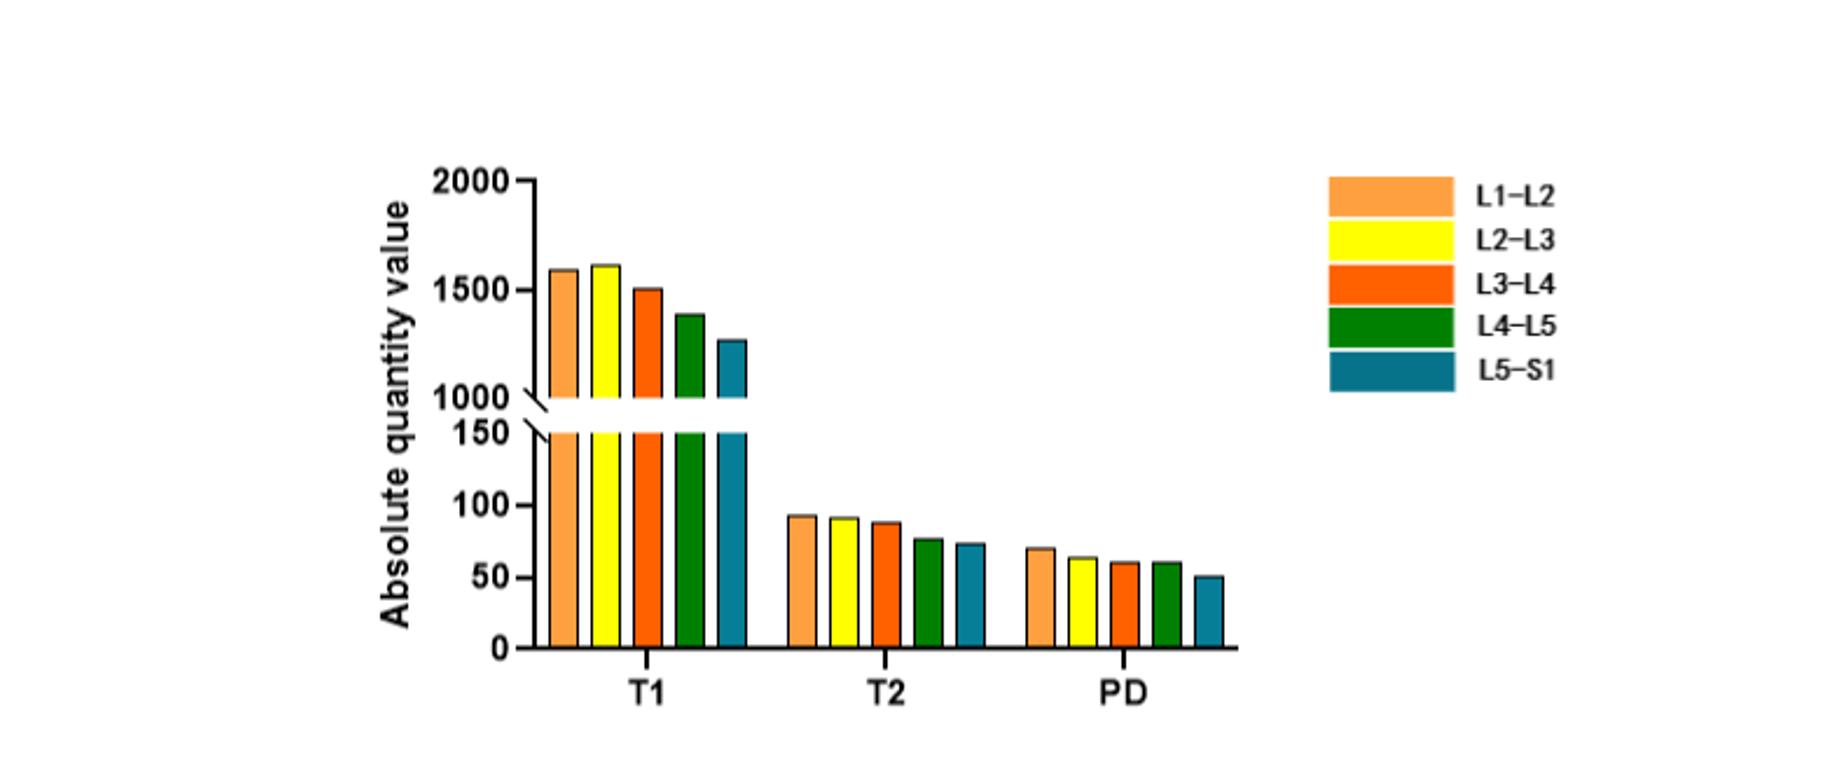
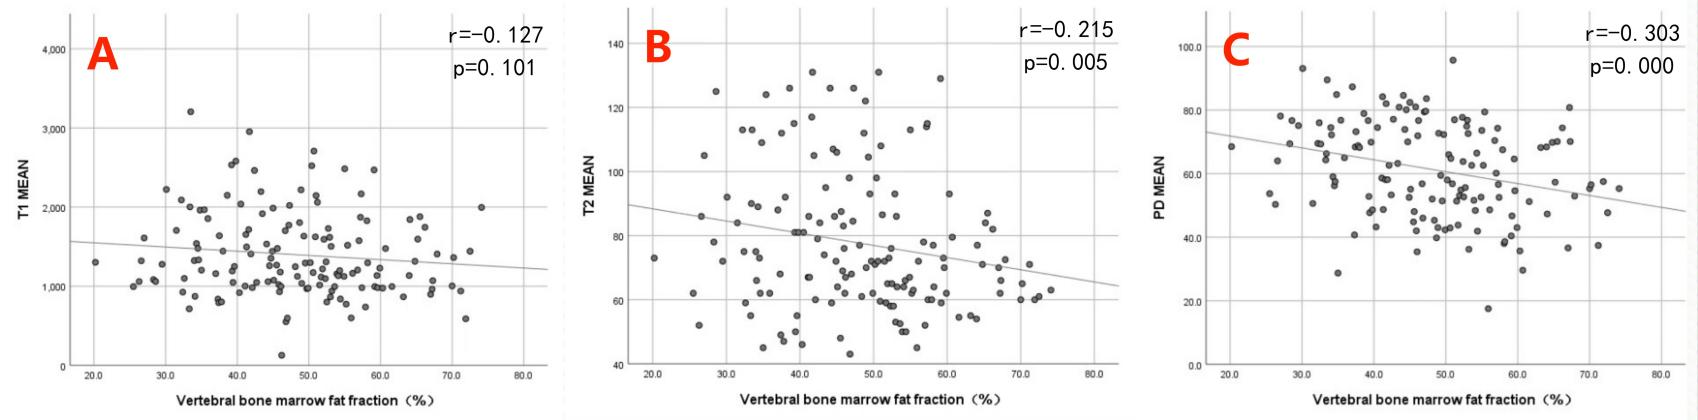
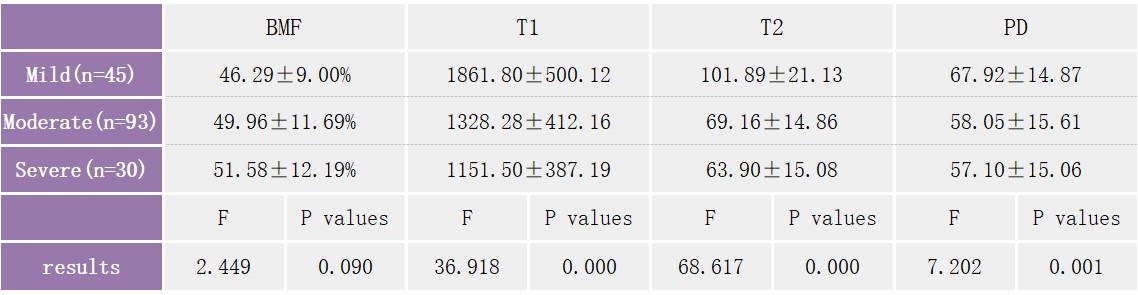
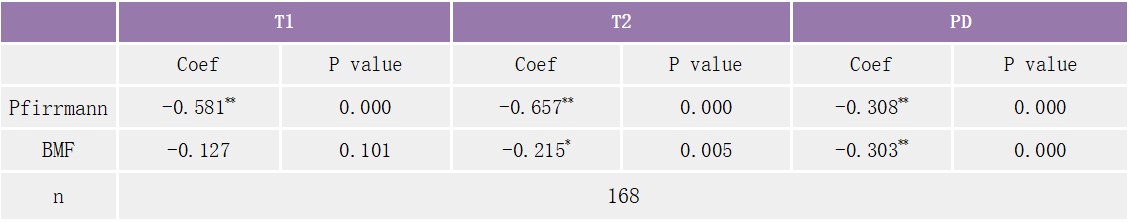
Figure 2 shows that there is variability between quantitative measurements (T1, T2, PD) values and BMF between different disc level groupings. Statistically significant differences in quantitative measurements (T1, T2, PD) and vertebral bone marrow fat fraction (BMF) were found among groups of patients with different degenerative grades at the same disc level. Table 1 shows detailed results for L4-L5 disc level. Furthermore, results indicate significant correlation between modified Pfirrmann grading and T1, T2 and PD values, with the strongest correlation between modified Pfirrmann grading and T2, followed by T1, and finally PD (T2 > T1 > PD). Table 2 lists correlation results for L4-L5 disc level. BMF demonstrates weak but significant correlation with T2 and PD values, but not with T1. Figure 3 shows the scatter plot and correlation results between BMF and T2 and PD.Discussion
Using synthetic MR technique, our study demonstrated significant difference in quantitative measurements among different IVD degenerative groups, reflecting inherent property change in the macromolecular environment, including water, protein, collagen, fat, and other solutes. High correlation between T2 value and Pfirrmann grades was in agreement with previous studies. However, relatively high correlations for the other 2 quantitative measurements, indicate that T1 and PD can provide useful complimentary information reflecting disc degeneration. The results of this study showed a significant negative correlation between disc composition changes and vertebral bone marrow fat fraction (BMF). The higher the BMF of patients with lumbar disc herniation, the lower the absolute disc biochemical component values and the more severe the degree of disc degeneration. This further confirms the existence of an interaction between the vertebral body and the intervertebral disc. This interaction may be the result of higher levels of vertebral body marrow fat negatively impacting the intervertebral disc trophic pathways. The obstruction of the nutritional pathways to the discs and the subsequent changes in the biochemical composition of the discs eventually lead to degenerative disc changes and the development of severe LDH (2). Therefore, patients with higher BMF and lower absolute disc values are more likely to develop severe lumbar disc degeneration.Conclusion
The application of quantitative MAGiC MRI techniques to measure quantitative disc values is clinically relevant, and the quantitative T1, T2 and PD correlate negatively with the degree of degenerative disc changes. Therefore, it is clinically feasible to use quantitative MRI techniques to assess degenerative disc changes.Acknowledgements
No acknowledgement found.References
1. Krug R, Joseph GB, Han M, et al. Associations between vertebral body fat fraction and intervertebral disc biochemical composition as assessed by quantitative MRI. J. Magn. Reson. Imaging 2019;50:1219–1226.
2. Bonnheim NB, Wang L, Lazar AA, et al. The contributions of cartilage endplate composition and vertebral bone marrow fat to intervertebral disc degeneration in patients with chronic low back pain. Eur. Spine J. 2022;31:1866–1872 doi: 10.1007/s00586-022-07206-x.
3. Griffith JF, Wang Y-XJ, Antonio GE, et al. Modified Pfirrmann grading system for lumbar intervertebral disc degeneration. Spine 2007;32:E708–E712.
4. Pandit P, Talbott JF, Pedoia V, Dillon W, Majumdar S. T1ρ and T2-based characterization of regional variations in intervertebral discs to detect early degenerative changes. J. Orthop. Res. 2016;34:1373–1381 doi: 10.1002/jor.23311.
5. Warntjes J b. m., Leinhard OD, West J, Lundberg P. Rapid magnetic resonance quantification on the brain: Optimization for clinical usage. Magn. Reson. Med. 2008;60:320–329 doi: 10.1002/mrm.21635.
Figures