4054
In Vivo Mapping of Muscle Fibrosis: The Influence of Signal Model Inputs1Radiology, Stanford University, Stanford, CA, United States
Synopsis
Keywords: Muscle, Aging, Fibrosis, Sarcopenia
Fibrosis could be an early sign of declining muscle quality. Short T2*-signal fraction, which can be calculated by fitting a 3-exponential model to UTE data, has been shown to be correlated with collagen content, which is related to fibrosis. However, this type of signal model has 8 fitting parameters, which could result in overfitting to a limited number of echoes. We constrained the signal model 3 different ways, and compared the resulting short T2*-signal fraction values. There were significant differences between methods, demonstrating that these choices can affect parameter values and diagnostic sensitivity of short T2*-signal fraction for fibrosis detection.Introduction
Fibrosis, characterized by increased levels of collagen in the muscle, is an early signal of declining muscle quality that could precede sarcopenia. Previous work1 demonstrated a correlation between collagen concentration and short T2*-signal fraction in a phantom study and in vivo mapping in healthy volunteers using an ultrashort echo time (UTE) sequence. Signal decay in skeletal muscle can be described by a 3-exponential model, containing the short T2* (collagen), long T2* (muscle), and the fat T2*. This model has 8 parameters that can be fit to each voxel:$$ S(t_e )= m_0 f_s e^{-t_e/t_{2s}} + m_0 (1-f_f-f_s ) e^{-t_e/t_{2l}}+m_0 f_f e^{-t_e/t_{2f} - (2πi(440+ω) t_e)/1000}+b $$
(1) $$$m_0$$$, the signal at $$$t_e=$$$0ms, (2) $$$f_s$$$, the short T2*-signal fraction, (3) $$$f_s$$$, the fat fraction, (4) $$$t_{2s}$$$, the short T2*, (5) $$$t_{2l}$$$, the long T2*, (6) $$$t_{2f}$$$, the T2* of fat, (7) $$$b$$$, the bias, and (8) $$$ω$$$, which accounts for off-resonance of fat. To avoid overfitting to a limited number of echoes, it would be ideal to constrain as many of these parameters as possible. The choice of which parameters to constrain can affect the resulting quantitative maps and their sensitivity to detecting early fibrotic changes. To address this, we studied 3 different ways to constrain parameters in the signal model and the effects of each choice on quantitative mapping of short T2*-signal fraction in the human quadriceps using a UTE sequence.
Methods
MRI images of 8 participants (age 58.5±13.9 years, 4 female, 4 male) were acquired at 3T using a General Electric Healthcare scanner and an AirCoil. A 3D UTE radial sequence was acquired at 23 echo times from 0.028 to 9.0ms in the mid-thigh. Other imaging parameters were: matrix size=128x128x8, FOV=200x200x71.8mm, TR=70ms, flip angle=5deg, acquisition time<6min. A Dixon sequence covering the whole thigh was also acquired. Imaging parameters for the Dixon sequence were: matrix size=256x256x42, FOV=450x450x252mm, TR=13.4ms, flip angle=5deg. Dixon images were acquired in 2 stacks of the upper and lower thigh, then stitched together. The Dixon images and UTE images were all registered to the 0.028ms UTE echo using an affine registration2. UTE images were denoised using a Marcenko-Pastur PCA algorithm with patch radius of 1. Three variations of the signal model above were fit to each voxel: (1) $$$t_{2l}=$$$25ms and $$$t_{2s}=$$$0.75ms, (2) $$$t_{2l}=$$$25ms and $$$t_{2f}=$$$11ms, and (3) $$$t_{2l}=$$$25ms, $$$t_{2f}=$$$11ms, and $$$f_{f,D}-0.01≤f_f≤f_{f,D}+0.01$$$ where $$$f_{f,D}$$$ is the average fat fraction measured by the Dixon sequence in the quadriceps region where the UTE sequence was acquired. Figure 1 contains a full list of parameters, initialization values, and bounds used for fitting. A repeated measures ANOVA model was fit to the average short T2*-signal fraction in the quadriceps of each subject, followed by a related measures t-test with a Bonferroni correction for multiple comparisons between groups to determine significant differences. Average fat fraction data was analyzed the same way, with the addition of Dixon fat fraction averages in the UTE ROI. Correlations between fat fraction calculated using the signal models and the Dixon sequence were determined using linear regression. A p-value<0.05 was considered significant.Results
There were significant differences between the average short T2*-signal fraction values calculated using methods 1 and 3, and methods 1 and 2 (Figure 2a). Short T2*-signal fraction values were highest for method 3 (0.22±0.45), followed by method 2 (0.17±0.05), then method 1 (0.11±0.02).There were significant differences between average fat fraction calculated using method 2 and Dixon (Figure 2b). Fat fraction was highest for method 2 (0.16±0.04), followed by method 1 (0.15±0.03), then method 3 (0.08±0.08). There were positive correlations between the fat fractions calculated using all methods and Dixon values, with R2 of 0.40, 0.39, and 0.76 for methods 1, 2, and 3, respectively (Figure 3), and p<0.001 for all methods.
Figures 4 and 5 show representative maps of short T2*-signal fraction and fat fraction for an older participant with signs of declining muscle quality including fat infiltration, and a young, healthy participant, respectively. Maps reflect the patterns in Figure 2a, with lower short T2*-signal fraction calculated using method 1. With a strict constraint on fat fraction (method 3), some areas of the quadriceps could not be fit to the signal model.
Discussion
Differences between fat fraction measured by the Dixon sequence and the signal model could indicate that the signal model is not fully capturing the behavior of the muscle being imaged. Areas of elevated short T2*-signal fraction in the older participant maps (Figure 4) compared to the younger participant (Figure 5) could indicate potential for detection of fibrotic changes associated with aging, especially when fat T2* is fixed (methods 2&3). Validation with biopsies is needed to quantitatively determine sensitivity to collagen content in vivo.Conclusion
Constraints on the signal model fitted to UTE data in skeletal muscle can affect the resulting short T2*-signal fraction values, and therefore detection of collagen content and fibrosis. Knowing which parameters in the signal model can be constrained without sacrificing diagnostic sensitivity and what biases these constraints may introduce is a step towards future studies or clinical applications where the number of echoes needs to be reduced to decrease scan time, and critical for research repeatability.Acknowledgements
This work was funded by the Wu Tsai Human Performance Alliance at Stanford University and NIH 1K99AG07173501.References
1. Araujo E, Azzabou N, Vignaud A, et al. Quantitative Ultrashort TE Imaging of the Short-T2 Components in Skeletal Muscle Using and Extended Echo-Subtraction Method. Mag. Res. Med. 2017; 78:997-1008.
2. S. Klein, M. Staring, K. Murphy, et al. elastix: a toolbox for intensity based medical image registration. IEEE Transactions on Medical Imaging. 2010; 29(1):196-205.
Figures
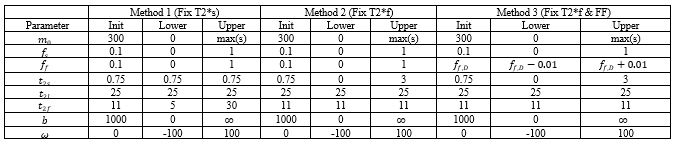
Table of initialization values and lower and upper bounds for all parameters in the signal model. max(s) is the max value of the signal in the UTE dataset being fit.
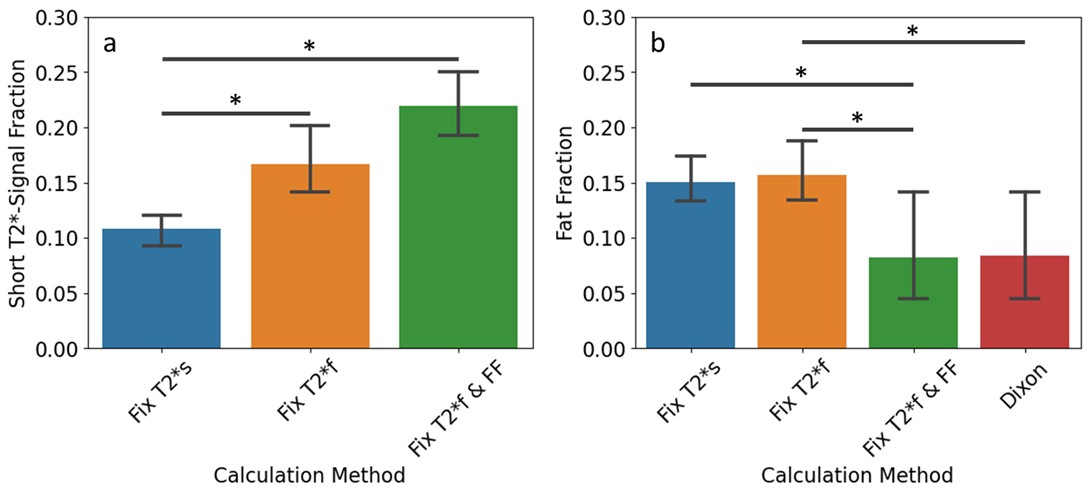
Differences in quadriceps-averaged short T2*-signal fraction (a) and fat fraction (b) by calculation method used. Fix T2*s = method 1, Fix T2*f = method 2, Fix T2*f & FF = method 3. * indicates p<0.05, bars indicate significant differences between groups.
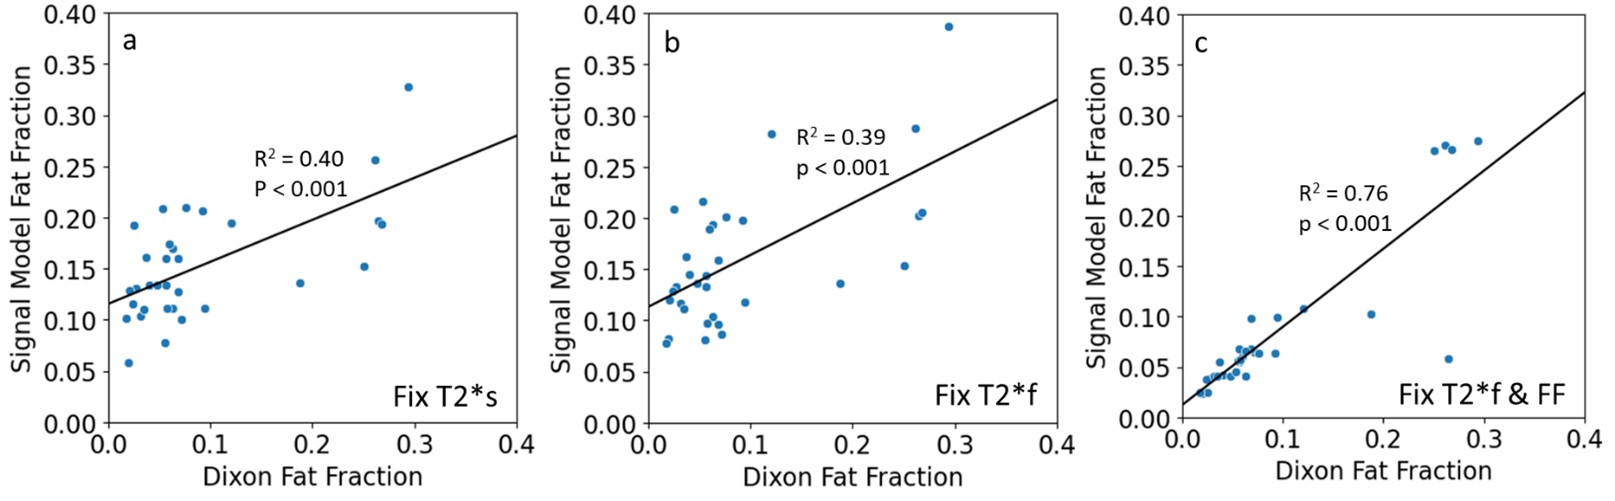
Correlation between Dixon fat fraction and fat fraction calculated using the signal model for methods (a) 1, (b) 2, and (c) 3. Each dot on the graphs represents an average value for one of the quadriceps muscles in one subject in the UTE scan ROI and registered Dixon scan ROI. There were mild positive correlations in both cases where Dixon fat fraction was not an input to the signal model (a & b).
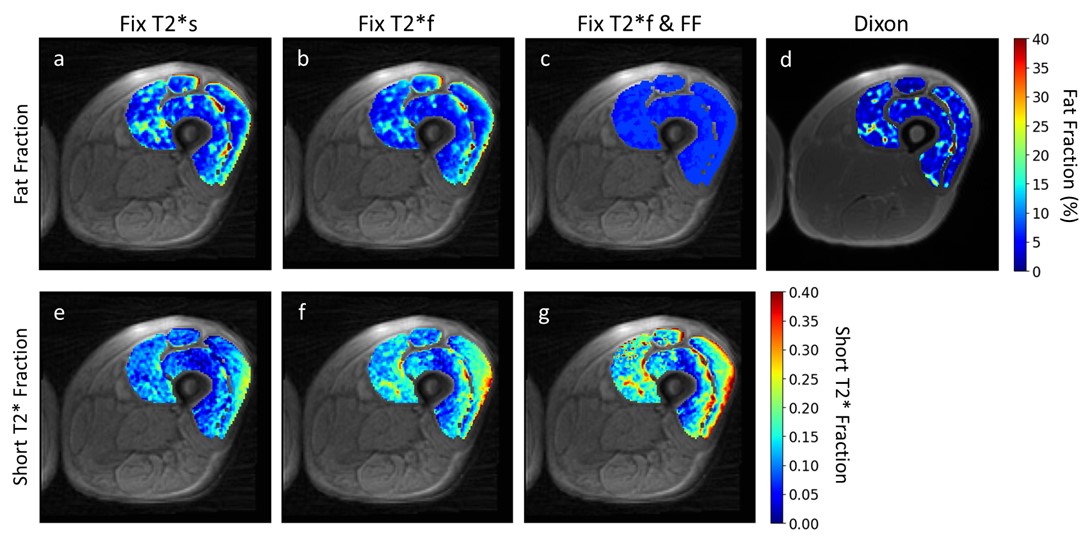
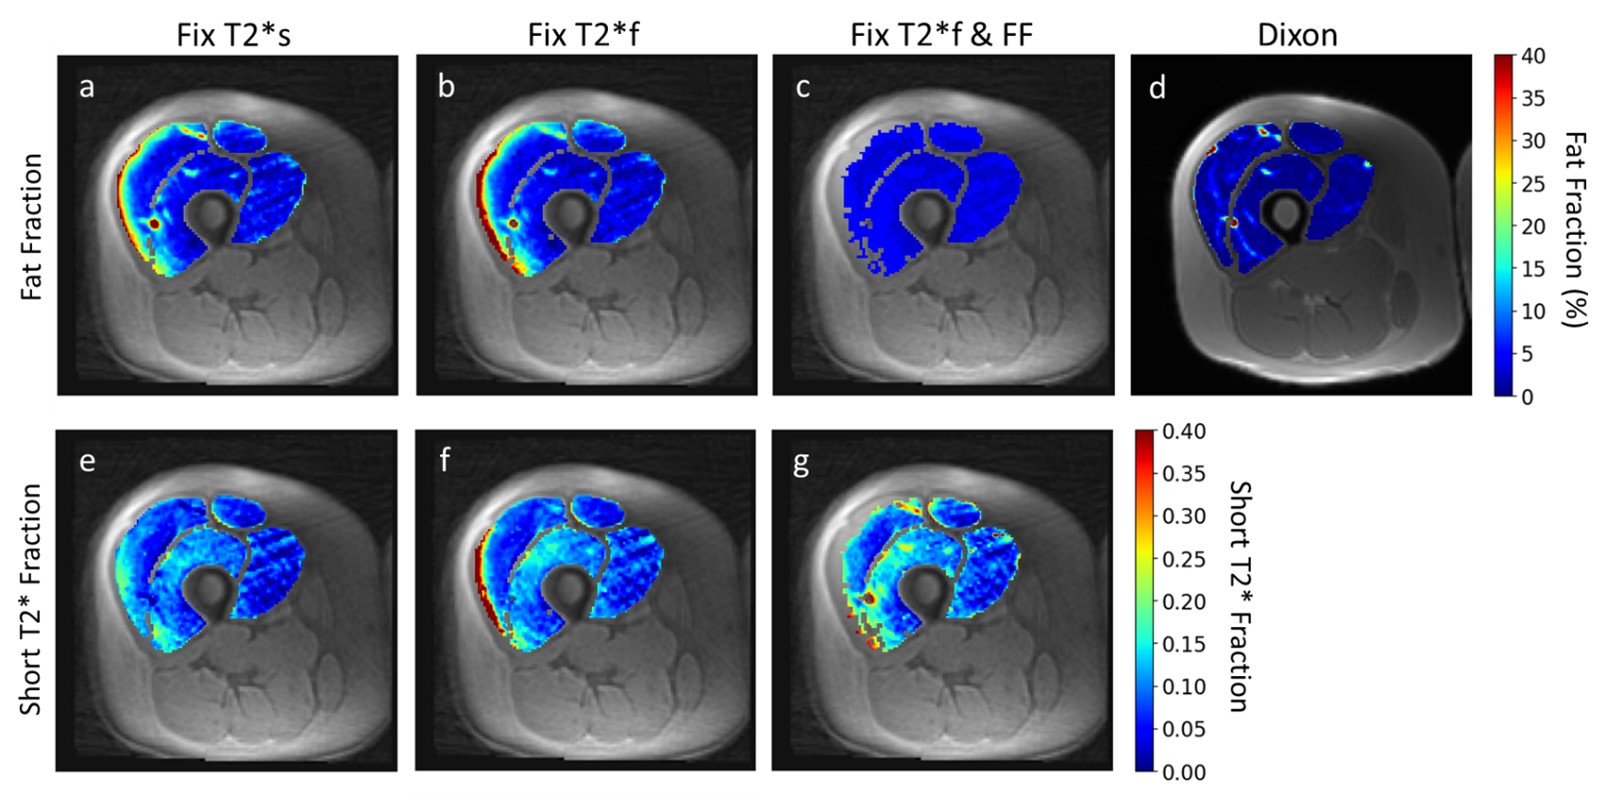
Representative short T2*-signal fraction and fat fraction maps for an older participant with signs of declining muscle quality. In this case, the Dixon map (d) shows some fatty infiltration which is not captured by the signal model when fat fraction is constrained to the quadriceps-average value (c). This could affect the resulting short T2*-fraction maps (g). The maps show elevated short T2*-signal fraction in (f) and (g) relative to (e), as seen in Figure 2a, and elevated fat fraction in (a) and (b) relative to (c) and (d), as seen in Figure 2b.
Representative short T2*-signal fraction and fat fraction maps for a younger, healthy participant. In this case, constraining fat fraction to the Dixon quadriceps-averaged value (c) resulted in the inability to fit the signal model to many voxels in the vastus lateralis (g). As with Figure 4, maps show the same relative patterns as Figure 2.