4051
Increase in Fast-relaxing Sodium After a Brief Plantarflexion Exercise Detected by Multi-Echo UTE MRI and Biexponential Regression1Biomedical Imaging Center, Beckman Institute, University of Illinois at Urbana-Champaign, Urbana, IL, United States, 2Department of Kinesiology and Community Health, University of Illinois at Urbana-Champaign, Urbana, IL, United States, 3Department of Bioengineering, University of Illinois at Urbana-Champaign, Urbana, IL, United States
Synopsis
Keywords: Muscle, Relaxometry, Sodium, Muscle, Exercise
We measured the exercise-induced change in fast and slow T2-relaxing sodium in calf muscles separately using a UTE sequence with multiple echoes. Three minutes of plantarflexion exercise resulted in an increase in the fast-relaxing sodium and no change in the slow-relaxing component. Based on the known physiology that muscle intracellular sodium increases during muscle contraction, the measured fast-relaxing sodium might represent muscle intracellular sodium. This finding is valuable in studying intra- and extracellular sodium separately.Introduction
Muscle intracellular sodium is known to be increased by the opening of sodium channels during muscle contraction [1, 2]. We wanted to measure the dynamic change in intracellular sodium by exercise in calf muscles. The separation of intracellular sodium from total sodium has been a difficult topic [3]. However, the fast- and slow-relaxing sodium can be separated by biexponential regression of multi-echo sodium images [4]. We measured dynamic changes in the fast- and slow-relaxing sodium components in the muscles engaged in ankle plantarflexion exercise. The increased sodium component can be assumed to reflect mainly the increased intracellular sodium induced by exercise.Methods
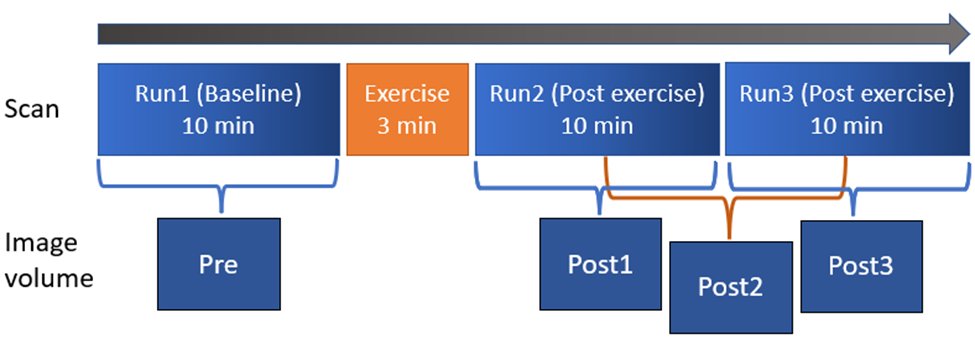
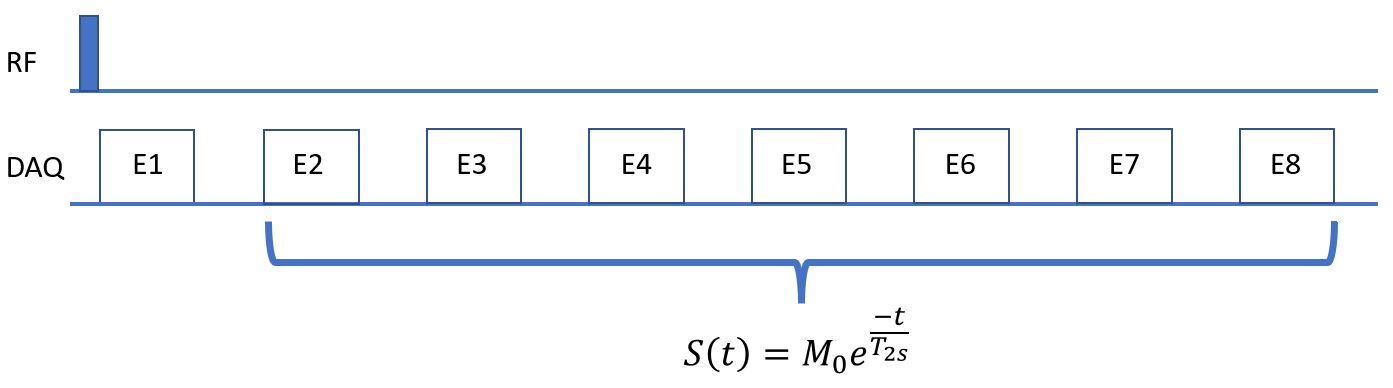
We chose ankle plantarflexion exercise that could be performed in situ [2, 5]. The subject performed the plantarflexion task with the right leg for 3 min between the baseline scan and the two post-exercise consecutive scans. Sodium MRI scanning was performed using a 3-D ultra-short TE (UTE) sequence at 3T with a custom-built sodium RF coil. The UTE sequence was a rotation-of-spiral disc (RSD) sequence that was designed for a fast sweeping of the K-space trajectory using a hybrid of radial and spiral trajectories [6]. The RSD sequence was expanded to acquire eight echoes at TE from 0.28 to 35.63 ms at an interval of 5.05 ms [4, 7]. The scan time was 604 sec for one full 3D scan. The shots for one 3D data were interleaved and divided into two groups so that the 2 post-exercise scans were reconstructed into 3 frames to double the temporal resolution of sodium dynamic change as illustrated in Fig. 1. T1-weighted water/fat proton images were also obtained using flexible array coils and served as an anatomic reference for muscle segmentation. The slow T2 relaxation time, T2s, was first estimated by a mono-exponential T2 relaxation model from the seven echo signals excluding the 1st echo of averaged sodium images of the 3 runs to maximize the signal-to-noise ratio as illustrated in Fig. 2. Using the estimated T2s, other parameters of the bi-exponential regression model denoted by Eq [1] was estimated using Matlab’s lsqcurvefit function: S = Mf*exp(-TE/T2f) + Ms*exp(-TE/T2s), (1)where S is the total sodium signal, Mf and Ms denote the fast and -relaxing sodium component, respectively. We recruited ten healthy participants (5 female, mean age: 27) to participate in this study with IRB approval.
Results
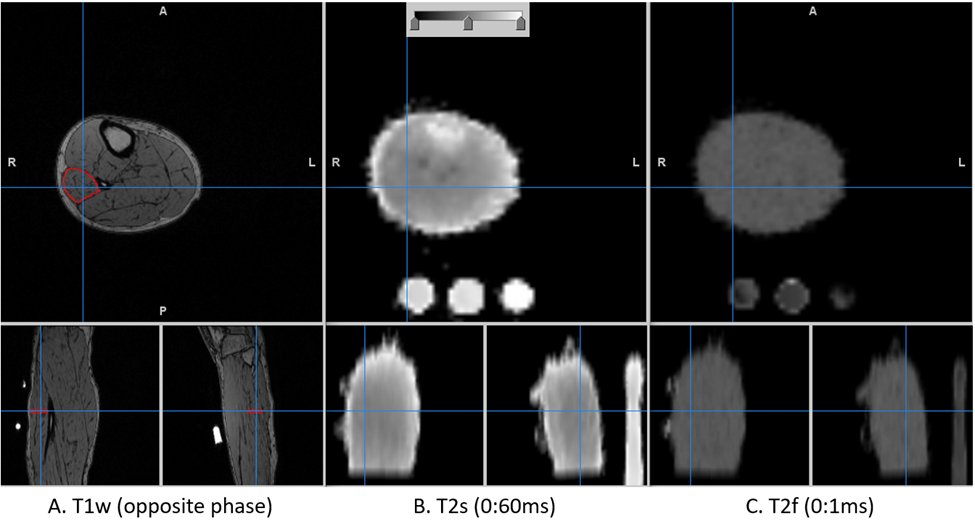
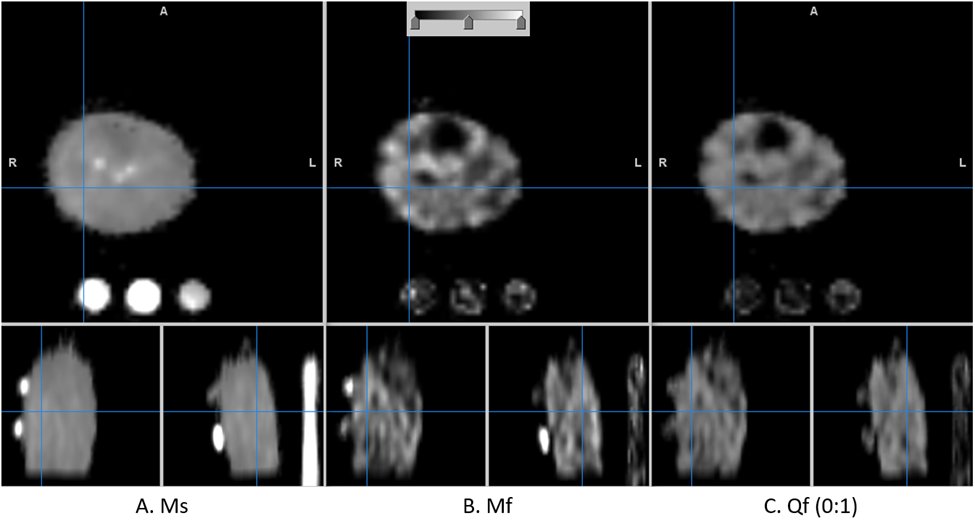
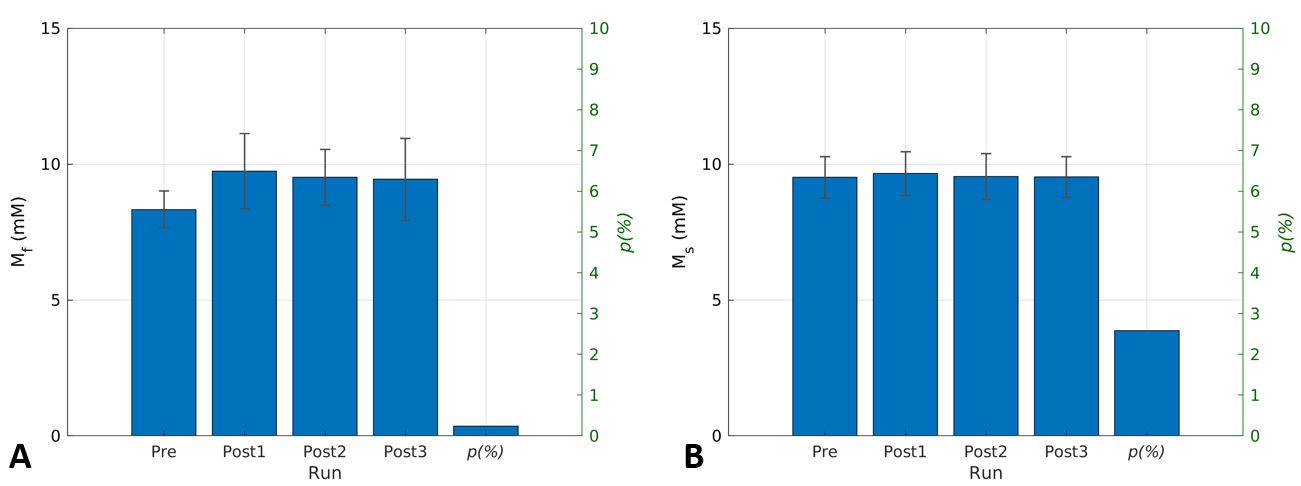
The T1w anatomy image of one participant is shown in Fig. 3 in which estimated T2s and T2f maps are also shown. The corresponding Ms, Mf, and the fraction of Mf over the total sodium are shown in Fig. 4.. The dynamic change in Mf and Ms from the entire subject group is shown in Fig. 5. As shown in Fig. 5, the fast relaxing component of sodium, i.e., Mf, was increased by the exercise, while Ms remained unchanged. The statistics of parameters in Eq. [1] for the entire subject group at baseline were (mean ± SD): T2s=26.7±2.24 ms, T2f=0.35±0.01ms, Ms=9.51±0.76 mM, Mf=8.33±0.68 mM, and Qf=0.44±0.02.Discussion
T2f of 0.35 ms was shorter than the reported values between 0.46 and 2.2 ms [8-10]. This might be attributed to the regression strategy of estimating T2s as mono-exponential T2 relaxation from the last 7 echoes of longer TE. A limitation of our estimation was the long echo interval of 5.05 ms. Another finding was that the observed fraction of Mf was 0.44, which was lower than the theoretical fraction of 0.6. This can be attributed to extracellular sodium with T2s in the same voxel. The most important finding of this study was that when comparing timepoint Post1 to Pre, there was an increase in Mf but no change in Ms. Considering the well-known phenomenon that muscle intracellular sodium is increased by muscle contraction, this finding suggests that the Mf measured herein represents the intracellular sodium in muscle. Ms, on the other hand, did not change from Pre to Post1 and most likely represents muscle extracellular sodium, which is thought to behave like saline solution [5]. Interestingly, in another study where we examined the effect of a low-sodium diet on muscle sodium in dialysis patients, we observed a lower range of T2f that was similar to that found in this study, and a decrease in Ms across all muscles assessed [11]. We anticipate that the multi-echo UTE sequence and the bi-exponential regression technique that we applied in this study will together open new ways to understand sodium regulation in humans.Conclusion
The biexponential relaxation of sodium was reliably analyzed by estimating T2s first as a mono-exponential T2 relaxation from echoes of longer TE. Based on the expected increase in muscle intracellular sodium induced by muscle contraction, we found that the increased fast-relaxing component of muscle sodium observed post-exercise can be indicative of increased muscle intracellular sodium.Acknowledgements
No acknowledgement found.References
1. Kuo, I.Y. and B.E. Ehrlich, Signaling in muscle contraction. Cold Spring Harb Perspect Biol, 2015. 7(2): p. a006023.
2. Bansal, N., et al., Effect of exercise on (23)Na MRI and relaxation characteristics of the human calf muscle. J Magn Reson Imaging, 2000. 11(5): p. 532-8.
3. Burstein, D. and C.S. Springer, Jr., Sodium MRI revisited. Magn Reson Med, 2019. 82(2): p. 521-524.
4. Blunck, Y., et al., 3D-multi-echo radial imaging of (23) Na (3D-MERINA) for time-efficient multi-parameter tissue compartment mapping. Magn Reson Med, 2018. 79(4): p. 1950-1961.
5. Constantinides, C.D., et al., Human skeletal muscle: sodium MR imaging and quantification-potential applications in exercise and disease. Radiology, 2000. 216(2): p. 559-68.
6. Jung, K.-J. and B. Sutton. Three-dimensional sodium MRI using a rotation of spiral disc (RSD) trajectory. in Int Soc Magn Reson Med. 2021.
7. Jung, K.-J., et al. Separation of Intra- and Extra-cellular Sodium Using A Rotation of Spiral Disc (RSD) Sequence with Multiple Echoes. in Int Soc Mag reson Med. 2022. London, UK.
8. Gerlach, D.A., et al., Atrophy of calf muscles by unloading results in an increase of tissue sodium concentration and fat fraction decrease: a (23)Na MRI physiology study. Eur J Appl Physiol, 2017. 117(8): p. 1585-1595.
9. Alhulail, A.A., et al., Fast in vivo (23) Na imaging and T 2 * mapping using accelerated 2D-FID UTE magnetic resonance spectroscopic imaging at 3 T: Proof of concept and reliability study. Magn Reson Med, 2021. 85(4): p. 1783-1794.
10. Cope, F.W., Spin-echo nuclear magnetic resonance evidence for complexing of sodium ions in muscle, brain, and kidney. Biophys J, 1970. 10(9): p. 843-58.
11. Fang, H.-Y., et al., Muscle Sodium (Na+) Reduction by 2-Month Low-Na+ Diet in Hemodialysis (HD) Patients, in American Society of Nephrology. 2022. p. SA-PO360.
Figures