4047
Impact of Deep Learning-Based MR Image Reconstruction Algorithms on Abdominal MRI Radiomic Features1Cincinnati Children's Hospital Medical Center, Cincinnati, OH, United States
Synopsis
Keywords: Image Reconstruction, Machine Learning/Artificial Intelligence, deep learning reconstruction
Deep learning (DL)-based techniques are increasingly being applied to assist with or improve image reconstruction. However, the impact of DL-based algorithms on radiomics is not well understood. This study aims to evaluate the impact of two commercially available DL-based reconstruction pipelines: (1) SmartSpeed (Philips Healthcare, U.S. FDA-cleared); and (2) SmartSpeed with Super Resolution (SmartSpeed+SuperRes, not U.S. FDA-cleared to date) on MRI radiomic features. Our analysis showed that compared to conventional image reconstruction technique, 42 out of 86 investigated radiomic features from SmartSpeed images were highly correlated whereas only 13 features from SmartSpeed+SuperRes images had high correlations with conventional image features.Introduction
Magnetic resonance imaging (MRI) radiomics is a process that extracts and analyzes high-throughput features (e.g., tissue/organ morphology, gray-scale signal intensity distribution, and tissue texture) from MRI data to aid various diagnostic applications [1-3]. Parallel imaging techniques are routinely used clinically to reduce imaging time [4]. Compressed sensing, including compressed sensitivity encoding (C-SENSE, Philips Healthcare), further accelerates the acquisition [5]. Deep learning (DL)-based image reconstruction algorithms have been used to reconstruct MR images [6-8]. Both U.S. FDA-cleared (AIR Recon DL, GE Healthcare; SmartSpeed, Philips Healthcare) and emerging, yet-to-be-cleared algorithms exist. Most recently, a DL-based Super Resolution approach was introduced by Philips Healthcare to enhance MRI images [9]. Such DL-based image reconstruction techniques allow either the more rapid acquisition of MR data and/or improved image quality while remaining relatively time neutral.To date, the impact of DL-based image reconstruction algorithms on MRI radiomic features is not well understood. The objective of this study is to evaluate the impact of two DL-based image reconstruction pipelines, (1) SmartSpeed (Philips Healthcare); and (2) SmartSpeed with Super Resolution (SmartSpeed+SuperRes; Philips Healthcare), on MRI radiomics compared to the commercially available C-SENSE technique.
Methods
MRI dataData were collected as part of an institutional review board-approved study, and participant written informed consent was obtained. Respiratory triggered coronal T2-weighted single-shot fast spin echo (SSFSE) imaging of the abdomen was performed using a 1.5T MRI scanner (Ingenia; Philips Healthcare) with a dedicated 28 element torso coil and a respiratory bellows placed over lower chest. Imaging parameters were: voxel size 1.3 × 1.6 × 5.0 mm, C-SENSE acceleration factor=6, and TE=80 ms. Acquired data were reconstructed in real-time on the scanner console with spatial resolution of 0.8 × 0.8 × 5.0 mm. Delayed reconstructions were performed on the same scanner console with the same raw data, coil sensitivity, and noise information using “work in progress” DL algorithms: (1) SmartSpeed [10, 11] with spatial resolution of 0.8 × 0. 8 ×5.0 mm; and 2) SmartSpeed+SuperRes with spatial resolution of 0.6 × 0.6 × 5.0 mm.
Regions of Interest (ROIs) Segmentation
A research assistant supervised by a fellowship-trained pediatric radiologist manually placed eight two-dimensional (2D) circular ROIs (with a diameter of 25.5mm) on the conventionally reconstructed MR images, including 1) an ROI encompassing the entirety of the liver at the level of the porta hepatis ("Whole liver"); 2) a circular ROI in the liver in an area devoid of vessels and bile ducts (“Liver”); 3) circular ROI in the mid spleen ("Spleen"); 4) circular ROI in the mid left kidney ("Kidney"); 5) circular ROI in the head of the pancreas ("Pancreas head"); 6) circular ROI in the tail of the pancreas ("Pancreas tail"); 7) circular ROI in the fat of the thigh ("Fat"); and 8) circular ROI in the psoas muscle ("Muscle"). Circular ROIs were placed in a similar location in each organ/tissue for each participant. For each participant, ROI masks were copied from the conventionally reconstructed images to the DL-based reconstructed images. Segmentations were created using 3D Slicer (version 4.11).
MRI radiomic data and analysis
For each ROI and each reconstruction, we applied PyRadiomics (version 3.0.1) pipeline to extract 86 radiomic features, including 18 first-order histogram features of signal intensity distribution, 14 features from the gray-level dependence matrix, 22 features from the gray-level co-occurrence matrix, 16 features from the gray-level run-length matrix, and 16 features from the gray-level size zone matrix. We calculated Pearson’s correlation coefficients (r) between the same radiomic features extracted from DL-based pipeline reconstructed and conventionally reconstructed images for each ROI. Next, we calculated the cross-ROI mean of correlation coefficients and counted the number of radiomic features with a mean correlation r ≥0.8 (high correlation), 0.4≤r<0.8 (moderate correlation), and r<0.4 (weak correlation). The ANOVA test was used to compare the means of correlations among eight ROIs.
Results
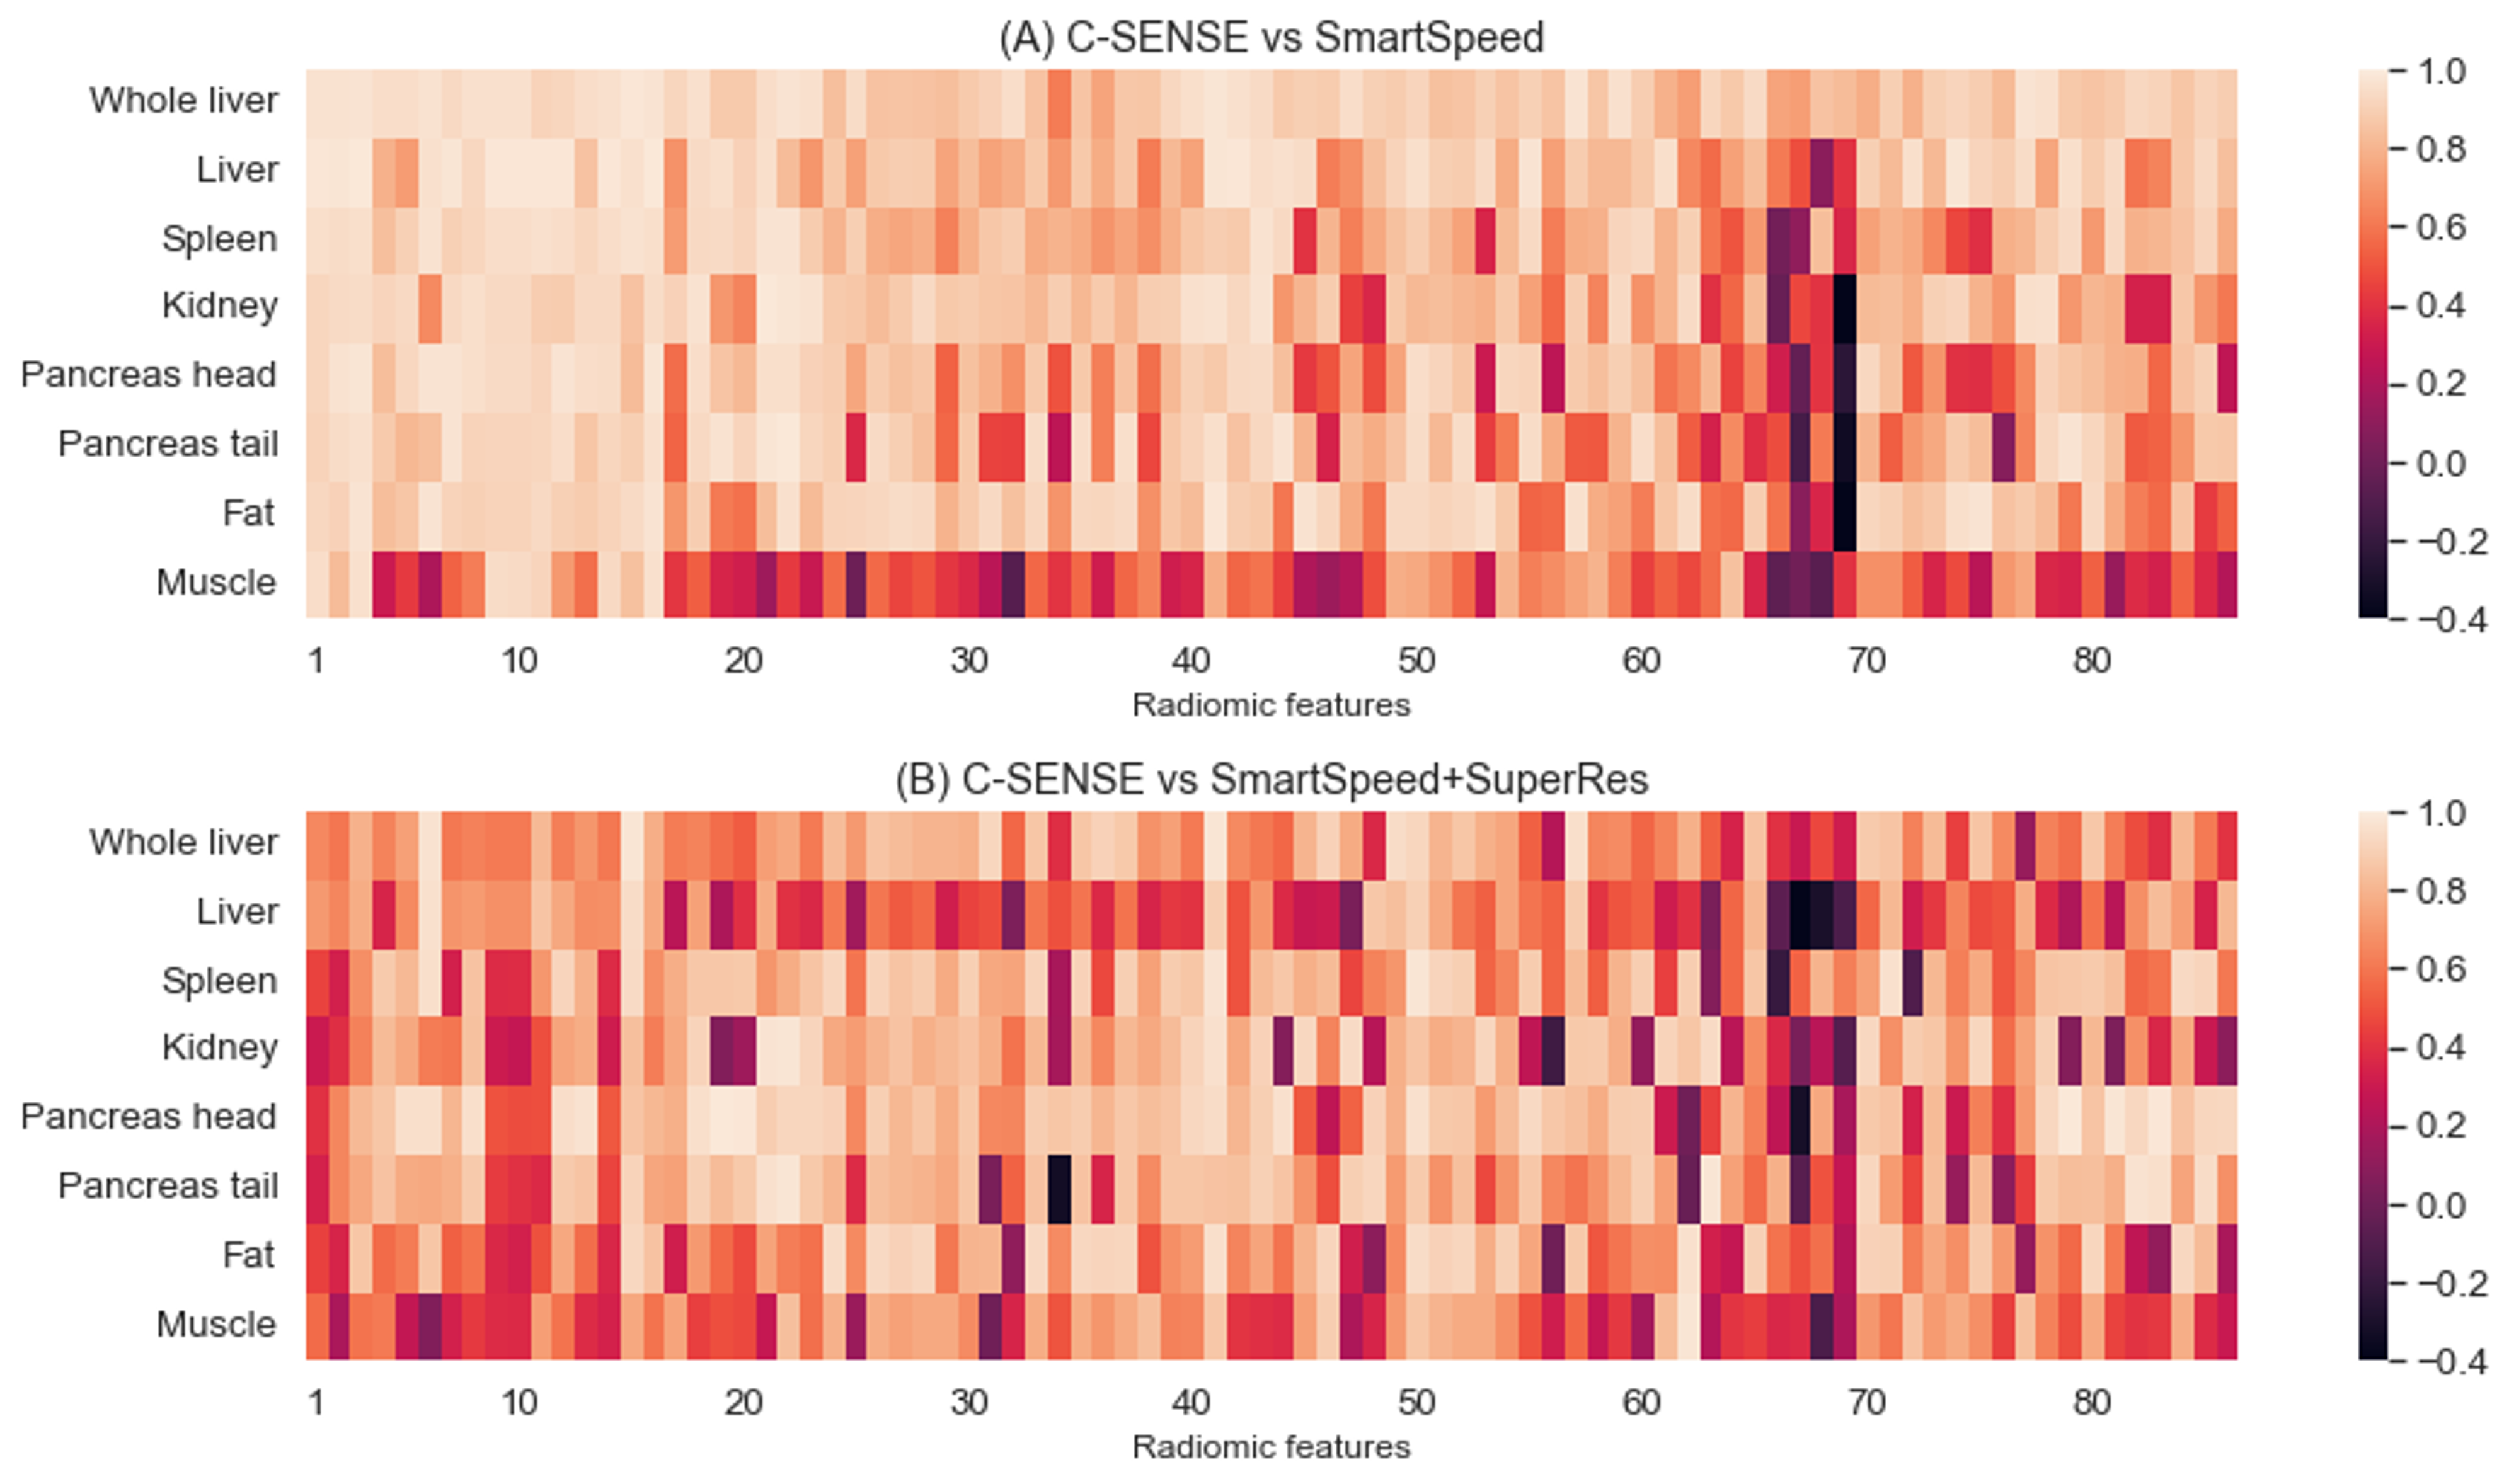
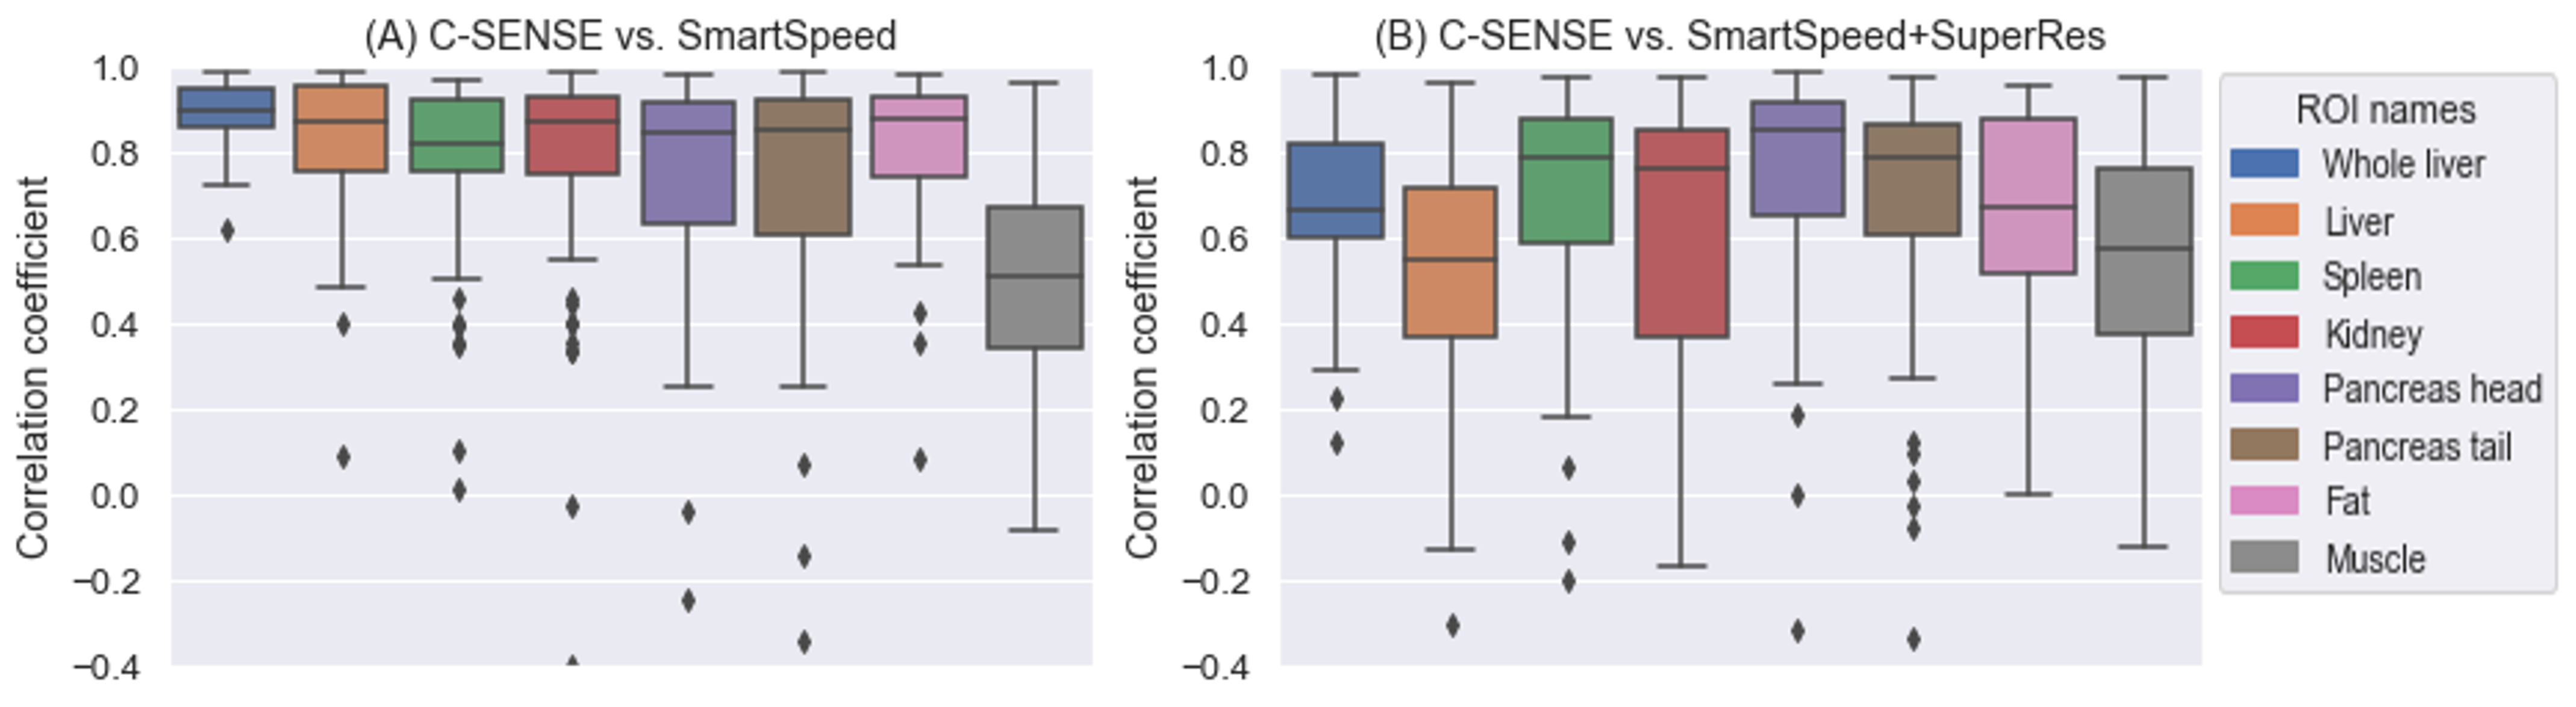
Thirteen participants age 9-25 years (mean age: 18.4 years; 5 males) were included. Figure 1 displays the correlation heatmaps for the radiomic features across reconstructions. For conventional vs. SmartSpeed, 42 radiomic features were in the high correlation group, 41 in the moderate group, and 3 in the low correlation group. For conventional vs SmartSpeed+SuperRes, there were 13 features in the high correlation group, 67 in the moderate group, and 6 the low correlation group. Low correlation radiomic features common between two DL algorithms were: Normalized Size-Zone Non-Uniformity, Small Area Emphasis, and Small Area Low Gray Level Emphasis, all from the Gray-Level Size Zone Matrix.There were significant differences in the strength of correlation among different ROI locations. For conventional vs. SmartSpeed, ANOVA p-value was < 0.001 with psoas muscle ROIs having the lowest mean correlation of 0.49. For conventional vs. SmartSpeed+SuperRes, ANOVA p-value was < 0.001 with the circular liver ROI having the lowest mean correlation of 0.52, followed by psoas muscle with a mean correlation of 0.54. Boxplots for all correlation coefficients by ROI are shown in Figure 2.
Discussion and Conclusion
DL-based MR image reconstruction algorithms variably impact MRI radiomic features when compared to conventional image reconstruction. While additional research is needed, we hypothesize that machine learning algorithms may be considerably adversely impacted by novel image reconstruction methods, potentially causing a loss of performance.Acknowledgements
This work was supported by Cincinnati Children’s Artificial Intelligence Imaging Research (CAIIR) Center, Academic and Research Committee (ARC) Awards of Cincinnati Children's Hospital Medical Center; the National Institutes of Health [R01-EB030582, R01-EB029944]; The funders played no role in the design, analysis, or presentation of the findings.References
1. Gillies, R.J., P.E. Kinahan, and H. Hricak, Radiomics: Images Are More than Pictures, They Are Data. Radiology, 2016. 278(2): p. 563-77.
2. Van Griethuysen, J.J., et al., Computational radiomics system to decode the radiographic phenotype. Cancer research, 2017. 77(21): p. e104-e107.
3. Lambin, P., et al., Radiomics: extracting more information from medical images using advanced feature analysis. Eur J Cancer, 2012. 48(4): p. 441-6.
4. Deshmane, A., et al., Parallel MR imaging. J Magn Reson Imaging, 2012. 36(1): p. 55-72.
5. Kocaoglu, M., et al., Breath-hold and free-breathing quantitative assessment of biventricular volume and function using compressed SENSE: a clinical validation in children and young adults. Journal of Cardiovascular Magnetic Resonance, 2020. 22(1): p. 54.
6. Küstner, T., et al., CINENet: deep learning-based 3D cardiac CINE MRI reconstruction with multi-coil complex-valued 4D spatio-temporal convolutions. Scientific Reports, 2020. 10(1): p. 13710.
7. Sandino, C.M., et al., Accelerating cardiac cine MRI using a deep learning-based ESPIRiT reconstruction. Magn Reson Med, 2021. 85(1): p. 152-167.
8. Zucker, E.J., et al., Free-breathing Accelerated Cardiac MRI Using Deep Learning: Validation in Children and Young Adults. Radiology, 2021. 300(3): p. 539-548.
9. Masutani, E.M., N. Bahrami, and A. Hsiao, Deep Learning Single-Frame and Multiframe Super-Resolution for Cardiac MRI. Radiology, 2020. 295(3): p. 552-561.
10. Pezzotti, N., et al., Adaptive-CS-Net: FastMRI with Adaptive Intelligence. 2019.
11. Pezzotti, N., et al., An Adaptive Intelligence Algorithm for Undersampled Knee MRI Reconstruction. IEEE Access, 2020. 8: p. 204825-204838.
Figures