4029
Development of a quantitative BOLD phantom for validation of acquisition strategies.1School of Life Sciences, University of Nottingham, Nottingham, United Kingdom, 2Radiology Department, Taif University, Taif, Saudi Arabia, 3Medical Physics and Clinical Engineering, Nottingham University Hospitals NHS Trust, Nottingham, United Kingdom
Synopsis
Keywords: Relaxometry, Phantoms
A phantom to produce R2' (reversible transverse relaxation rate) contrast was developed by inducing subvoxel magnetic susceptibility variations that mimic the quantitative Blood Oxygenation Level Dependant (qBOLD) MRI signal. Microscopic glass bubbles were used for this purpose and offer a cheaper option for making large volume phantoms than existing phantoms that use precision polystyrene microspheres. A linear relationship between R2' and the glass bubble volume fraction was found. Comparisons of multiparametric qBOLD acquisitions between two MR vendors were also made. In the future, phantoms such as this could facilitate quality assurance for qBOLD acquisition strategies and assist with multicentre harmonization.Introduction
Quantitative BOLD (qBOLD) aims to estimate the oxygen extraction fraction (OEF) from the reversible transverse relaxation rate R2'. This has applications in the diagnosis of cerebrovascular diseases such as stroke(1) and glioma(2). R2' can be measured in multiple ways but these measurements may not be equivalent. Multiparametric techniques(3) measure the irreversible transverse relaxation rate R2 and R2* (=R2+R2') independently before calculating R2'. However, there are multiple sequences used to make these measurements, particularly across vendors. Phantom measurements have the advantages of providing unchanging values for parameters. To produce R2' contrast in a phantom, microscopic magnetic susceptibility variations at the scale of the microvasculature (subvoxel level) need to be achieved. Previous work used precision polystyrene microspheres(4) to prove the concept of inducing microscopic susceptibility variation in a phantom. However, polystyrene microspheres are expensive allowing only small volume phantoms. In this study we identified glass bubbles as a cheaper alternative (glass bubbles median diameter 60mM). Therefore, the aim of this study is to produce a phantom to facilitate quality assurance and to assist with multicentre harmonization.Methods
Phantom ReproducibilityThis stage aimed to evaluate the reproducibility of phantom construction and the repeatability of MRI measurements.
Phantom construction: Four 30ml vials were filled with hydroxyethyl cellulose (HEC) gel and 0, 1, 2, and 3% volume fractions of K20 glass bubbles (3M, MN, USA). The gel was stirred with a magnetic stirrer at room temperature until it thickened (10-40mins). Two sets of vials were produced (set A and set B) to test construction reproducibility.
MRI data acquisition: Images were acquired on a 3T Achieva (Philips Healthcare, Best, The Netherlands) from both sets of vials and repeated for set A (set C). This consisted of single spin echo turbo spin echo (TSE) (TE=9, 12, 15, 20, 30, 40, 50, 100, 150 ms, TR=3000 ms) and multi-echo gradient echo (mGRE) (20 echoes, TE1=6ms, DTE=5ms, TR=500ms). Both sequences were acquired in a single slice with a resolution of 2x2x3mm.
Sequence Comparison
This stage aimed to produce a phantom that would match the expected R2' values in the human brain to enable the comparison of rapid clinical protocols with a reference data set.
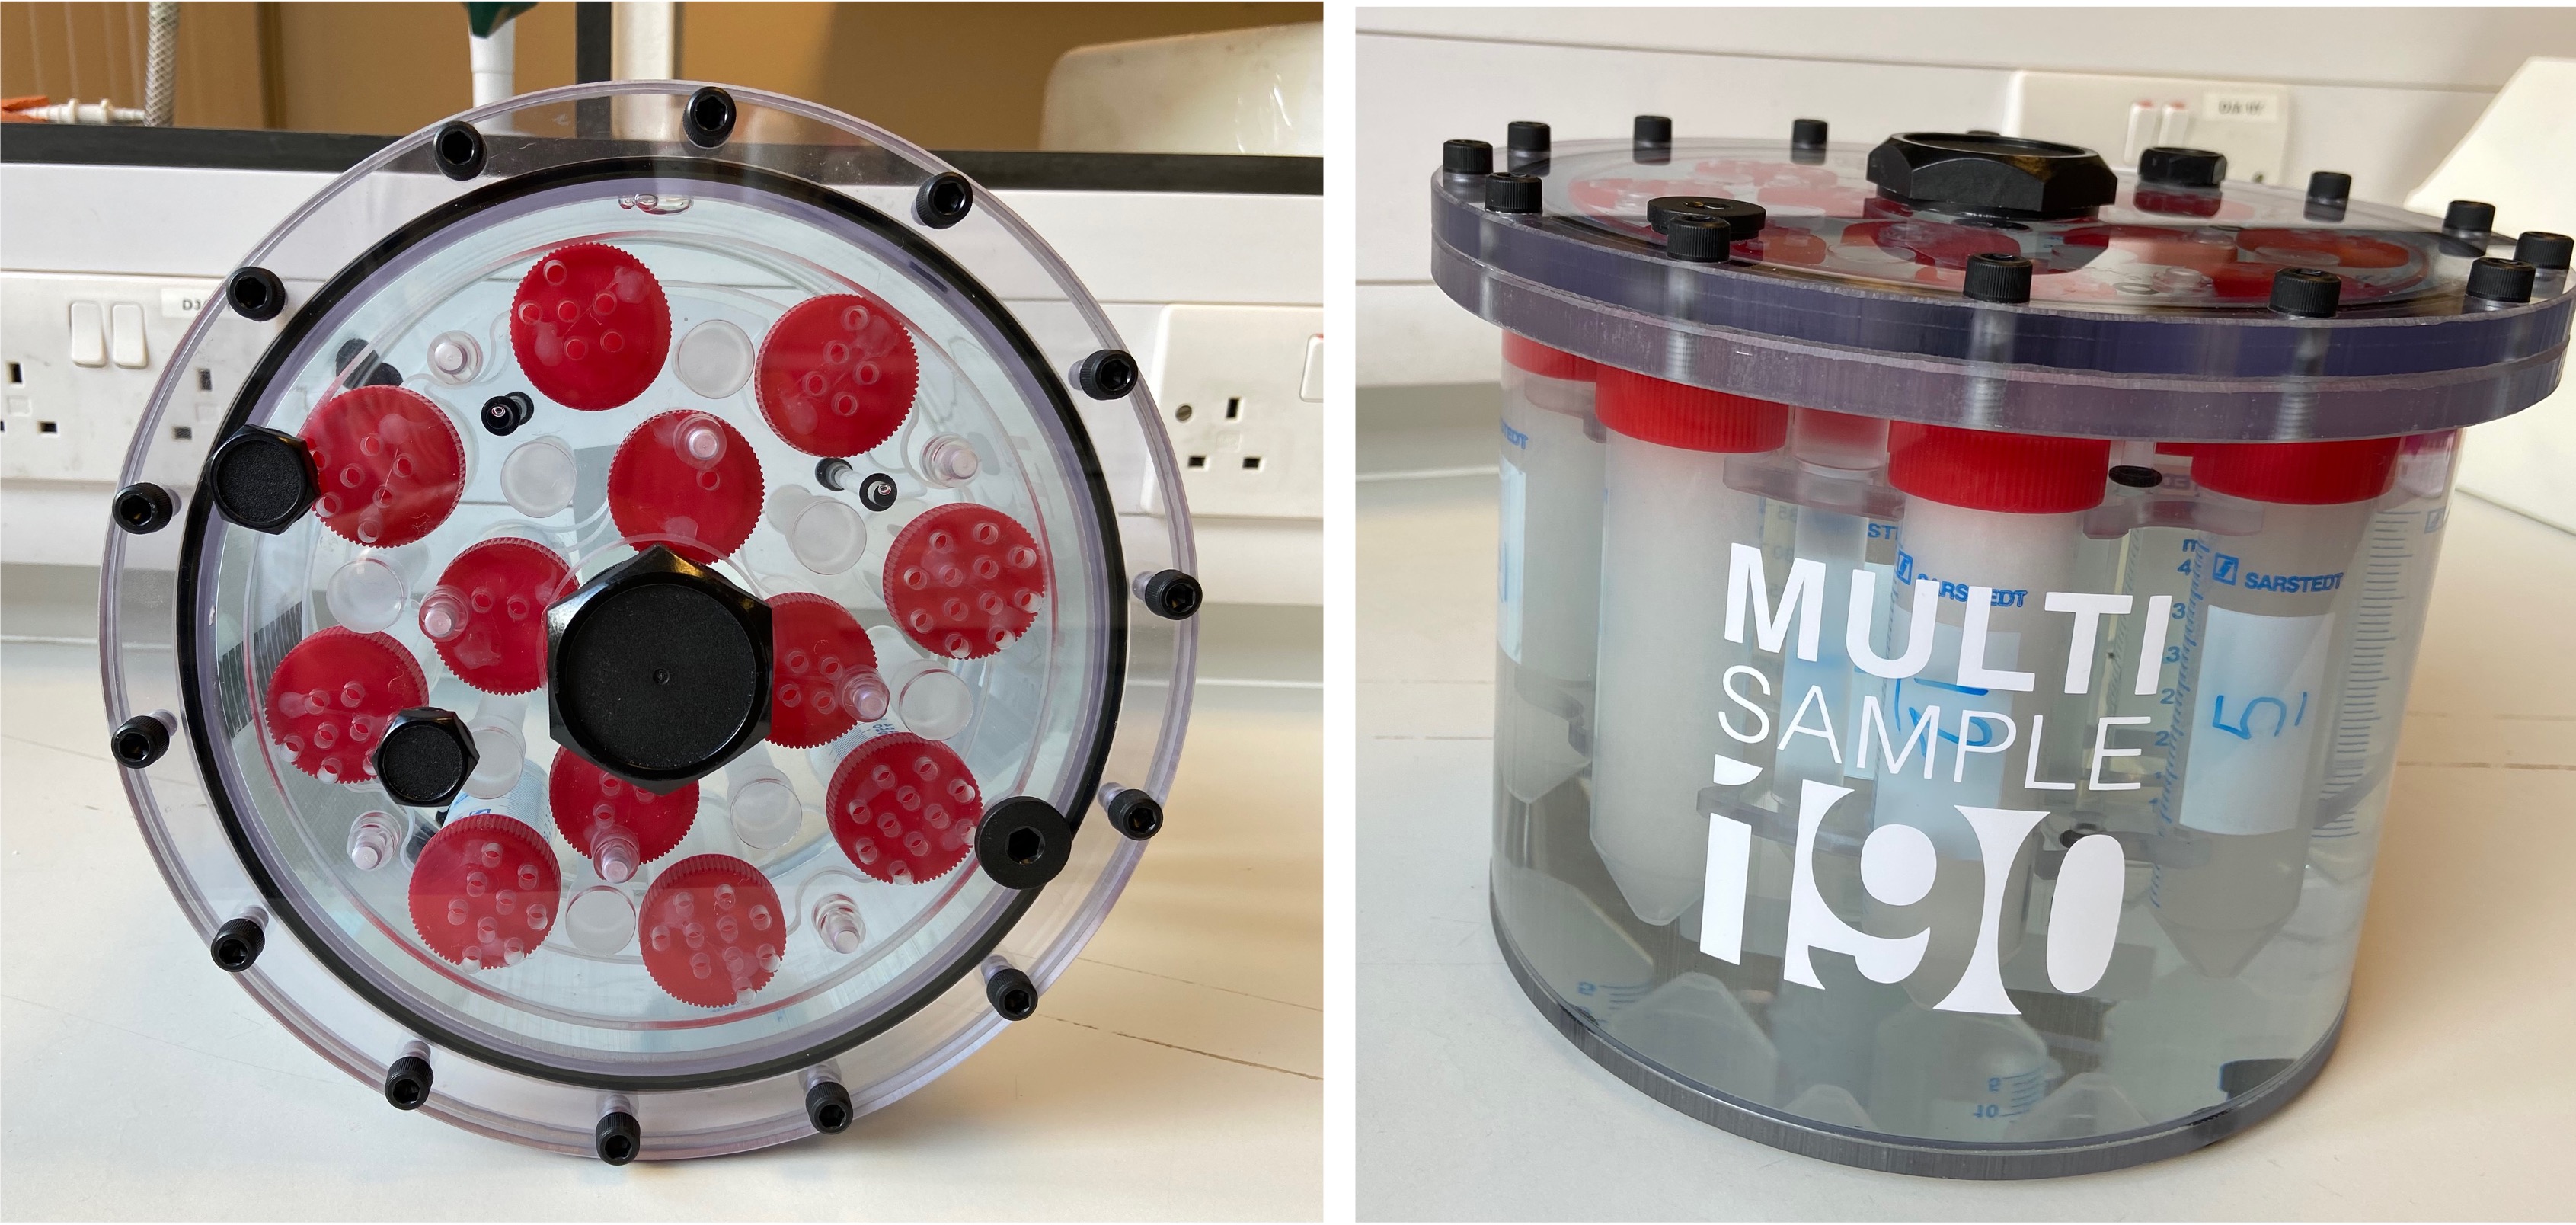
Phantom construction: A MultiSample 190F (Gold Standard Phantoms, Rochester, UK) was filled with twelve 50ml vials containing HEC and a range of volume fractions (0 to 1 % in steps of 0.1% and 2%) following the procedure above. The remainder of the phantom was filled with deionized water, Nickel Chloride (1mM) and Sodium Chloride (0.5%) (Fig.1).
MRI data acquisition: A reference data set was acquired using the same protocol as above on a 3T Achieva. In addition, the same mGRE sequence was acquired but with 30 slices and TR=1950ms and a 3D-GRASE multiple echo spin echo sequence (16 echoes, TE1=10, DTE=10, TR= 486ms, 2x2x3mm, 30 slices)(5). A similar protocol was also performed on a 3T SIGNA Premier (GE Healthcare, Waukesha, WI) consisting of an mGRE (16 echoes, TE1= 3.12, DTE=2.7, TR=1950) and a multiple echo spin echo (T2MAP) (8 echoes, TE1=5.5ms, DTE =5.5ms, TR= 1200ms). Both sequences had 30 slices and a resolution of 2x2x3mm.
Image analysis: Analysis was performed using custom Matlab scripts, assuming mono-exponential decay and fitting a log-linear model. For TSE the first 3 echoes were disregarded from the analysis due to instability in the signal decay and for the Philips mGRE data only the first 10 echoes were used to avoid the noise floor. All echoes were used for the Philips 3D-GRASE and GE data.
Results
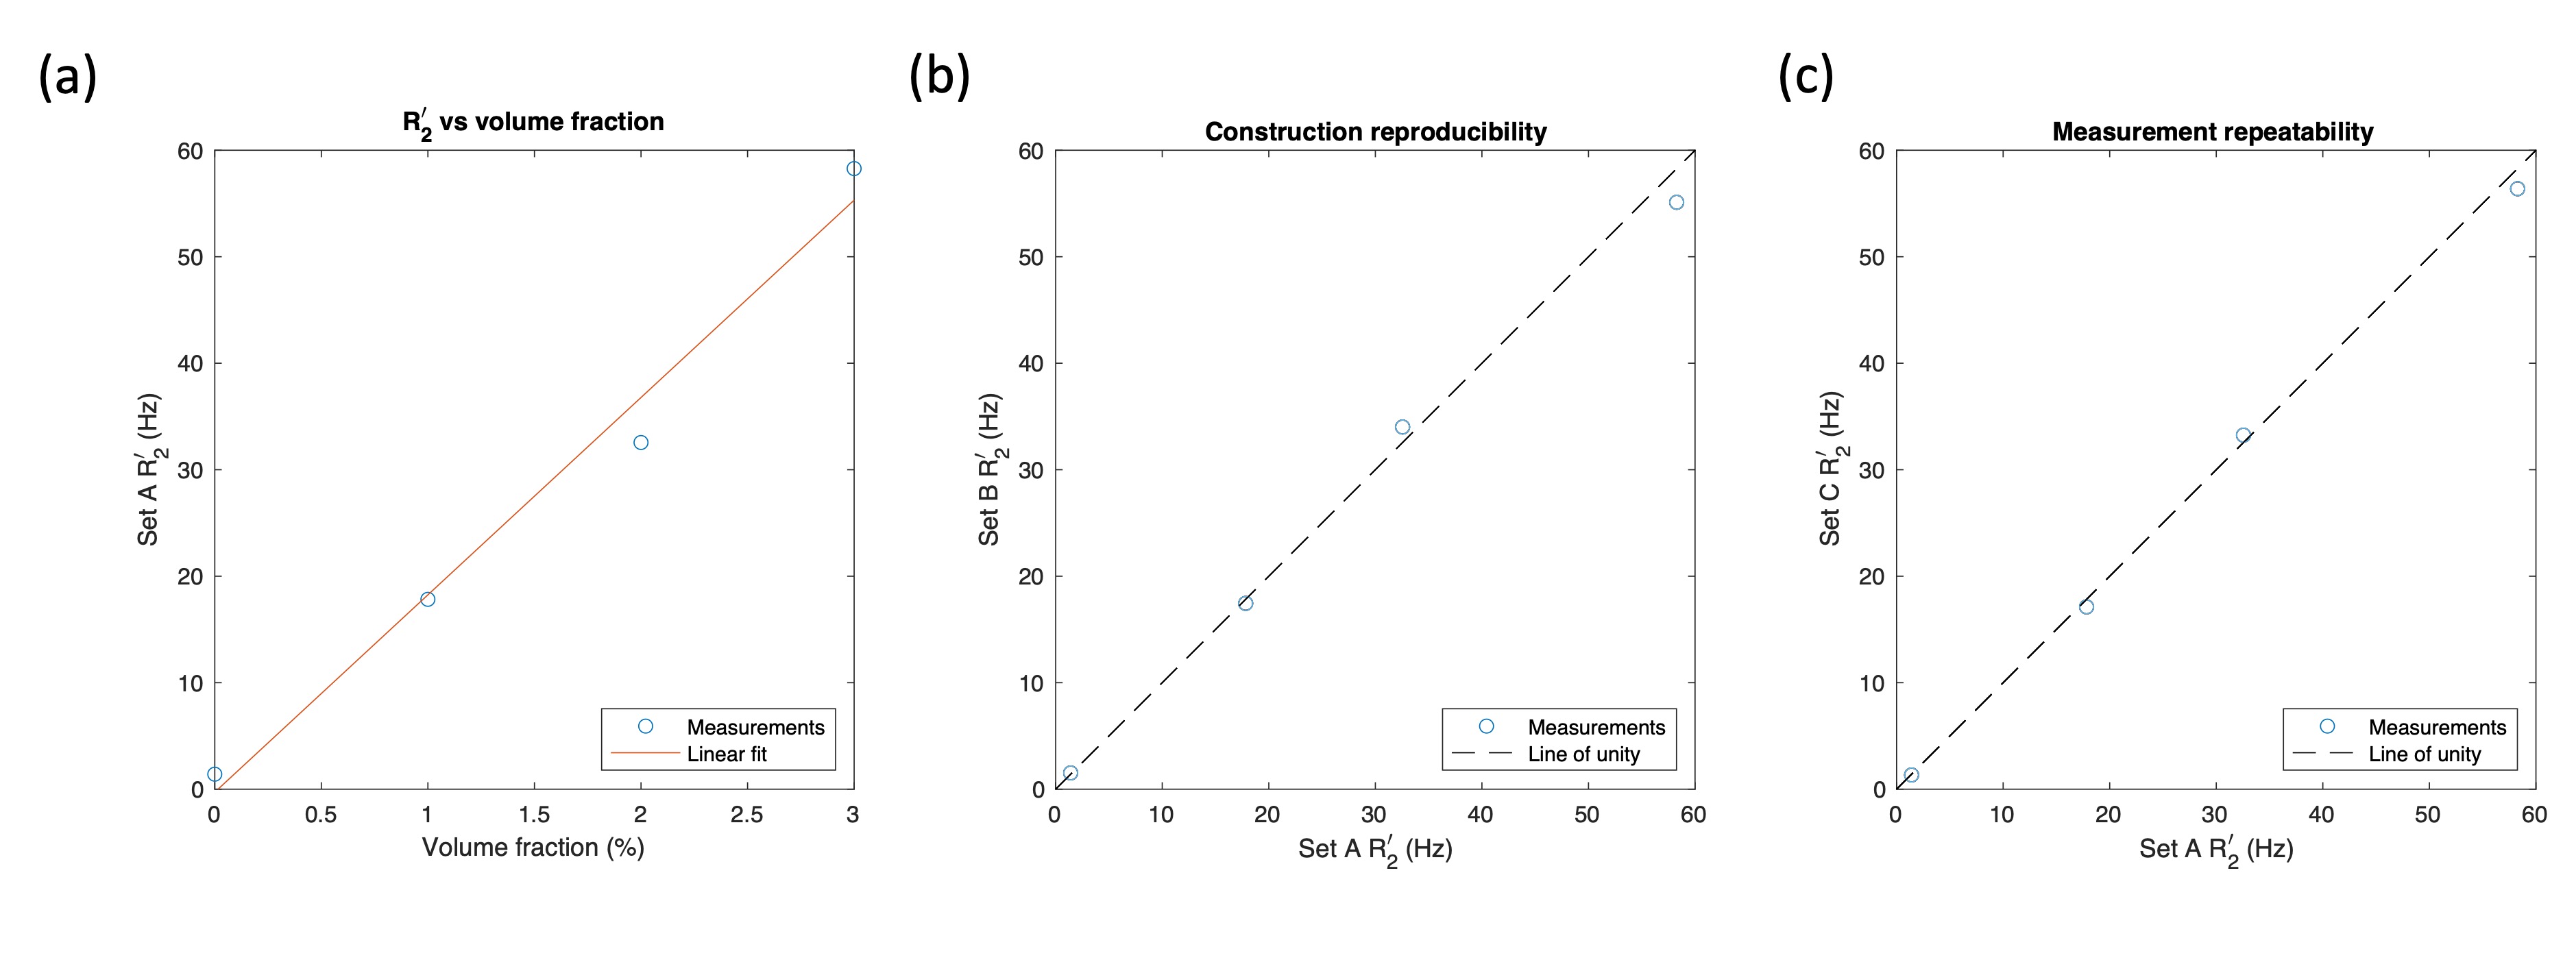
Phantom reproducibilityFigure 2 show the results of the reproducibility experiments. A linear relationship between R2' and glass bubble fraction is found (Fig. 2a) and good reproducibility of both phantom construction (Fig. 2b) and the MRI measurements (Fig. 2c).
Sequence comparison
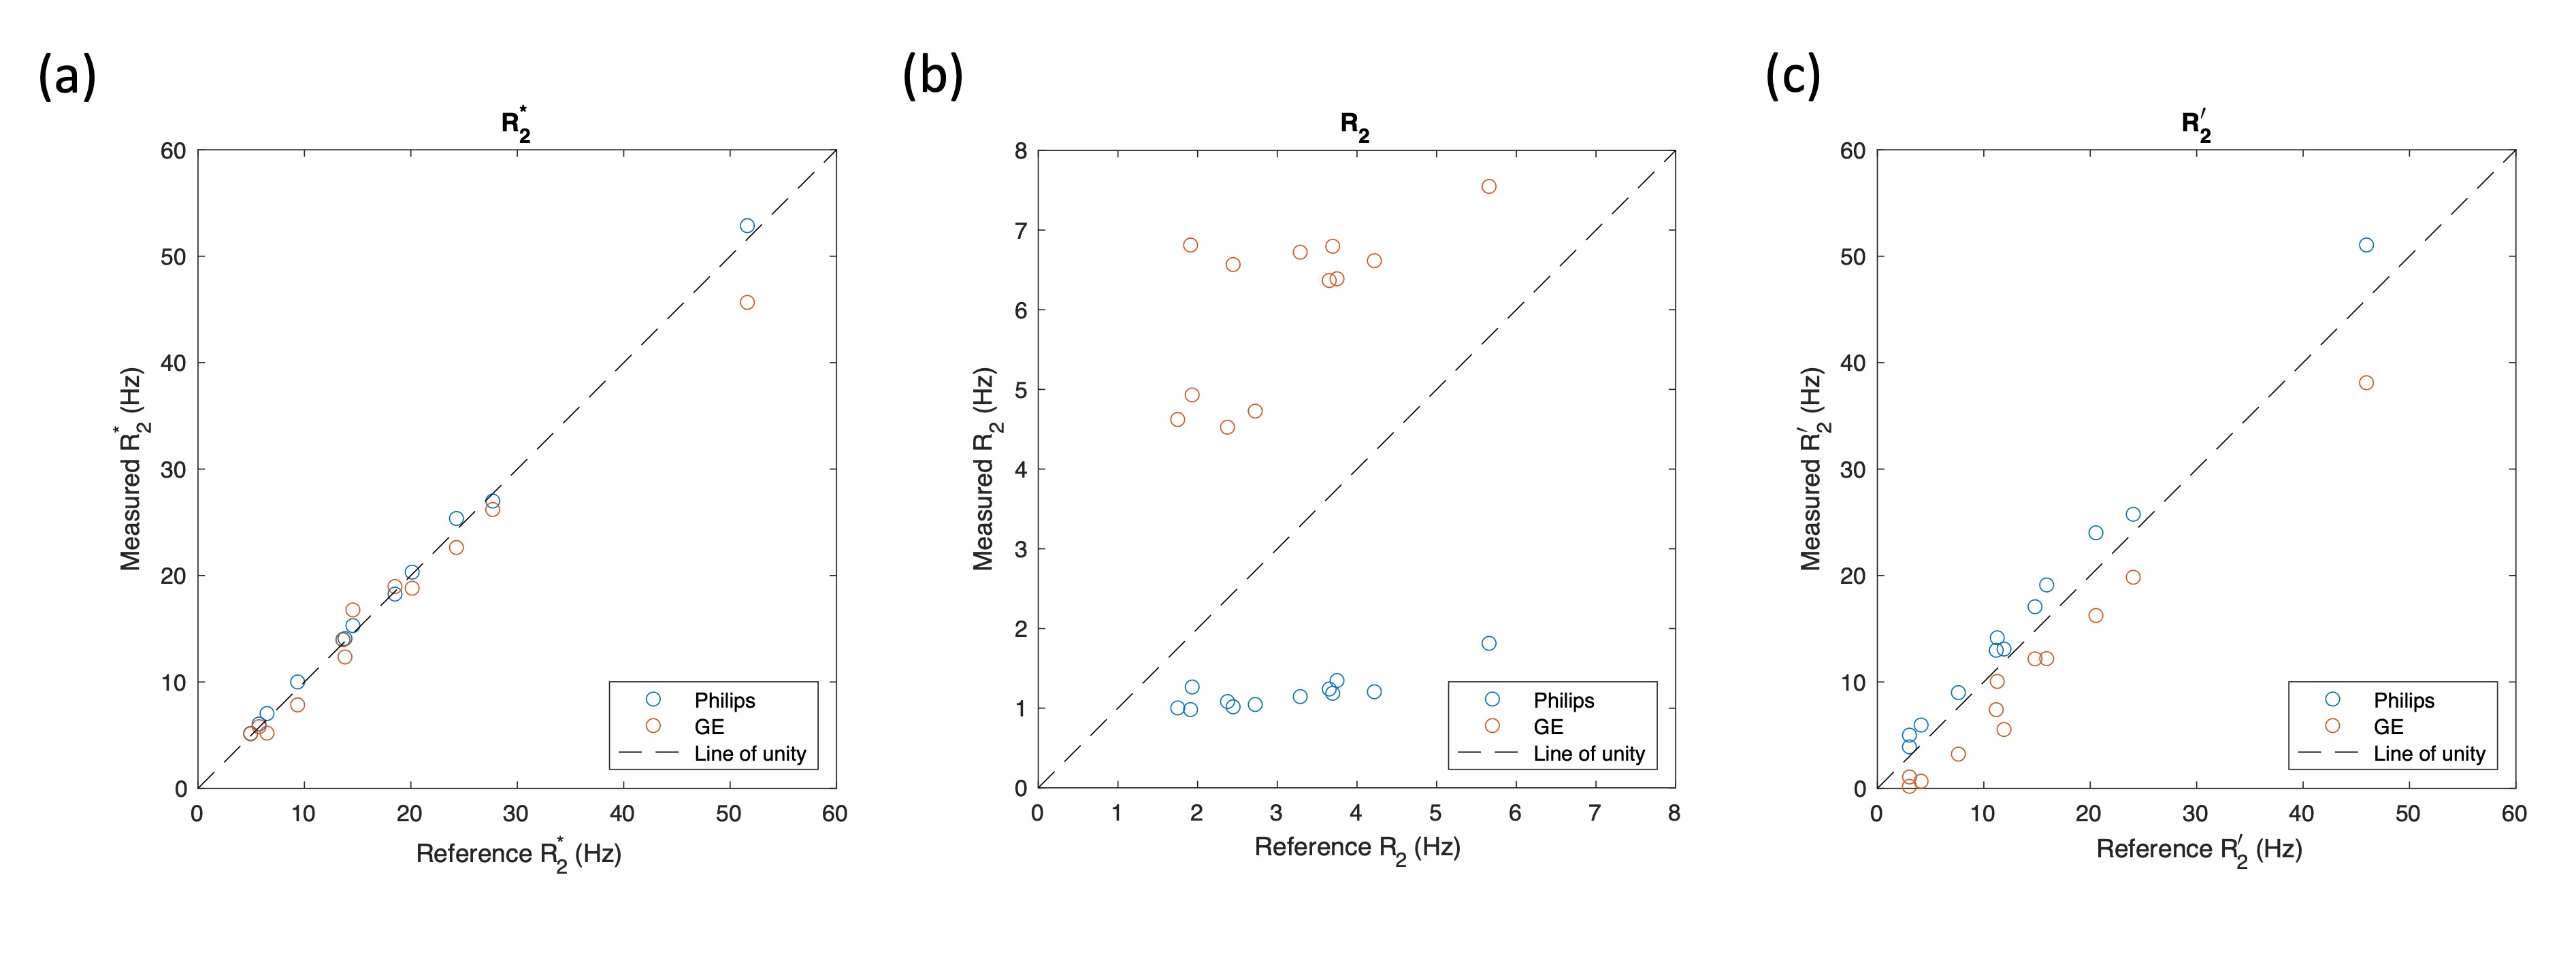
Figure 3 plots the measurements of R2*, R2 and R2' from the reference data against the 3D-GRASE-mGRE and T2MAP-mGRE data. Reasonable agreement is seen between mGRE datasets (Fig. 3a), but poor agreement is found between the measurements of R2 (Fig. 3b). Despite this the R2' values show a similar trend for both 3D-GRASE-mGRE and T2MAP-mGRE (Fig. 3c).
Discussion
In this study microscopic glass bubbles were investigated for generating R2' contrast in a phantom. A strong R2' contrast was found as a function of glass bubble volume fraction, necessitating very low volume fractions to reproduce typical R2' values in the brain (R2'~3-7Hz). Although producing a homogenous distribution of glass bubbles when the volume fraction is very low is challenging. Values of R2 were found to be very small, equivalent to T2=176-518ms. Hence R2* measurements in this phantom are dominated by R2' contrast. Further investigation is required to understand the poor relationship between 3D-GRASE/T2MAP and the reference data. Typical brain R2 values could be obtained by doping the gel. Future work will focus on other sequences that provide a direct measurement of R2' such as asymmetric spin echo (ASE). A current limitation of the glass bubbles is that they tend to float to the top within a few weeks. Heating the tubes and mixing using a vortexer could make the phantom last longer. However, vigorous mixing could lead to the creation of bubbles which also have an R2' effect.Acknowledgements
No acknowledgement found.References
1. Stone AJ, Harston GWJ, Carone D, Okell TW, Kennedy J, Blockley NP. Prospects for investigating brain oxygenation in acute stroke: Experience with a non-contrast quantitative BOLD based approach. Human Brain Mapping. 2019;40(10):2853-66.
2. Wiestler B, Kluge A, Lukas M, Gempt J, Ringel F, Schlegel J, et al. Multiparametric MRI-based differentiation of WHO grade II/III glioma and WHO grade IV glioblastoma. Scientific Reports. 2016;6:6.
3. Christen T, Lemasson B, Pannetier N, Farion R, Segebarth C, Remy C, et al. Evaluation of a quantitative blood oxygenation level-dependent (qBOLD) approach to map local blood oxygen saturation. NMR Biomed. 2011;24(4):393-403.
4. Weisskoff RM, Zuo CS, Boxerman JL, Rosen BR. Microscopic susceptibility variation and transverse relaxation: theory and experiment. Magn Reson Med. 1994;31(6):601-10.
5. Kaczmarz S, Hyder F, Preibisch C. Oxygen extraction fraction mapping with multi-parametric quantitative BOLD MRI: Reduced transverse relaxation bias using 3D-GraSE imaging. Neuroimage. 2020;220:117095.
Figures