4027
Computing hemodynamic point-spread functions with biophysical simulations of microvascular networks: effects of trans-laminar capillaries1Athinoula A. Martinos Center For Biomedical Imaging, MGH, Charlestown, MA, United States, 2Department of Radiology, Harvard Medical School, Boston, MA, United States, 3Health Sciences and Technology, Massachusetts Institute of Technology, Cambridge, MA, United States
Synopsis
Keywords: fMRI, Blood vessels, High-Resolution fMRI, Biophysical Simulation
Here we attempted to estimate a “point-spread function” of blood flow and oxygenation in the cerebral cortex through biophysical simulations based on a reconstructed vascular anatomical network. We stimulated individual pre-capillary arterioles and computed the downstream capillary flow and oxygenation based on fluid dynamics and oxygen transport through blood and tissue. We quantified this spread in the directions radial and tangential to the cortex. While several biases in spread were observed, we found a roughly 400 μm spread in the radial direction and generally narrower spread in the tangential direction, although both varied with cortical depth.Introduction
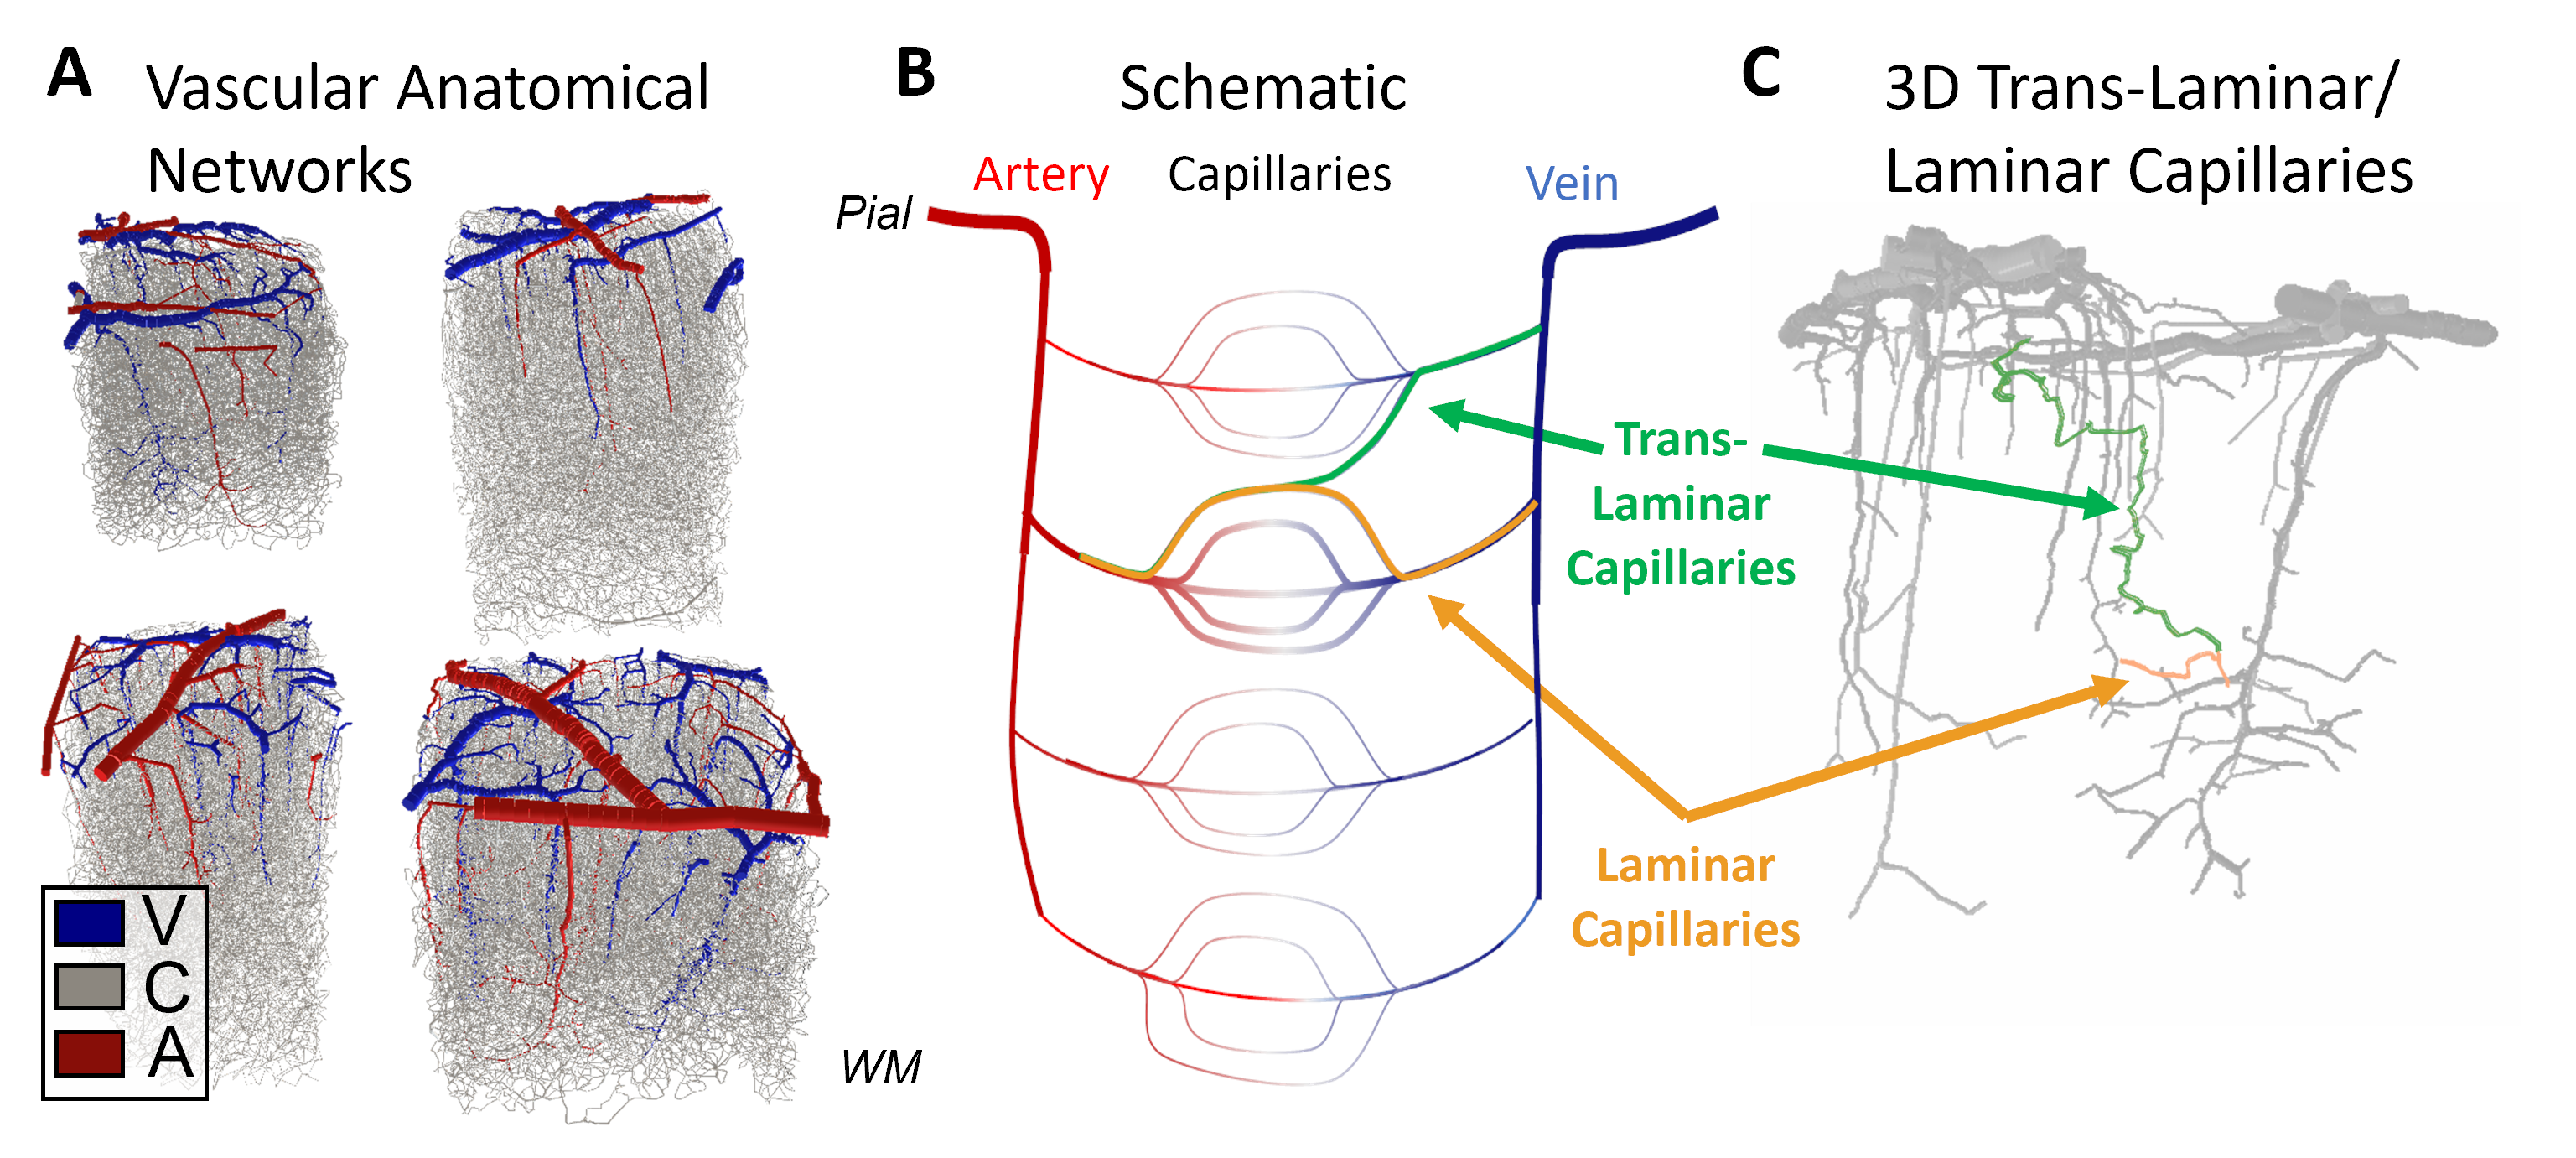
The intrinsic spatial resolution of fMRI is dictated both by the spacing of the control structures that regulate blood flow and by the anatomy of the microvasculature. While the mechanisms of fine-scale control are still debated1, the microvascular anatomy and density necessarily shape the hemodynamic response to neural activity at its finest scales. The smallest vessels in the cerebral cortex, the capillaries, are often described as randomly arranged, however modern models used in laminar fMRI assume independent capillary beds across cortical depths2, with capillaries running largely tangential to the cortex in a direct path from one diving arteriole to the nearest ascending venule, suggesting laminar- or columnar-level regulation if each capillary bed could be activated individually. However, capillaries to be appear much less orderly and many originating in one cortical layer may traverse several layers, the so-called “trans-laminar capillaries”, causing hemodynamic spread and a loss of laminar specificity of the blood flow response. To estimate this hemodynamic spread, here we perform biophysical simulations of full Vascular Anatomical Network (VAN) models spanning the entire cortical thickness reconstructed from mouse somatosensory cortex, and quantify both the “point-spread” of blood flow and blood oxygenation resulting from stimulating single pre-capillary arterioles.Methods
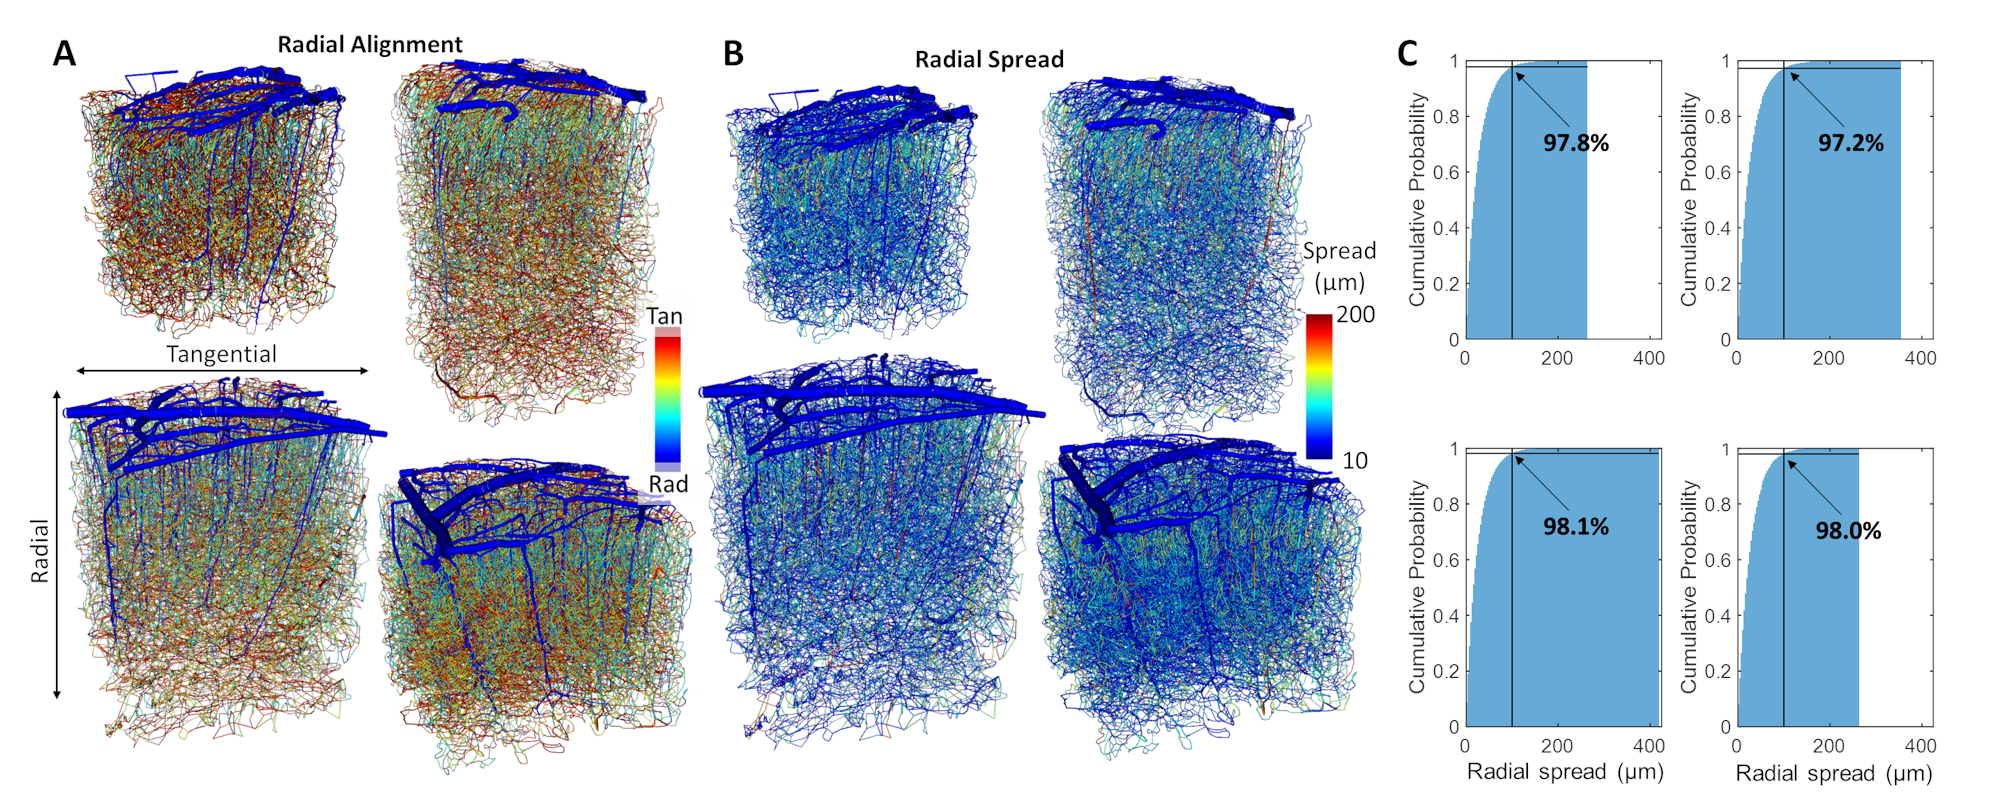
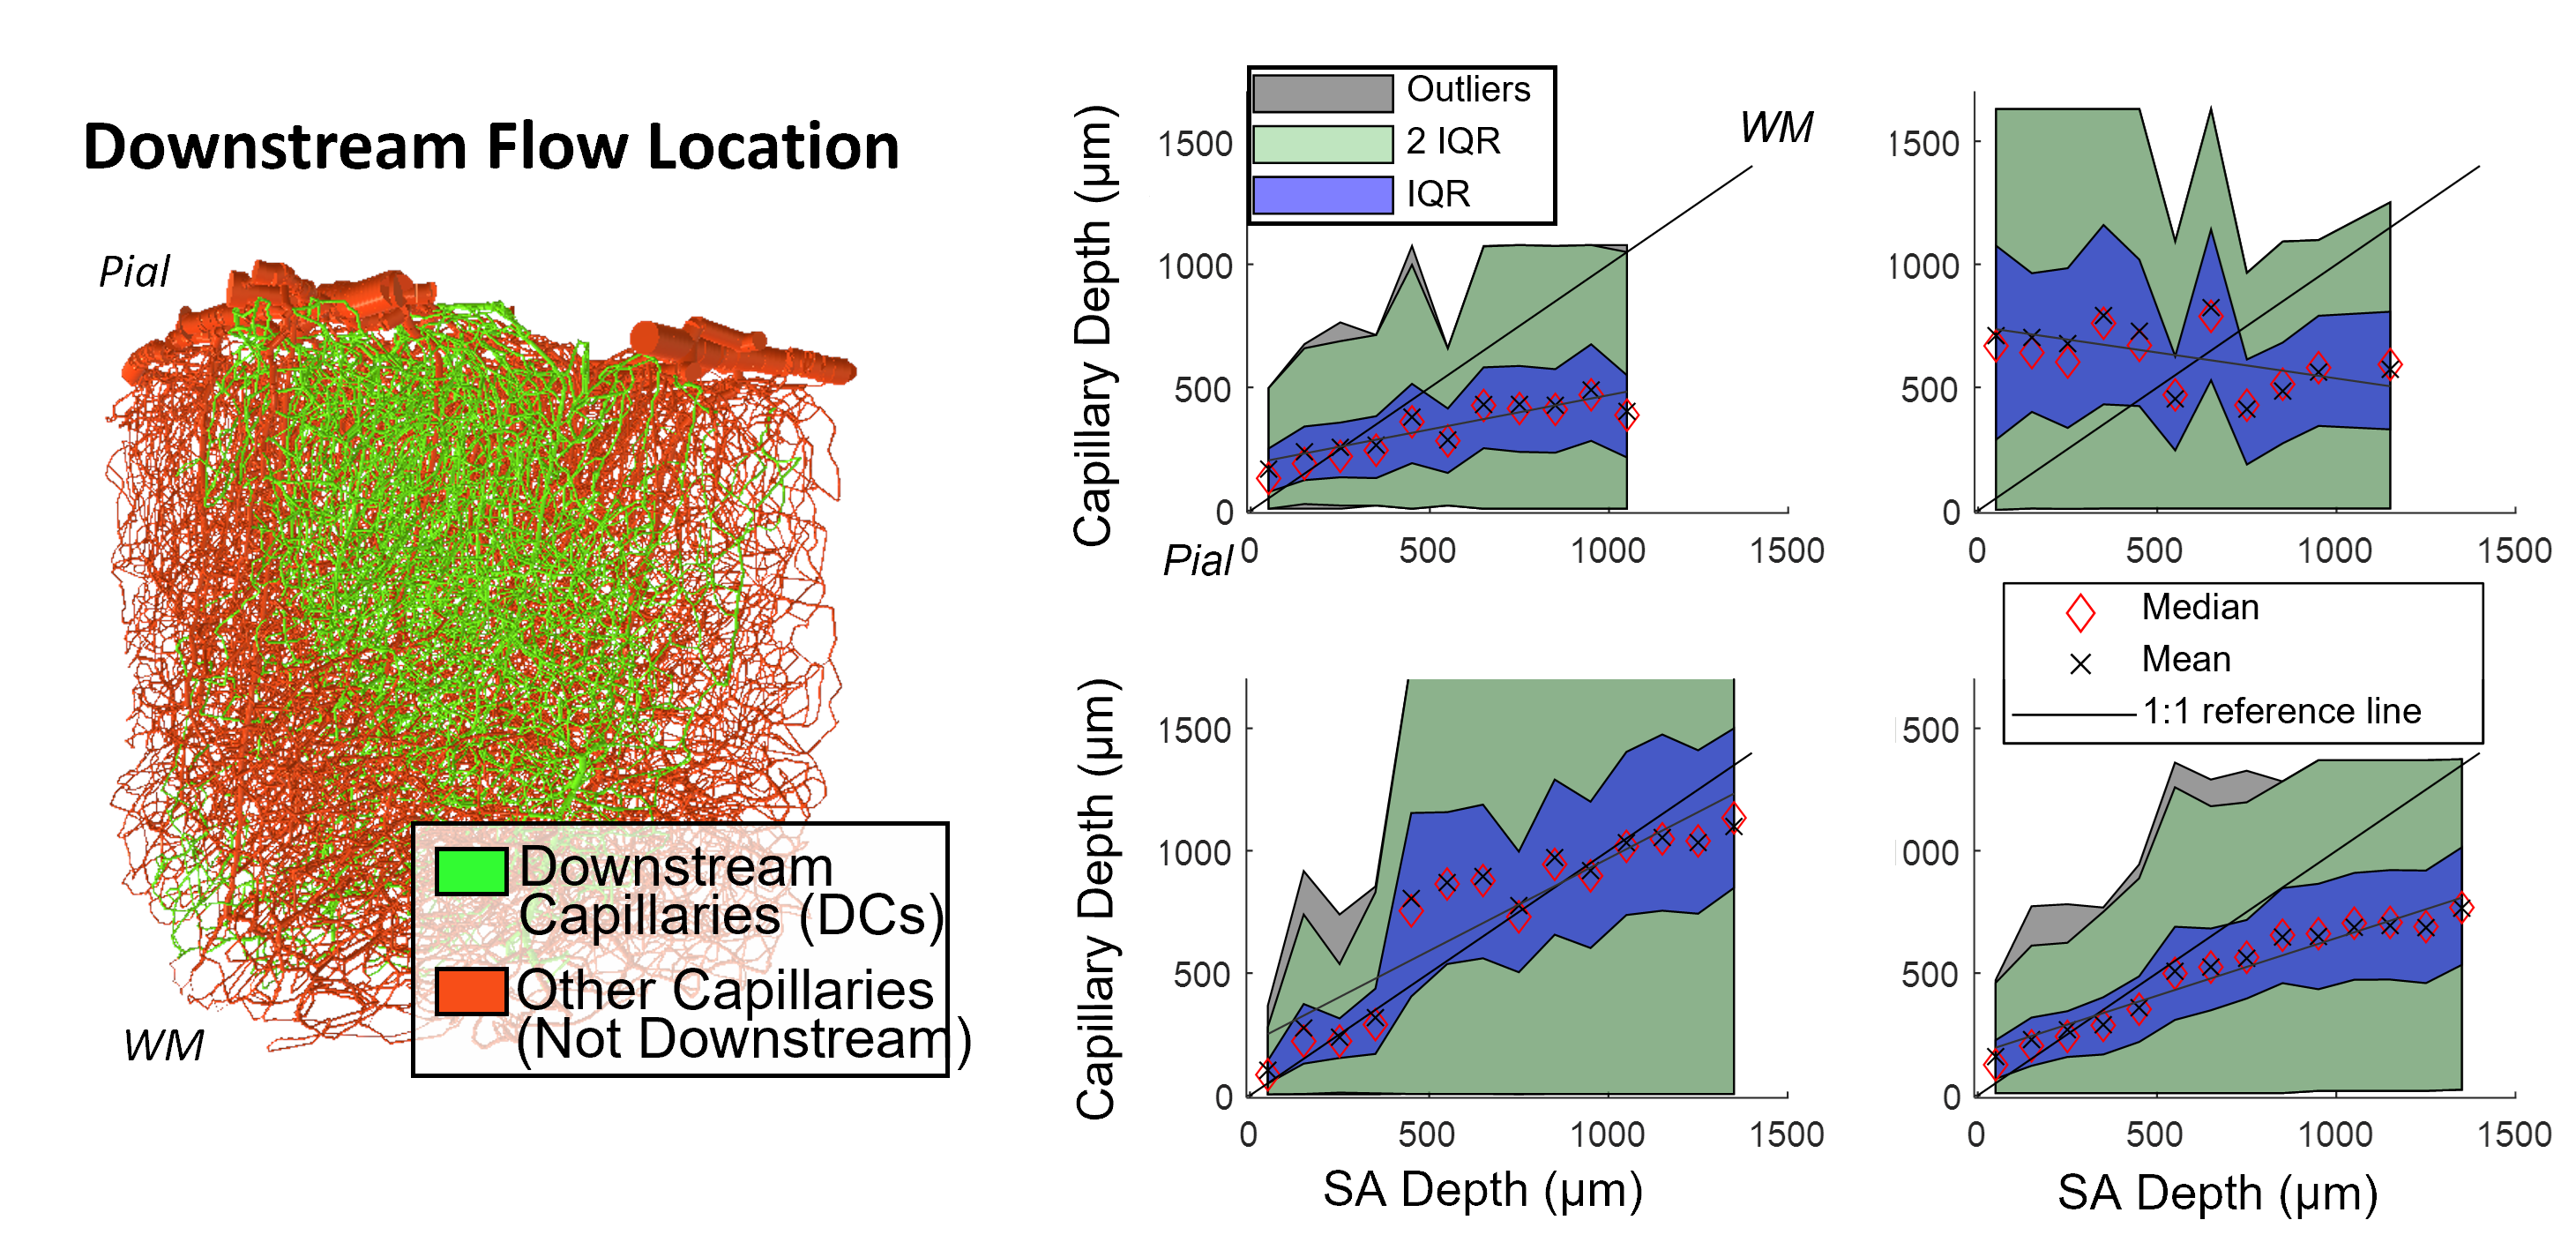
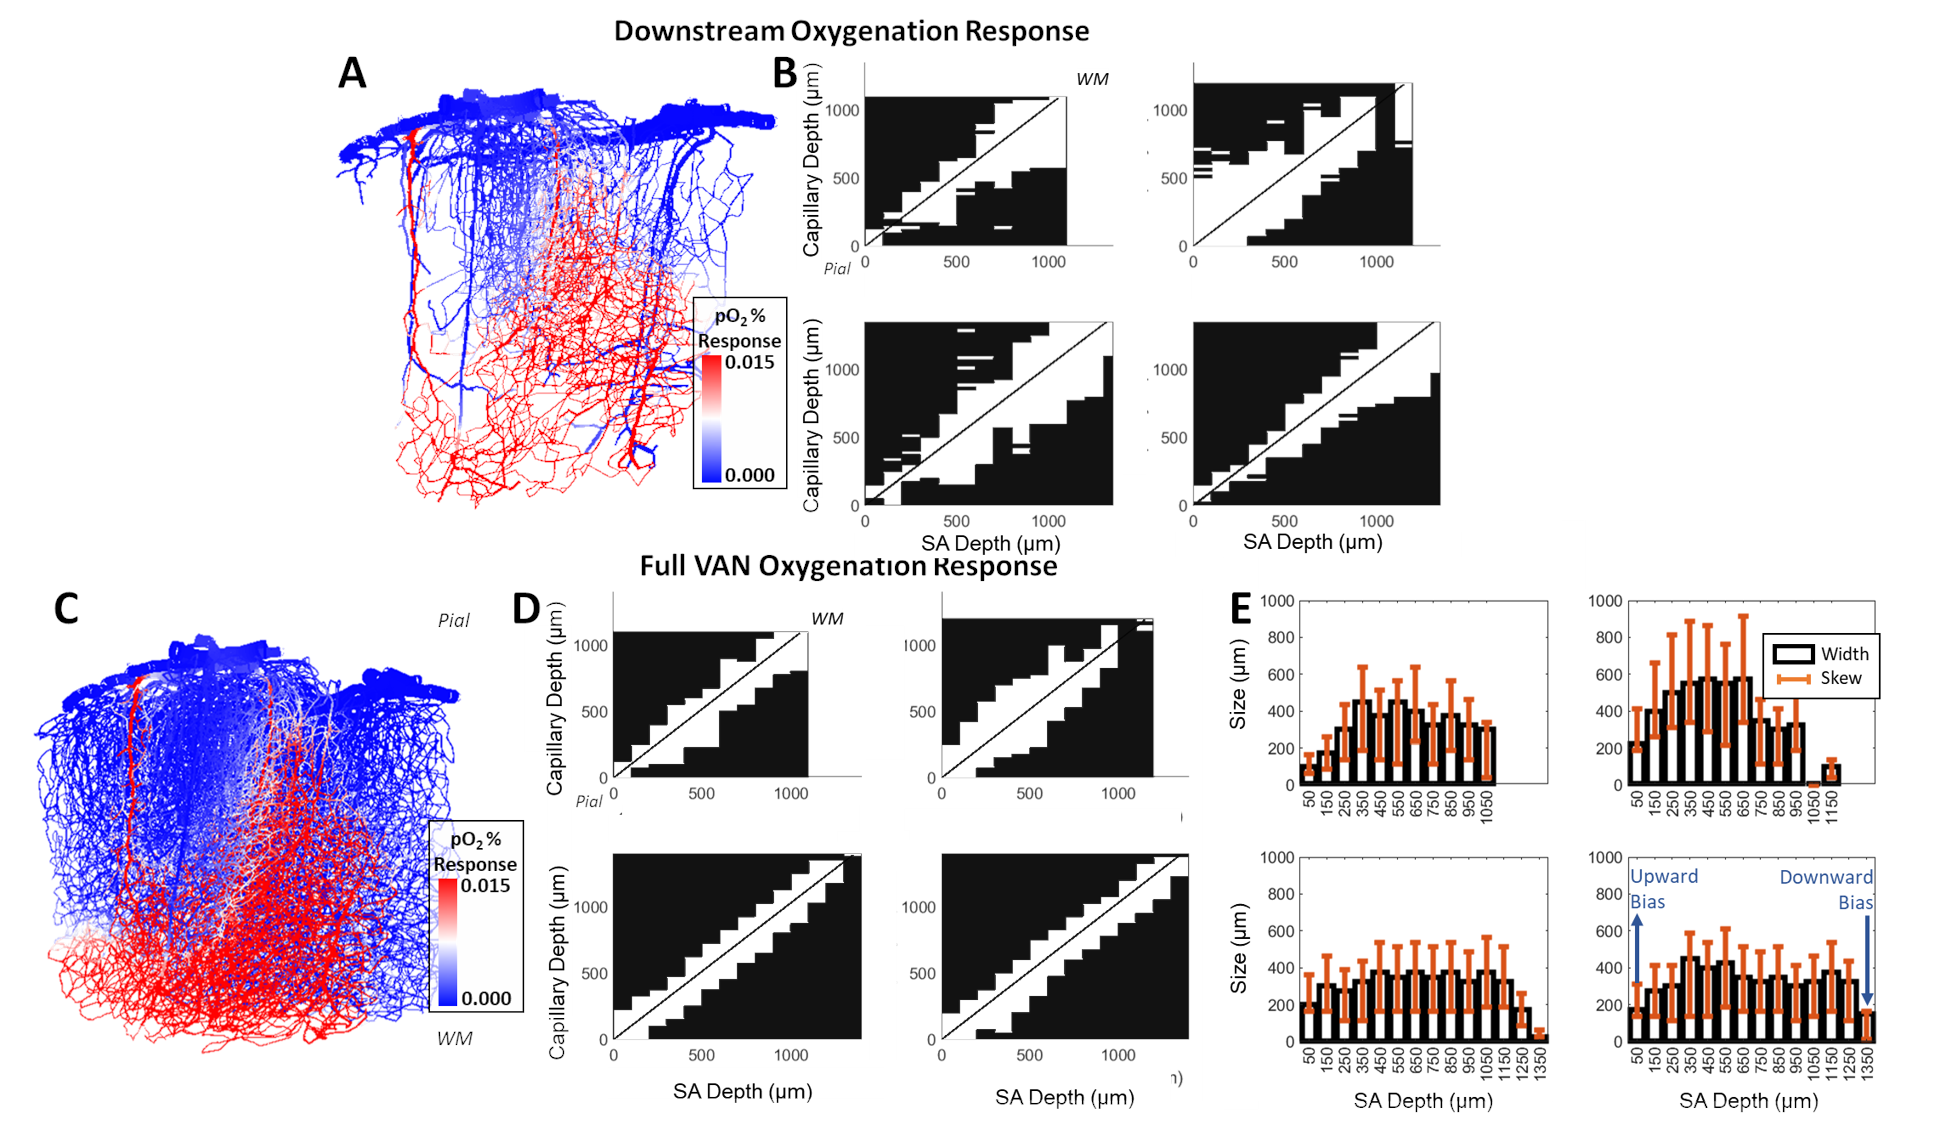
Cerebral microvasculature was reconstructed from optical imaging data from mouse somatosensory cortex as described previously3. Four (4) individual VAN models (Figure 1A) were used for biophysical simulations. Blood flow was computed using the Hagen-Poiseuille relationship, and oxygenation was computed with a state-of-the-art 1D-3D coupling approach4. To compute a “point-spread function”, a series of steady-state simulations of blood flow and oxygenation were computed before and after dilating and injecting oxygen into a single point in the VAN, in this case a single “stimulated arteriole” (or SA). A total of 1132 SAs were used to estimate the resulting point-spreads. Blood pressure and oxygen partial pressure (pO2) were set to 120 and 102 mmHg for arteries, respectively, and 5 mmHg blood pressure at veins5,6. The resulting blood flow responses were estimated by identifying all “downstream capillaries” (DCs) fed by each SA. Then, the oxygenation responses were then computed, and analyzed separately within these DCs and then again within all vessels. A mask was then generated using the relative pO2 changes and the top 50% most responsive vessels were identified. We note that the results were not strongly dependent on the threshold. The spatial spread was defined by the mask spatial width and skew for each SA. For comparison, we also computed the angle between each individual capillary segment and cortical surface normal, and the length each capillary in the redial direction was computed in order to compare the hemodynamic simulations with the microvascular geometry.Results
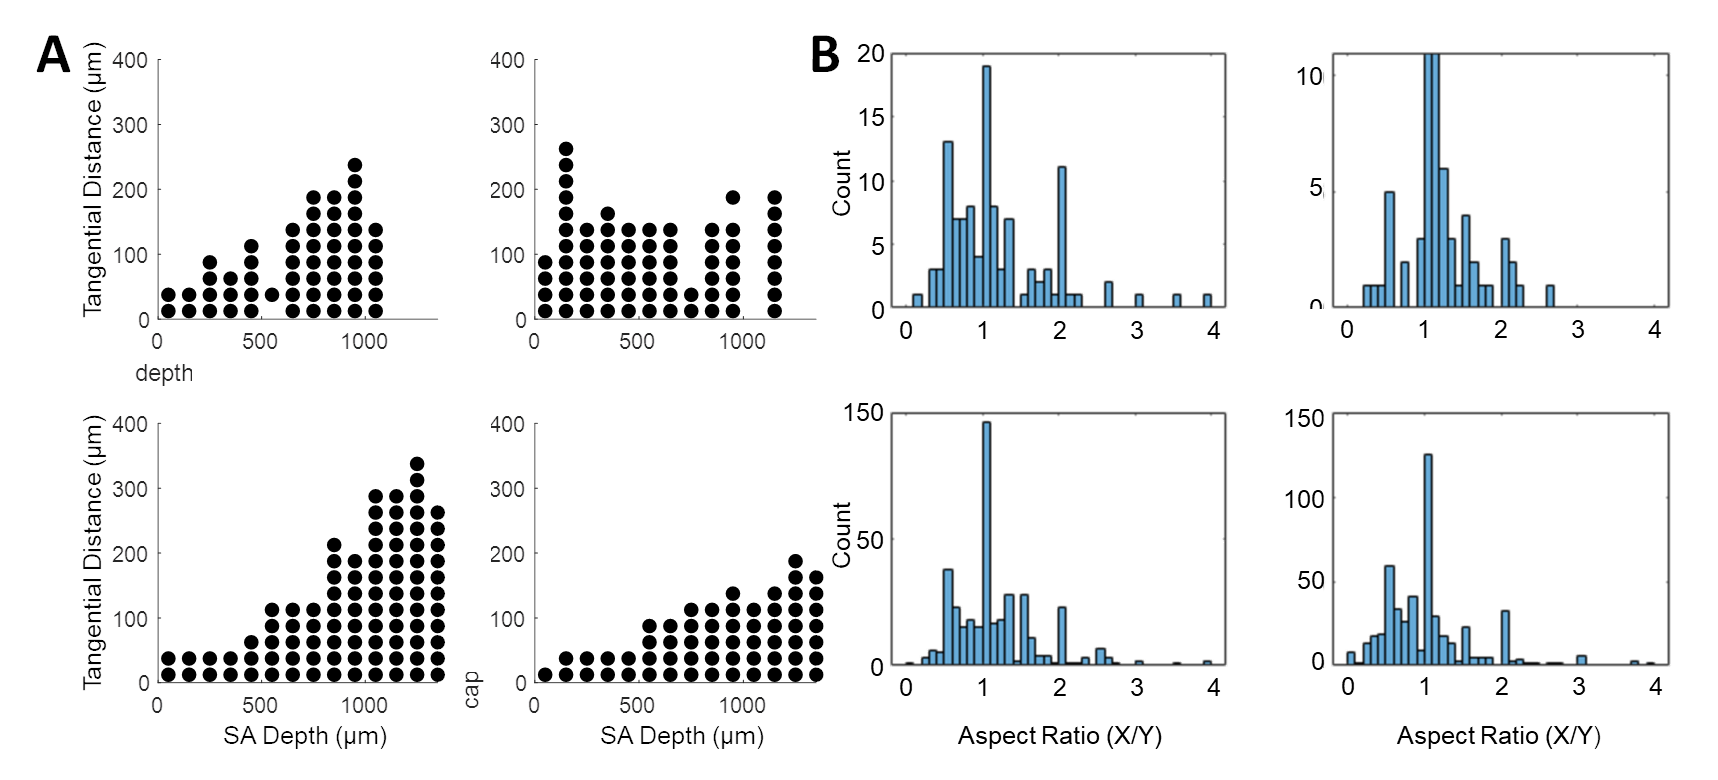
The angle and radial length of each capillary segment are plotted in Figure 2, which revealed < 3% of all capillaries has a radial length greater than 100 μm, which was far smaller than the radial flow calculated from our simulations, indicating that observations of the anatomy alone may lead to incorrect conclusions about blood flow patterns. The simulations revealed several biases in the downstream anatomical response as displayed in Figure 3. These included a bias at the white matter (WM) and the CSF interfaces at which the flow tended towards the middle depths of the VAN, caused by the simulation boundaries at these interfaces. We also noted a bias of flow tending towards the pial surface which was caused by the draining veins collecting blood at the surface as blood exits the cortex. The oxygenation response exhibited different set of biases, summarized in Figure 4. Interestingly, we noticed that the oxygenation response was more uniform across depth than the flow response. This was caused by a combination of increased downstream oxygenation and greater oxygen delivery from the SAs, leads to less extraction of oxygen from the tissue from nearby capillaries. We noted that, although there were biases towards the middle depth at the CSF and WM boundaries, the general oxygenation spread was approximately 400 µm or ~40% of the cortical depth in mouse at any given depth. We also noted that the tangential spread increased as a function of depth and exhibited some level of anisotropy (Figure 5). Overall the spread in the radial direction was larger than that in the tangential direction, although the tangential spread approached the radial spread in the depths close to the white matter interface.Discussion
Our simulations have suggested substantial trans-laminar capillary blood flow and oxygenation which have the potential to reduce the laminar specificity of BOLD fMRI signals. We note that our simulations assume that prolonged stimulation has led to a new steady-state, ignoring transient effects which may be important5 and we use the same stimulation magnitude although the response may vary depending on many factors. We expect these limitations to have little effect on the spatial response patterns reported here. We also note our choice of mouse VANs was because a 3D human VAN does not exist, although trans-laminar capillary paths can be observed in histological data7, suggesting similar trends in radial and tangential spread may exist in the human brain. Quantifying these trends will help identify the limits of fMRI in humans.Acknowledgements
This work was supported in part by the NIH NIBIB (grant P41-EB030006 and R01-EB019437), the BRAIN Initiative (NIH NIMH grants R01-MH111419, R01-MH111419, R01-EB032746, R01-NS128843, and F32-MH125599), the MGH/HST Athinoula A. Martinos Center for Biomedical Imaging; and the resources provided by the NIH Shared Instrumentation Grant S10-RR023043.References
1. Drew, P. J. Vascular and neural basis of the BOLD signal. Curr. Opin. Neurobiol. 58, 61–69 (2019).
2. Havlicek, M. & Uludağ, K. A dynamical model of the laminar BOLD response. NeuroImage 204, 116209 (2020).
3. Blinder, P. et al. The cortical angiome: an interconnected vascular network with noncolumnar patterns of blood flow. Nat. Neurosci. 16, 889–897 (2013).
4. Hartung, G. et al. Voxelized simulation of cerebral oxygen perfusion elucidates hypoxia in aged mouse cortex. PLoS Comput. Biol. 17, e1008584 (2021).
5. Gagnon, L. et al. Quantifying the Microvascular Origin of BOLD-fMRI from First Principles with Two-Photon Microscopy and an Oxygen-Sensitive Nanoprobe. J. Neurosci. 35, 3663–3675 (2015).
6. Gould, I. G., Tsai, P., Kleinfeld, D. & Linninger, A. The capillary bed offers the largest hemodynamic resistance to the cortical blood supply. J. Cereb. Blood Flow Metab. 37, 52–68 (2017).
7. Cassot, F. et al. Branching patterns for arterioles and venules of the human cerebral cortex. Brain Res. 1313, 62–78 (2010).
Figures