4024
An improved data acquisition for robust oxygen extraction fraction (OEF) mapping using an integrative model of QSM and qBOLD (QSM+qBOLD=QQ)1Biomedical Engineering, SUNY Buffalo, Buffalo, NY, United States, 2Weill Cornell Medicine, New York, NY, United States
Synopsis
Keywords: Oxygenation, Quantitative Imaging
Oxygen extraction fraction (OEF) is critical to evaluate brain tissue viability and function in neurologic disorders. An integrated model of QSM and qBOLD (QSM+qBOLD or QQ) has been developed to map OEF utilizing a routine multi-echo gradient echo (mGRE) acquisition without impractical vascular challenges. This study proposes a novel mGRE acquisition with logarithmic echo spacing that acquires more data points in short echo time regime, which is critical to decouple the model parameters in QQ. The proposed novel mGRE provided more accurate OEF in two simulations, compared to the conventional mGRE.Introduction
Oxygen extraction fraction (OEF) mapping is critical to assess brain tissue viability and function in neurologic diseases1-3. Recently, a integrative model of quantitative susceptibility mapping and quantitative blood oxygen level dependent magnitude (QSM+qBOLD or QQ) has been developed to consider the OEF effect on both magnitude and phase of a routinely available multi-echo gradient echo (mGRE) data4-8. QQ has been validated against calibrated fMRI9 and 15O-PET10, and its clinical feasibility has been demonstrated in ischemic stroke11, 12, multiple sclerosis13, brain cancer14, dementia15, and pre-eclampsia16.QQ has multiple model parameters with the coupling among the parameters4, 17, 18. For robust parameter decoupling, i.e., accurate OEF estimation, QQ requires data in a wide range of echo times with very high signal-to-noise ratio (SNR) as qBOLD in QQ estimates OEF by distinguishing its quadratic and linear effect in short (<15ms) and long echo times (TEs), respectively18. However, conventional mGRE with evenly spaced echoes does not provide enough data points in the short TEs, which can hinder the accurate OEF estimation. We developed a novel data acquisition scheme in mGRE, logarithmic TE sampling, to obtain sufficient data points in short TEs and compared it with the conventional evenly distributed echo sampling in simulations.
Methods
For OEF estimation, $$$OEF= 1-Y/Y_{a}$$$ where $$$Y$$$ and $$$Y_{a}$$$(=0.984) are the venous and arterial oxygenation, QQ model combines QSM of phase modeling and qBOLD of magnitude modeling with a priori regulation $$$R$$$ on $$$Y$$$7. $${argmin}_{Y,v,R_{2},S_{0},\chi_{n}}\left\{w||\chi-F_{QSM}\left(Y,v,\chi_{n}\right)||^{2}_{2}+\sum_j|||S_{j}|-F_{qBOLD}\left(S_{0},Y,v,R_{2},\chi_{n},t_{j}\right)||^{2}_{2}+R(Y)\right\}$$ The first term divides voxel-wise susceptibility ($$$\chi$$$) into deoxyhemoglobin in venous blood, i.e. OEF effect, referenced to fully oxygenated arterial blood $$$\chi_{ba}=-0.108.3 ppb$$$19, and non-blood tissue susceptibility ($$$\chi_{n}$$$).$$F_{QSM}(Y,v,\chi_{n})=\left[\frac{\chi_{ba}}{\alpha}+\psi_{Hb}\cdot\Delta\chi_{Hb}\cdot\left(-Y+\frac{1-\left(1-\alpha\right)\cdot Y_{a}}{\alpha}\right)\right]\cdot v + \left(1-\frac{v}{\alpha}\right)\cdot \chi_{n}$$ where $$$\alpha = 0.77$$$ the ratio between the venous blood volume ($$$v$$$) and total blood volume20, $$$\psi_{Hb}=0.0909$$$ the hemoglobin volume fraction with Hct=0.35721-24, $$$\Delta\chi_{Hb}=12522 ppb$$$ the susceptibility difference between deoxy- and oxyhemoglobin25, 26.The qBOLD model considers the OEF effect on the mGRE magnitude4: $$F_{qBOLD}\left(S_{0,},Y,v,R_{2,}\chi_{n},t_{j}\right)=S_0\cdot e^{-R_2\cdot t_{j}}\cdot F_{BOLD}\left(Y,v,\chi_{n},t_{j}\right)\cdot G(t_{j})$$ where $$$S_0$$$ is signal intensity at $$$t=0$$$, $$$R_2$$$ is the transverse relaxation rate, $$$F_{BOLD}\left(Y,v,\chi_{n},t\right)=exp\left(-v\cdot f_{s}\left(\delta\omega\cdot t\right)\right)$$$18 where $$$f_s$$$ is the signal decay by the presence of the blood vessel network27 and $$$\delta\omega$$$ is the characteristic frequency due to the susceptibility difference between deoxygenated blood and the surrounding tissue4: $$$\delta \omega\left(Y,\chi_{n}\right)=\frac{1}{3}\cdot \gamma \cdot B_{0}\cdot \left[Hct\cdot \Delta \chi_{0}\cdot \left(1-Y\right) + \chi_{ba}-\chi_{n}\right]$$$ with $$$\gamma=$$$267.51 rad s-1T-1 the gyromagnetic ratio, and $$$B_0$$$ the main magnetic field strength. $$$G(t_{j})$$$ is the macroscopic field inhomogeneity contribution to mGRE signal decay4.
Validation
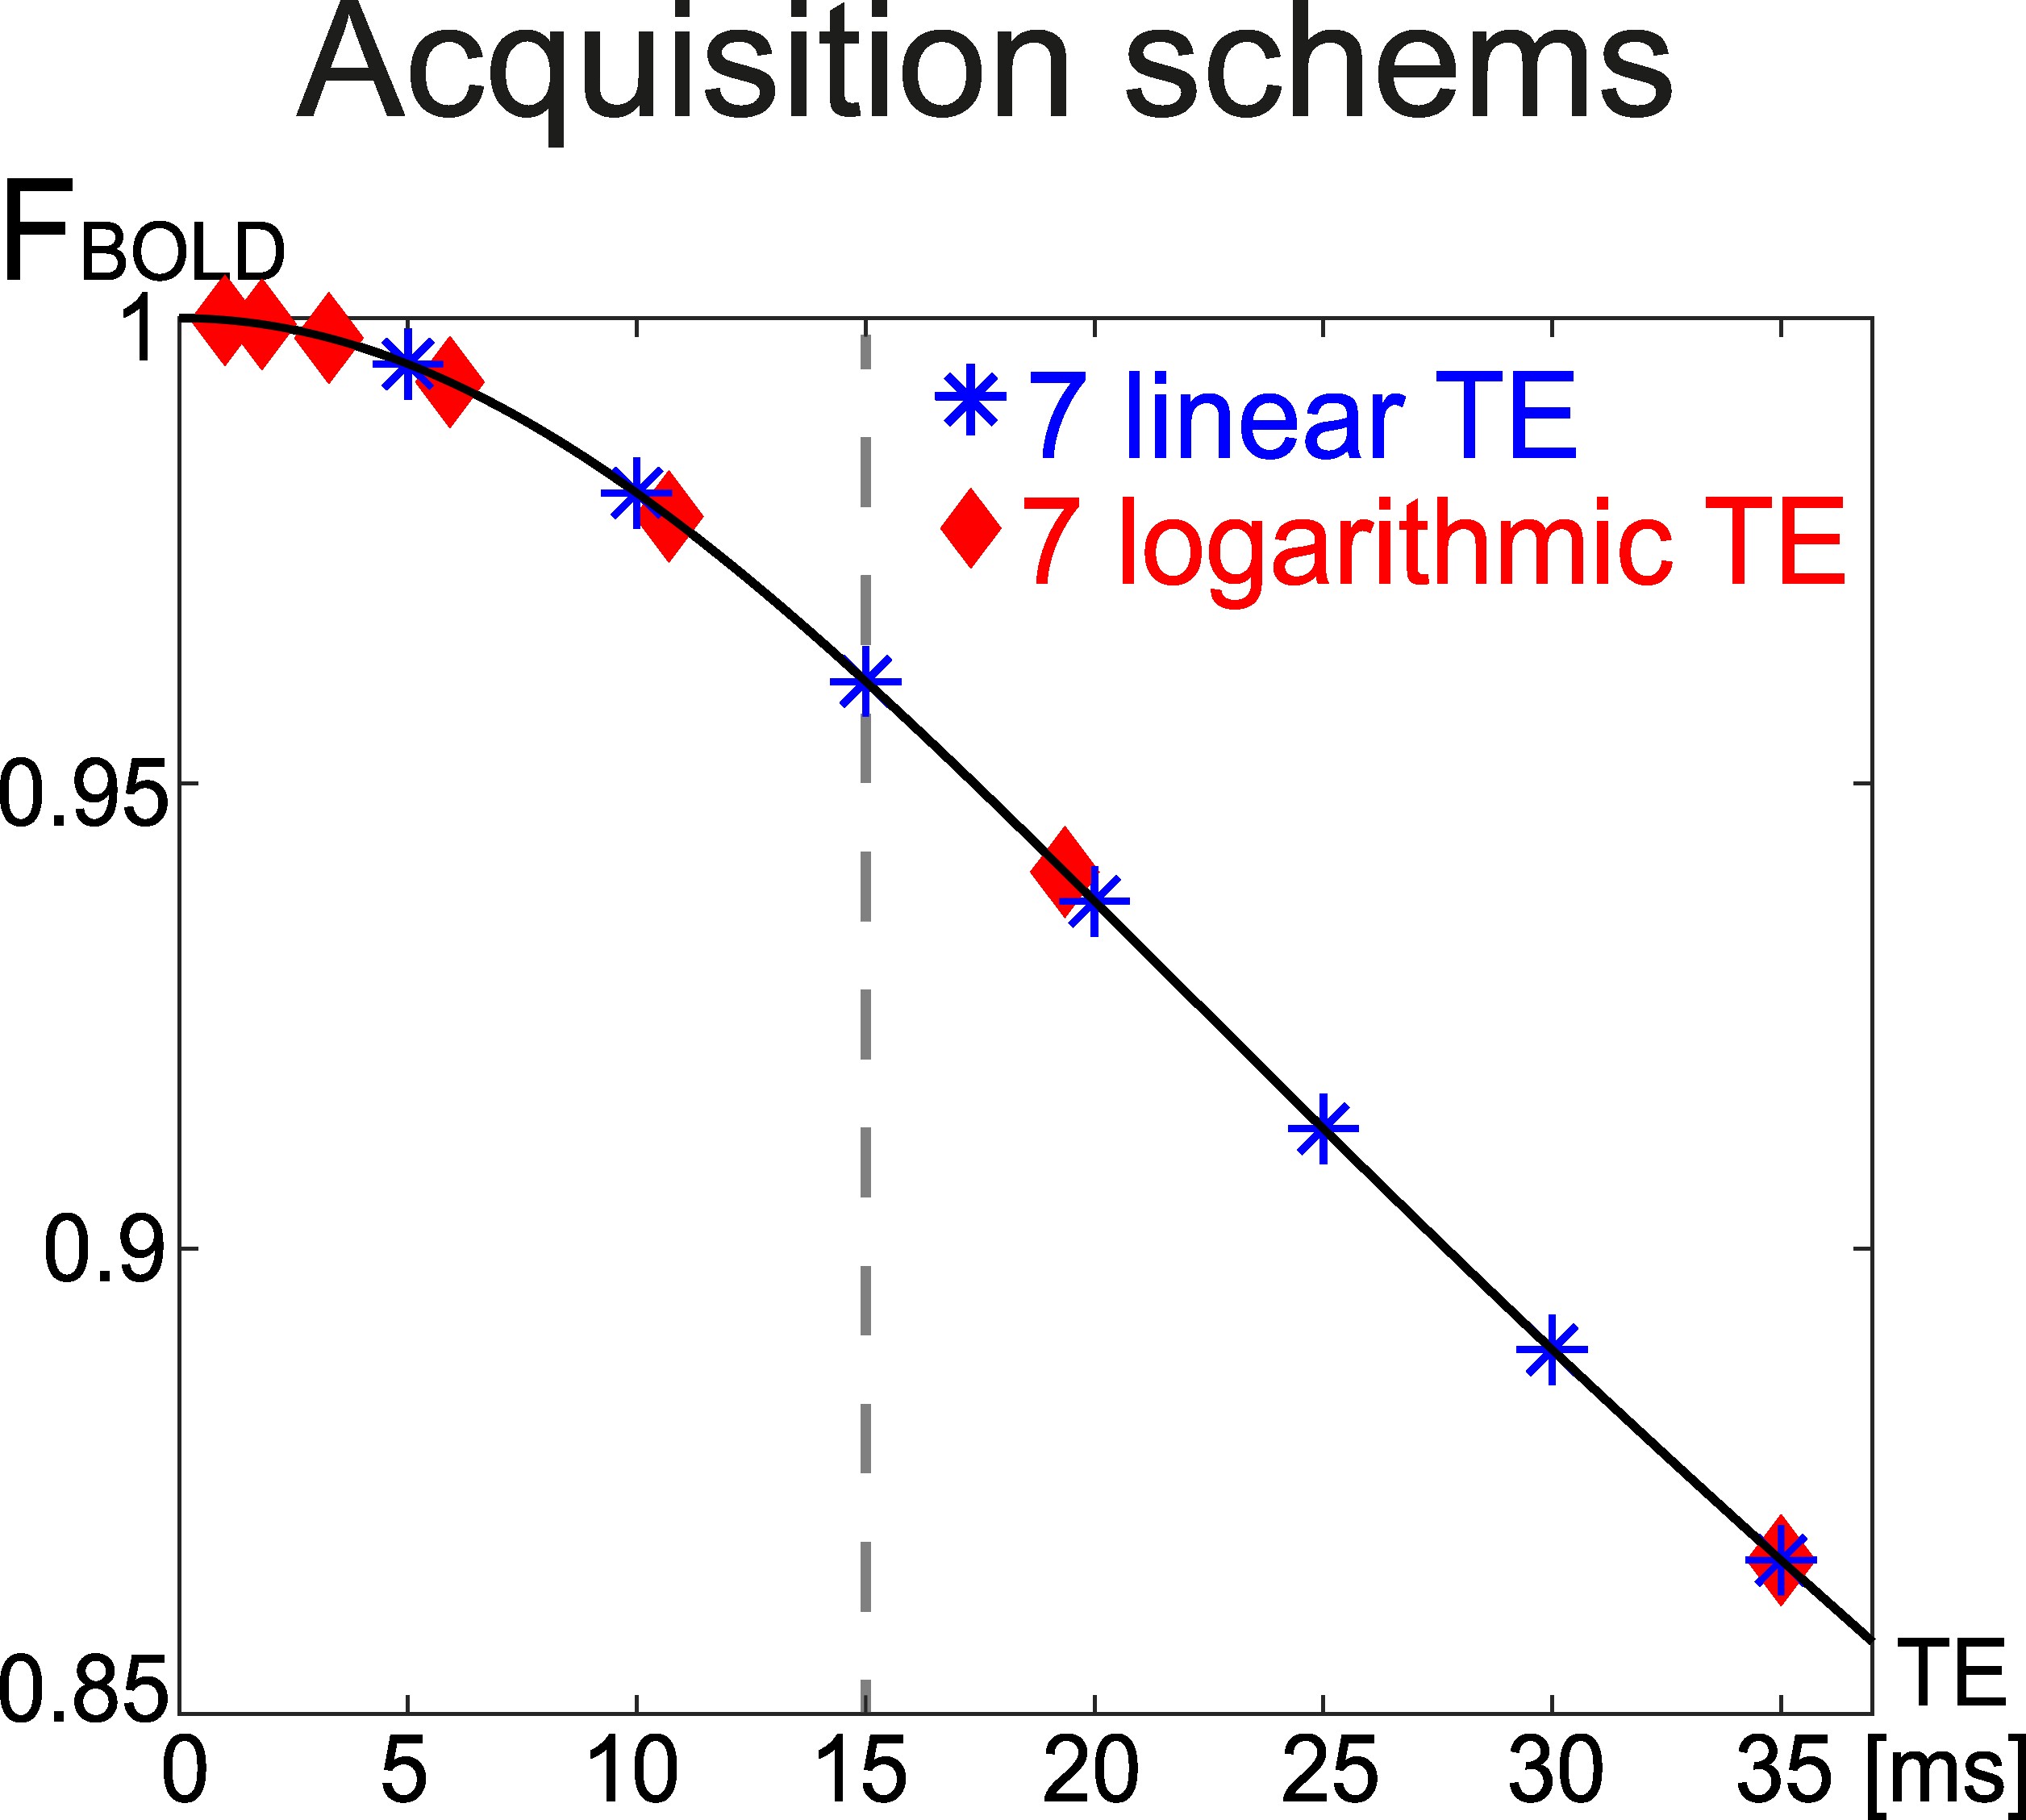
To investigate the effect of TE sampling schemes on the OEF accuracy, QQ was compared between two TE sets that have the same number of echoes and the same last echo time (Figure 1): 1) 7 evenly spaced echoes (7 linear TE, [5, 10, 15, 20, 25, 30, 35] ms) and 2) 7 logarithmically spaced echoes (7 logarithmic TE, [1, 1.8, 3.3, 5.9, 10.7, 19.4, 35] ms) in two numerical simulations.
Simulation 1: Healthy brain tissue scenario
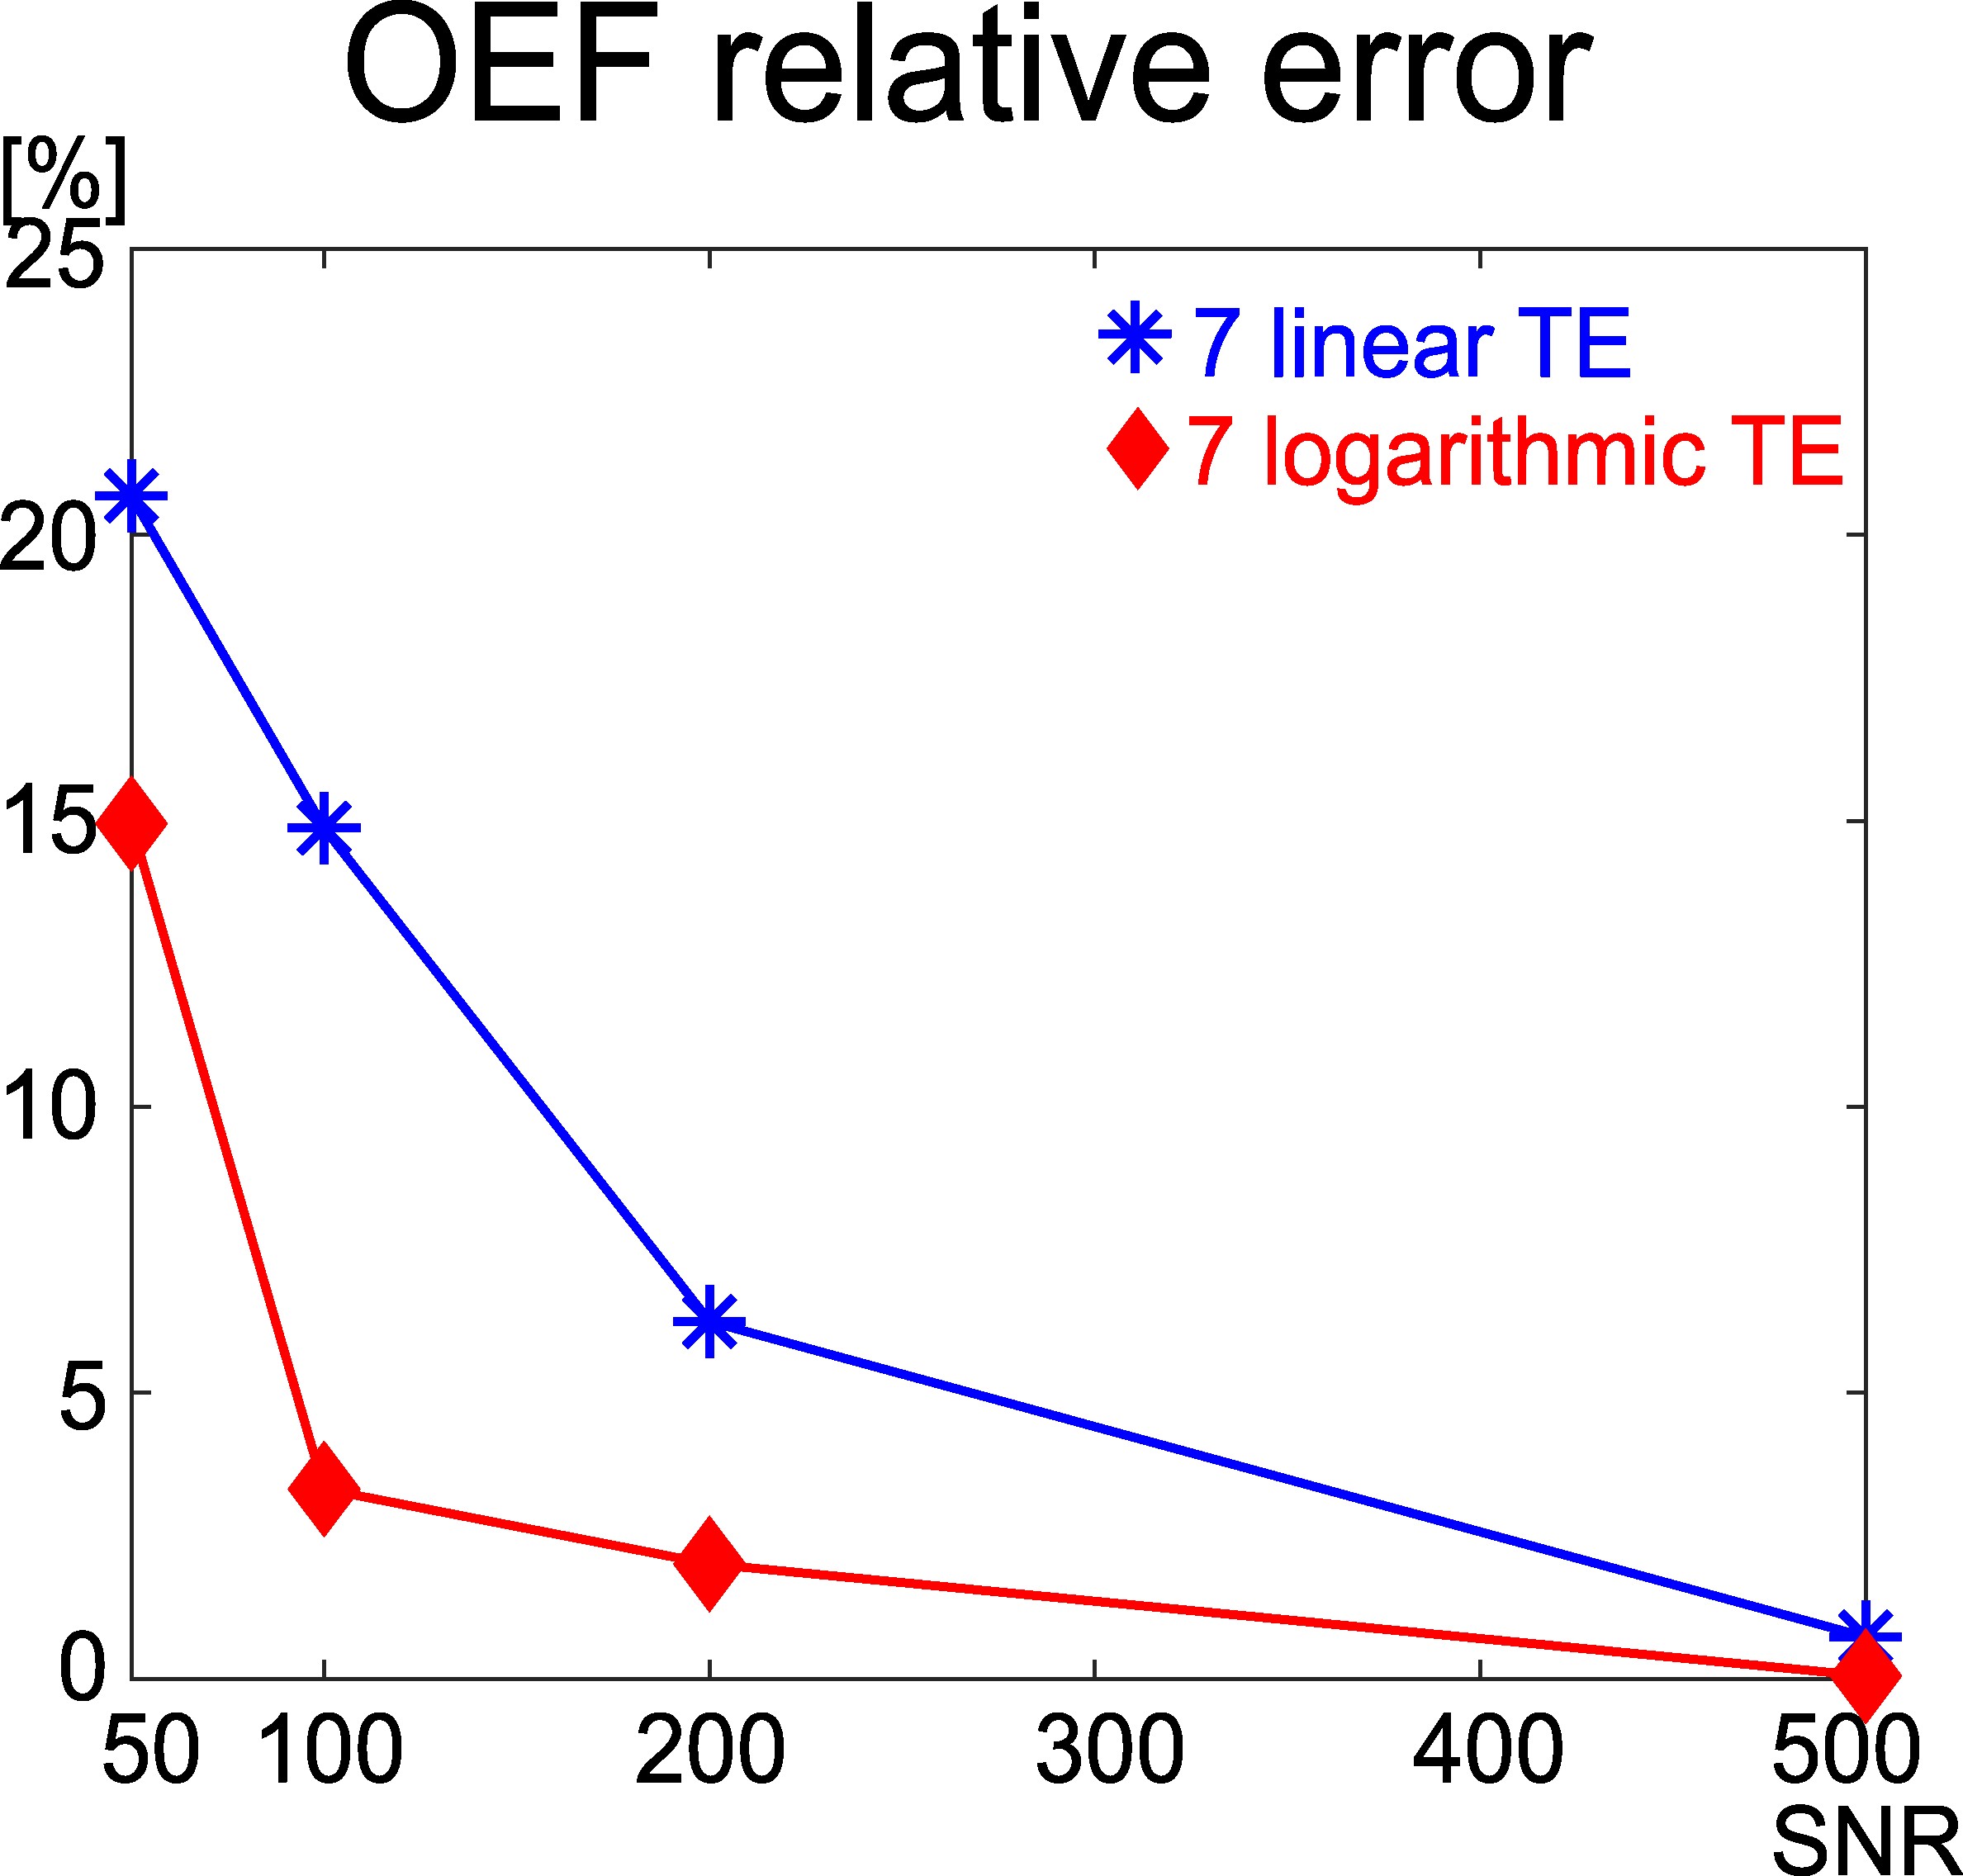
The QSM and mGRE magnitude values were simulated using the equations of $$$F_{QSM}$$$ and $$$F_{qBOLD}$$$ with two TE sets: 7 linear TE and 7 logarithmic TE. The input (ground truth) was chosen based on normal brain tissue values in literature7: $$$Y=60%$$$, $$$v=3%$$$, $$$S_{0}=1000 au$$$, $$$R_2=15 Hz$$$, and $$$\chi_{n}=-0.1 ppm$$$. Gaussian noise was added to the mGRE and QSM to obtain SNR 50, 100, 200, and 500. For each SNR, the optimization was subsequently performed to estimate $$$Y$$$7.This was repeated 500 times for each SNR. A relative error was computed as $$$\frac{\overline{OEF}-OEF_{true}}{OEF_{true}}$$$.
Simulation 2: Detection of OEF abnormality
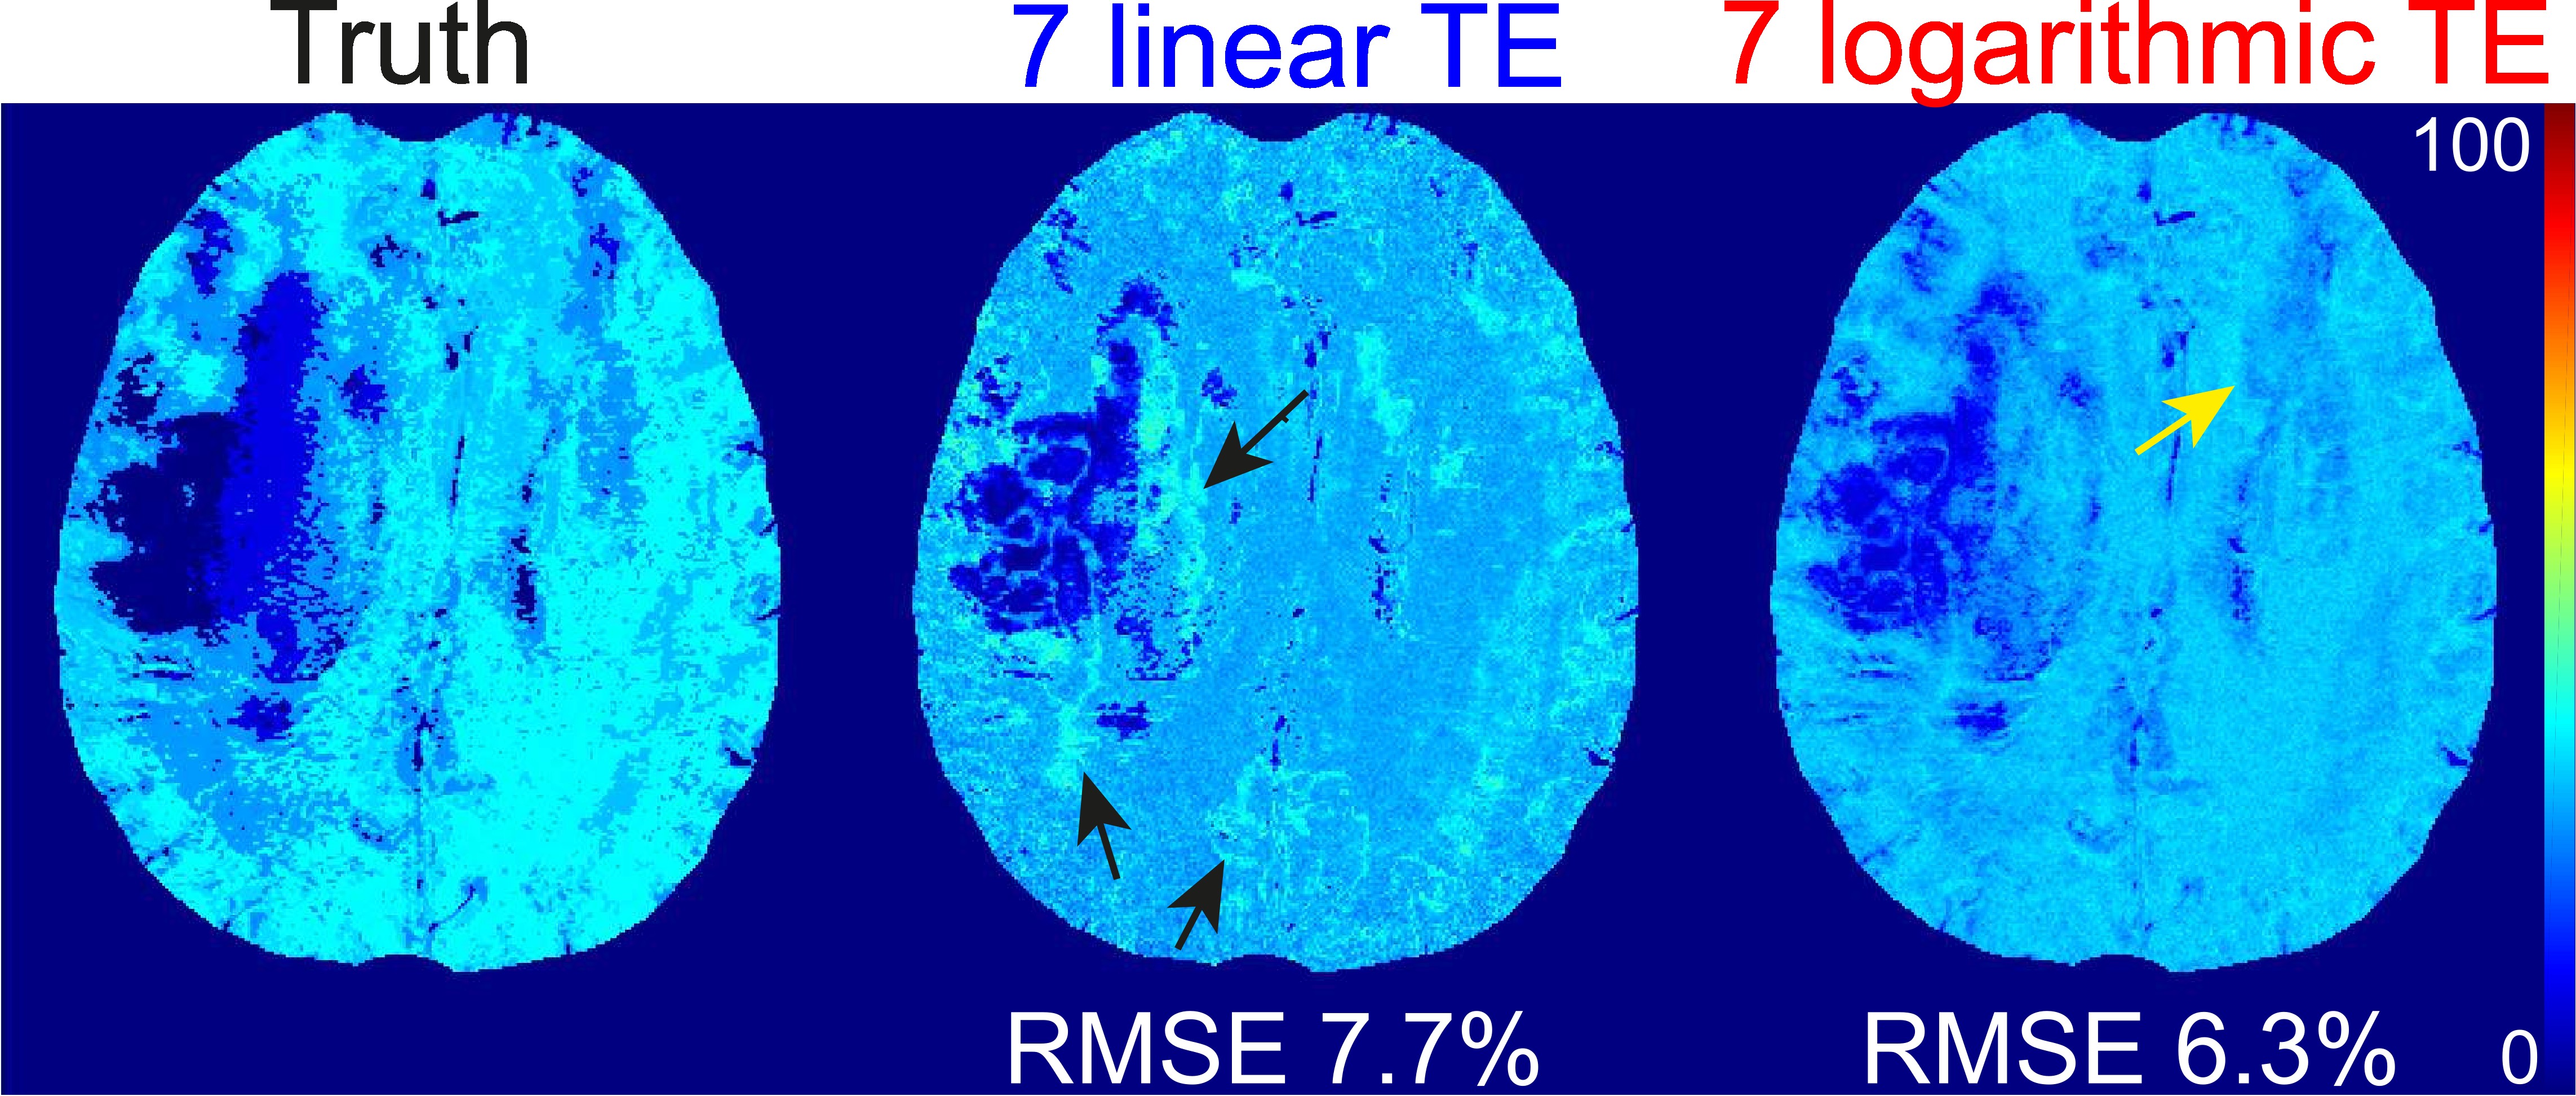
To compare the OEF accuracy between the two TE sets in OEF abnormalities, a stroke brain with low OEF abnormality was used to simulate QSM and mGRE with the two TE sets at SNR 100 (0.94x0.94x3.2 mm3 voxel size, FOV=24 cm), and the optimization was performed using cluster analysis of time evolution algorithm7. Root-mean-square-error (RMSE) was calculated for the error measurement.
Results
A novel mGRE acquisition (7 logarithmic TE) provided a more accurate OEF value with smaller relative errors in all the SNRs in a healthy brain tissue scenario (Simulation 1), compared to a conventional mGRE acquisition, 7 linear TE (Figure 2). The novel mGRE also better identified OEF abnormality (Figure 3), e.g., the conventional mGRE (7 linear TE) provided problematic high OEF values at the periphery of the abnormality (black arrows), whereas the novel mGRE (7 logarithmic TE) correctly identified low OEF regional variation (yellow arrow).Discussion
This study demonstrated the feasibility of a novel mGRE acquisition for accurate OEF estimation in QQ model. More accurate OEF by the novel GRE than conventional mGRE may be driven by better decoupling between $$$Y$$$ and $$$v$$$. More data points in short echo regime, e.g., 2 more echoes within 15 ms in the novel mGRE, may lead to better separation of two distinctive signal behaviors (quadratic and linear behavior in short and long TEs) of qBOLD in QQ, which may result in the improved decoupling. With a straightforward setting in routine mGRE, the novel mGRE can be readily utilized to investigate tissue variability in neurologic disorders including Alzheimer’s disease28, 29 and multiple sclerosis30.Acknowledgements
No acknowledgement found.References
1. Derdeyn CP, Videen TO, Yundt KD, et al. Variability of cerebral blood volume and oxygen extraction: stages of cerebral haemodynamic impairment revisited. Brain : a journal of neurology 2002; 125: 595-607. 2002/03/02.
2. Gupta A, Chazen JL, Hartman M, et al. Cerebrovascular reserve and stroke risk in patients with carotid stenosis or occlusion: a systematic review and meta-analysis. Stroke 2012; 43: 2884-2891. 2012/10/24. DOI: 10.1161/strokeaha.112.663716.
3. Gupta A, Baradaran H, Schweitzer AD, et al. Oxygen Extraction Fraction and Stroke Risk in Patients with Carotid Stenosis or Occlusion: A Systematic Review and Meta-Analysis. American Journal of Neuroradiology 2014; 35: 250-255. DOI: 10.3174/ajnr.A3668.
4. Cho J, Kee Y, Spincemaille P, et al. Cerebral metabolic rate of oxygen (CMRO2) mapping by combining quantitative susceptibility mapping (QSM) and quantitative blood oxygenation level-dependent imaging (qBOLD). Magnetic resonance in medicine 2018; 80: 1595-1604. DOI: doi:10.1002/mrm.27135. 5. Cho J, Spincemaille P, Nguyen TD, et al. Temporal clustering, tissue composition, and total variation for mapping oxygen extraction fraction using QSM and quantitative BOLD. Magnetic resonance in medicine 2021 2021/06/11. DOI: 10.1002/mrm.28875.
6. Cho J, Zhang J, Spincemaille P, et al. QQ-NET - using deep learning to solve quantitative susceptibility mapping and quantitative blood oxygen level dependent magnitude (QSM+qBOLD or QQ) based oxygen extraction fraction (OEF) mapping. Magn Reson Med 2021 2021/11/01. DOI: 10.1002/mrm.29057.
7. Cho J, Zhang S, Kee Y, et al. Cluster analysis of time evolution (CAT) for quantitative susceptibility mapping (QSM) and quantitative blood oxygen level-dependent magnitude (qBOLD)-based oxygen extraction fraction (OEF) and cerebral metabolic rate of oxygen (CMRO2) mapping. 2020; 83: 844-857. DOI: 10.1002/mrm.27967.
8. Hubertus S, Thomas S, Cho J, et al. Comparison of gradient echo and gradient echo sampling of spin echo sequence for the quantification of the oxygen extraction fraction from a combined quantitative susceptibility mapping and quantitative BOLD (QSM+qBOLD) approach. Magnetic resonance in medicine 2019; 82: 1491-1503. 20190602. DOI: 10.1002/mrm.27804.
9. Cho J, Ma Y, Spincemaille P, et al. Cerebral oxygen extraction fraction: Comparison of dual-gas challenge calibrated BOLD with CBF and challenge-free gradient echo QSM+qBOLD. Magnetic resonance in medicine 2021; 85: 953-961. DOI: https://doi.org/10.1002/mrm.28447.
10. Cho J, Lee J, An H, et al. Cerebral oxygen extraction fraction (OEF): Comparison of challenge-free gradient echo QSM+qBOLD (QQ) with 15O PET in healthy adults. Journal of Cerebral Blood Flow & Metabolism 2020: 0271678X20973951. DOI: 10.1177/0271678X20973951.
11. Zhang S, Cho J, Nguyen TD, et al. Initial Experience of Challenge-Free MRI-Based Oxygen Extraction Fraction Mapping of Ischemic Stroke at Various Stages: Comparison With Perfusion and Diffusion Mapping. Frontiers in Neuroscience 2020; 14. Original Research. DOI: 10.3389/fnins.2020.535441.
12. Wu D, Zhou Y, Cho J, et al. The Spatiotemporal Evolution of MRI-Derived Oxygen Extraction Fraction and Perfusion in Ischemic Stroke. Frontiers in Neuroscience 2021; 15. Original Research. DOI: 10.3389/fnins.2021.716031.
13. Cho J, Nguyen TD, Huang W, et al. Brain oxygen extraction fraction mapping in patients with multiple sclerosis. J Cereb Blood Flow Metab 2021: 271678x211048031. 2021/09/25. DOI: 10.1177/0271678x211048031.
14. Shen N, Zhang S, Cho J, et al. Application of Cluster Analysis of Time Evolution for Magnetic Resonance Imaging -Derived Oxygen Extraction Fraction Mapping: A Promising Strategy for the Genetic Profile Prediction and Grading of Glioma. Frontiers in Neuroscience 2021;
15. Original Research. DOI: 10.3389/fnins.2021.736891. 15. Chiang GC, Cho J, Dyke J, et al. Brain oxygen extraction and neural tissue susceptibility are associated with cognitive impairment in older individuals. J Neuroimaging 2022; 32: 697-709. 20220316. DOI: 10.1111/jon.12990.
16. Yang L, Cho J, Chen T, et al. Oxygen extraction fraction (OEF) assesses cerebral oxygen metabolism of deep gray matter in patients with pre-eclampsia. Eur Radiol 2022; 32: 6058-6069. 20220329. DOI: 10.1007/s00330-022-08713-7.
17. Yablonskiy DA and Haacke EM. Theory of NMR signal behavior in magnetically inhomogeneous tissues: the static dephasing regime.
18. Yablonskiy DA, Sukstanskii AL and He X. BOLD-based Techniques for Quantifying Brain Hemodynamic and Metabolic Properties – Theoretical Models and Experimental Approaches. NMR in biomedicine 2013; 26: 963-986. DOI: 10.1002/nbm.2839.
19. Zhang J, Zhou D, Nguyen TD, et al. Cerebral metabolic rate of oxygen (CMRO2) mapping with hyperventilation challenge using quantitative susceptibility mapping (QSM). Magnetic resonance in medicine 2017; 77: 1762-1773. DOI: 10.1002/mrm.26253.
20. An H and Lin W. Cerebral venous and arterial blood volumes can be estimated separately in humans using magnetic resonance imaging. Magnetic resonance in medicine 2002; 48: 583-588. 2002/09/28. DOI: 10.1002/mrm.10257.
21. Zhang J, Cho J, Zhou D, et al. Quantitative susceptibility mapping-based cerebral metabolic rate of oxygen mapping with minimum local variance. Magnetic resonance in medicine 2017 2017/03/16. DOI: 10.1002/mrm.26657.
22. Sakai F, Nakazawa K, Tazaki Y, et al. Regional cerebral blood volume and hematocrit measured in normal human volunteers by single-photon emission computed tomography. Journal of cerebral blood flow and metabolism : official journal of the International Society of Cerebral Blood Flow and Metabolism 1985; 5: 207-213. 1985/06/01. DOI: 10.1038/jcbfm.1985.27.
23. Savicki JP, Lang G and Ikeda-Saito M. Magnetic susceptibility of oxy- and carbonmonoxyhemoglobins. Proceedings of the National Academy of Sciences 1984; 81: 5417-5419.
24. Hoffman R. Hematology: Basic Principles and Practice. Churchill Livingstone, 2005.
25. Spees WM, Yablonskiy DA, Oswood MC, et al. Water proton MR properties of human blood at 1.5 Tesla: magnetic susceptibility, T(1), T(2), T*(2), and non-Lorentzian signal behavior. Magnetic resonance in medicine 2001; 45: 533-542. 2001/04/03.
26. Zhang J, Liu T, Gupta A, et al. Quantitative mapping of cerebral metabolic rate of oxygen (CMRO2) using quantitative susceptibility mapping (QSM). Magnetic resonance in medicine 2015; 74: 945-952. DOI: 10.1002/mrm.25463.
27. Ulrich X and Yablonskiy DA. Separation of cellular and BOLD contributions to T2* signal relaxation. Magnetic resonance in medicine 2016; 75: 606-615. 2015/03/11. DOI: 10.1002/mrm.25610.
28. Sun X, He G, Qing H, et al. Hypoxia facilitates Alzheimer's disease pathogenesis by up-regulating BACE1 gene expression. Proceedings of the National Academy of Sciences of the United States of America 2006; 103: 18727-18732. 2006/11/24. DOI: 10.1073/pnas.0606298103.
29. Acosta-Cabronero J, Williams GB, Cardenas-Blanco A, et al. In vivo quantitative susceptibility mapping (QSM) in Alzheimer's disease. PloS one 2013; 8: e81093. 2013/11/28. DOI: 10.1371/journal.pone.0081093.
30. Trapp BD and Stys PK. Virtual hypoxia and chronic necrosis of demyelinated axons in multiple sclerosis. The Lancet Neurology 2009; 8: 280-291. 2009/02/24. DOI: 10.1016/s1474-4422(09)70043-2.
Figures