4019
Oxygen extraction fraction (OEF) mapping by using multi-delay arterial spin labeling based on QSM+qBOLD1Radiology and Nuclear Medicine, Xuanwu Hospital, Capital Medical University, Beijing 100053, China, Beijing, China, 2GE Healthcare, MR Research China, Beijing, Beijing, China
Synopsis
Keywords: Arterial spin labelling, Metabolism, oxygen extraction fraction
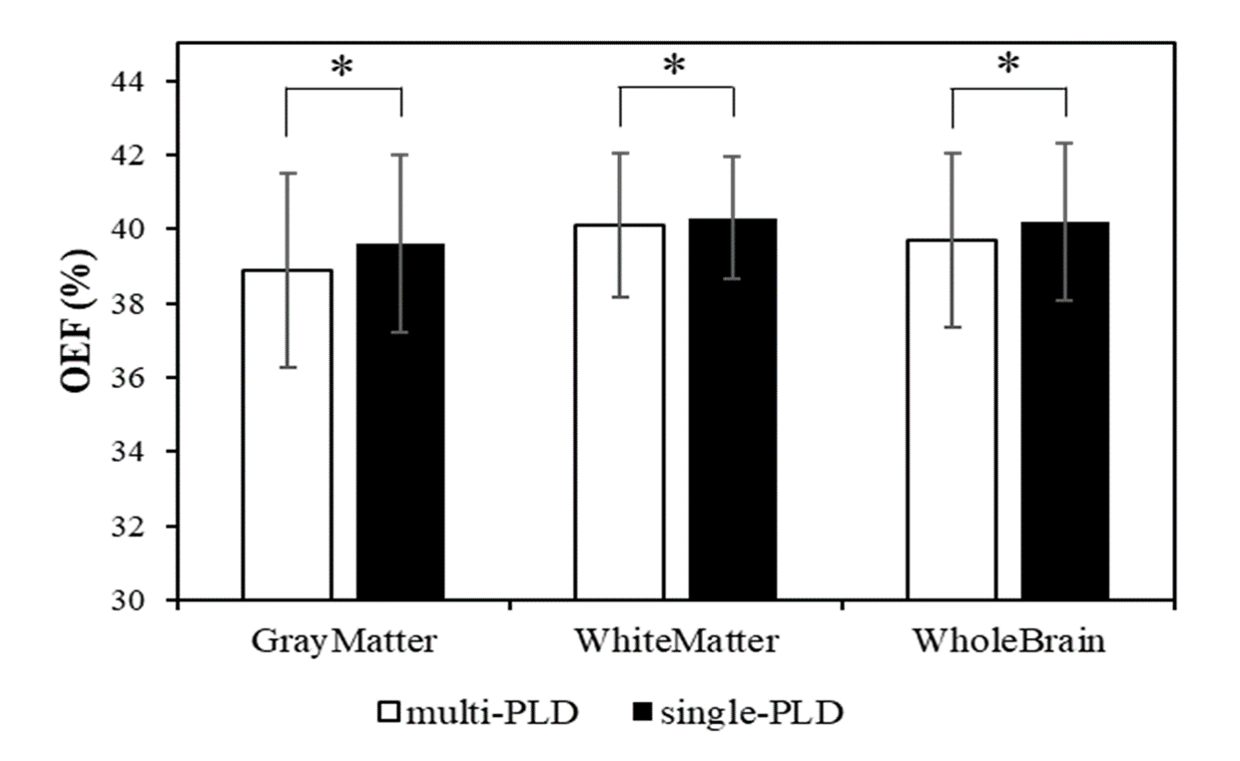
We aimed to improve the accuracy of OEF mapping by using multi-delay arterial spin labeling based on quantitative susceptibility mapping plus quantitative blood oxygen level-dependent magnitude (QSM+qBOLD, or QQ). 3D multi-echo gradient-echo and ASL sequence were performed in 7 healthy subjects. ROIs analysis and paired t-test compared QQ with single-delay ASL and QQ with multi-delay ASL. QQ with multi-delay ASL shows smaller OEFs than QQ with single-delay ASL method. Corresponding OEFs were 38.9±3.4% and 39.6±3.4% (P<0.01) in gray matter, 39.7±2.9% and 40.2±2.9% in whole brain(P<0.01), respectively. Our study suggests that QQ with multi-delay ASL provides more accurate OEF than QQ with single-delay ASL, which may have potential in the use of clinical diseases.Introduction
Oxygen extraction fraction (OEF) is an essential biomarker for evaluating brain tissue vulnerability and function in various disorders such as stroke, lupus, and moyamoya [1-3]. A recent model combined quantitative susceptibility mapping plus quantitative blood oxygen level-dependent magnitude (QSM+qBOLD or QQ) has been used to evaluate OEF using both magnitude and phase of multi-echo gradient echo data [4]. This QQ method enables OEF mapping without vascular challenges, which has great potential in clinical applications. Nonetheless, some studies have pointed out that the accuracy of cerebral blood flow (CBF) quantification with arterial spin labeling (ASL) MRI perfusion is a challenge of OEF mapping [4-6]. Relatively cerebral blood volume (CBV) estimated from CBF by assuming an empirical relationship derived from normative PET data can also be a source of error [7]. Instead, multi-delay ASL can calibrate CBF by predicted arterial transit time (ATT) and calculated mean CBF measured from each post-labeling delay (PLD) [8]. In addition, multi-delay ASL can directly evaluate arterial cerebral blood volume (aCBV), which avoids errors caused by using empirical relationships. Accordingly, we propose to map OEF using multi-delay ASL based on QQ and investigate the differences between QQ with multi-delay ASL method and QQ with single-delay ASL method results.Methods
Seven healthy volunteers underwent a brain MRI on a 3T scanner (Premier, GE Healthcare) using a 48-channel brain receiver coil. MRI was performed in a resting state using a 3D multi-echo spoiled gradient-echo (GRE) sequence, a 3D pseudo-continuous arterial spin labeling sequence (pcASL), and a 3D magnetization-prepared rapid gradient echo sequence (MPRAGE).ASL protocols used pcASL and included both single and multiple PLD acquisitions. The multi-delay ASL data were acquired with 7 PLDs evenly spaced between 0.7 and 4s, and single-delay ASL data were acquired with a PLD of 2.15s. CBF maps (mL/100g/min) were generated from the ASL data using FuncTool (GE Healthcare, Waukesha, WI). QSM reconstruction was performed using STISuite Toolbox. All images were co-registered to the T1 image implemented in SPM12.
ROI analyses and paired t-test were performed to compare OEF values between QQ with single-delay ASL and QQ with multi-delay ASL methods in gray matter (GM), white matter (WM), and whole brain.
Results
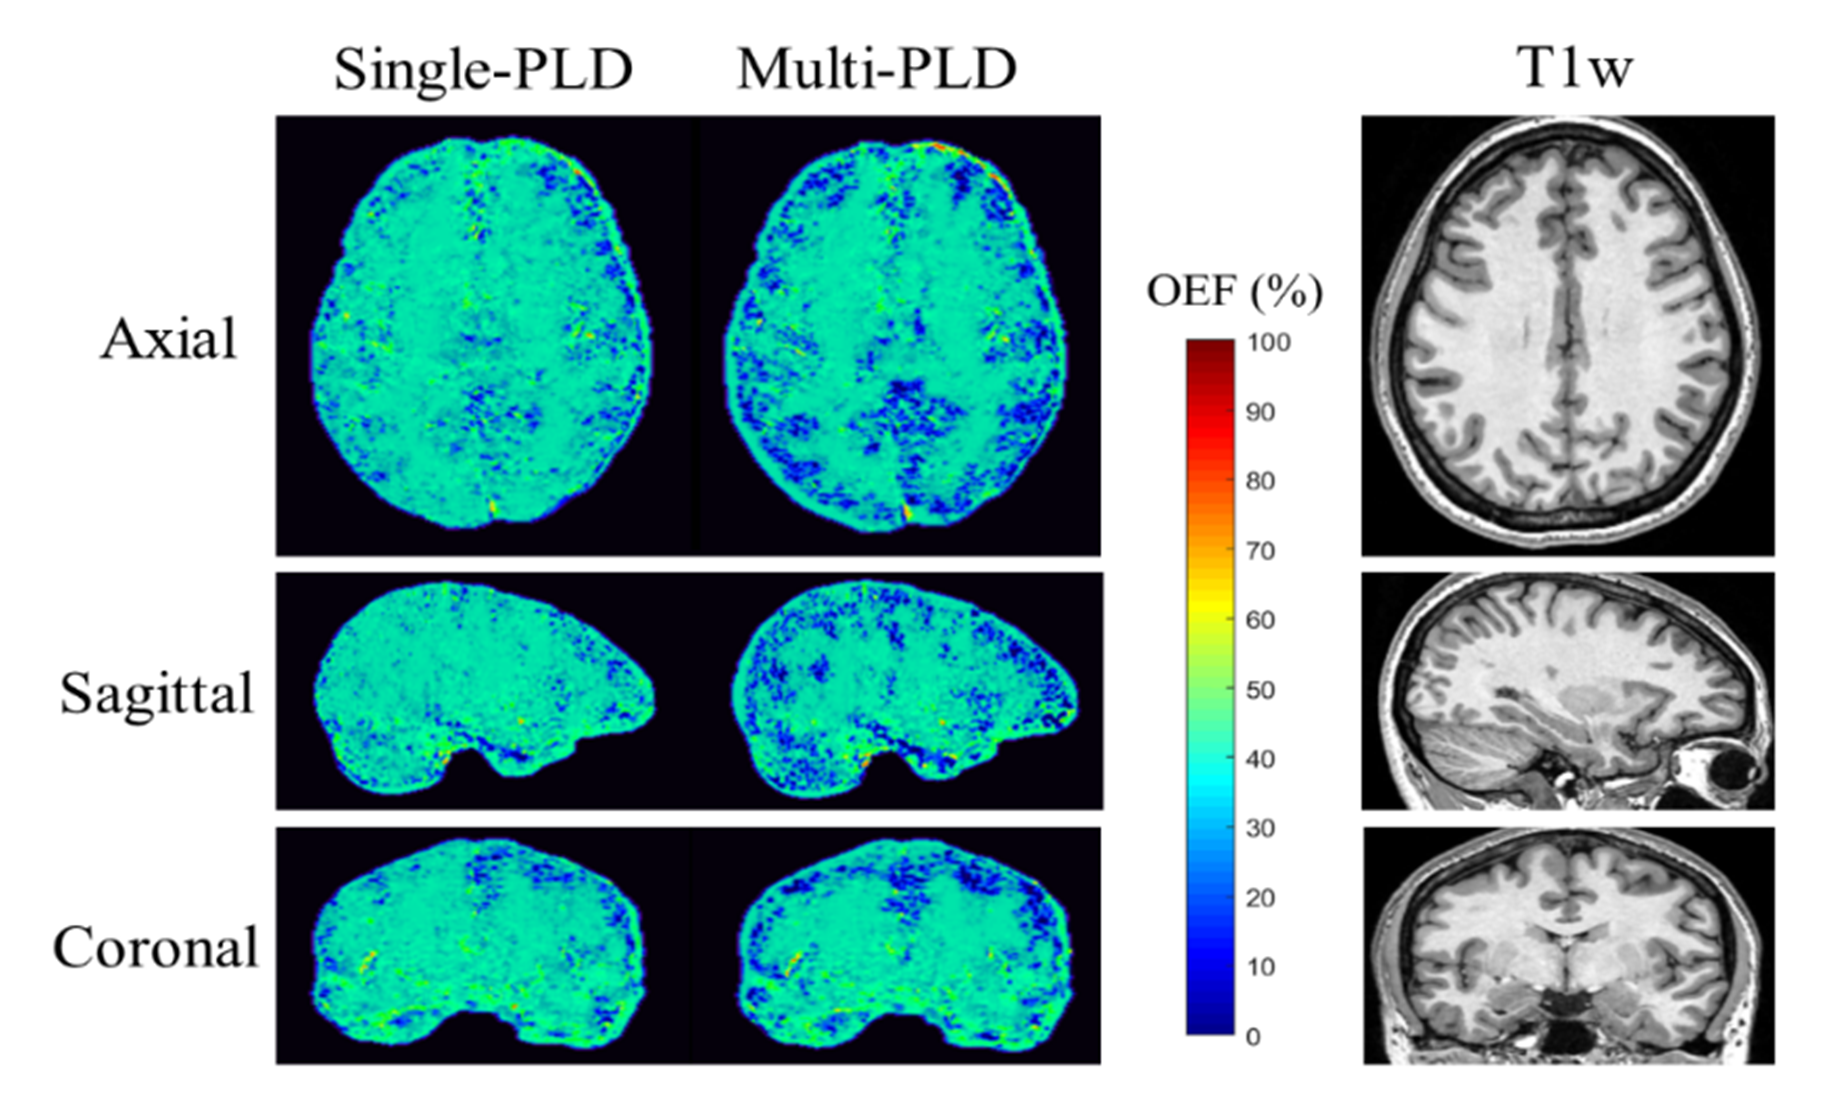
The OEFs in GM were 39.6±3.4% and 38.9±3.4% (P<0.01) for QQ with single-delay ASL and QQ with multi-delay ASL methods. Figure 1 shows OEF maps generated by QQ with single-delay ASL and QQ with multi-delay ASL methods of an exemplar subject. QQ with multi-delay ASL showed lower OEF than QQ with single-delay ASL; the OEF values for the whole brain and WM were 40.2±2.9% and 39.7±2.9% (P<0.01), 40.3±2.1% and 40.2±2.2% (P<0.05) for QQ with single-delay ASL and QQ with multi-delay ASL, respectively. (Figure 2)Discussion
Our results demonstrate the feasibility of OEF mapping by QQ with multi-delay ASL method. The result ties well with previous studies wherein other independent OEF estimation methods, such as PET and vascular challenges QSM methods [6,9-12]. The OEFs in GM were 39.6±3.4% and 38.9±3.4% (P<0.01) for QQ with single-delay ASL and QQ with multi-delay ASL methods. This discrepancy could be attributed to using a directly measured CBV, which in QQ with single-delay ASL method is estimated using empirical relationship derived from normative PET data.There are several limitations in this study that warrant further investigation. First, although QQ with multi-delay ASL removed the linear CBF/CBV assumption in QQ with single-delay ASL, it retains a constant ratio between venous and total blood volume (0.77), which may vary among subjects and diseases. Another limitation is that the contribution of macroscopic field inhomogeneities to the GRE signal has been neglected. This may be addressed by using high-order MR shimming in further study.
Conclusion
Our study demonstrates the feasibility of OEF mapping by QQ with multi-delay ASL method. In healthy subjects, the OEF mapping by QQ with multi-delay ASL shows an accurate value compared to QQ with single-delay ASL method, which may have the potential for the application of OEF to clinical diseases.Acknowledgements
This study was supported by The National Natural Science Foundation of China (81901722).References
[1] Fan AP, Khalil AA, Fiebach JB, et al. Elevated brain oxygen extraction fraction measured by MRI susceptibility relates to perfusion status in acute ischemic stroke. J Cereb Blood Flow Metab. 2020;40(3):539-551.
[2] Leatherday C, Dehkharghani S, Nahab F, et al. Cerebral MR oximetry during acetazolamide augmentation: Beyond cerebrovascular reactivity in hemodynamic failure. J Magn Reson Imaging. 2019;50(1):175-182.
[3] Watchmaker JM, Juttukonda MR, Davis LT, et al. Hemodynamic mechanisms underlying elevated oxygen extraction fraction (OEF) in moyamoya and sickle cell anemia patients. J Cereb Blood Flow Metab. 2018;38:1618-1630.
[4] Cho J, Kee Y, Spincemaille P, et al. Cerebral metabolic rate of oxygen (CMRO2) mapping by combining quantitative susceptibility mapping (QSM) and quantitative blood oxygenation level-dependent imaging (qBOLD). Magn Reson Med. 2018;80(4):1595-1604.
[5] Zhang J, Cho J, Zhou D, et al. Quantitative susceptibility mapping-based cerebral metabolic rate of oxygen mapping with minimum local variance. Magn Reson Med. 2018;79(1):172-179.
[6] Zhang J, Zhou D, Nguyen TD, Spincemaille P, Gupta A, Wang Y. Cerebral metabolic rate of oxygen (CMRO2) mapping with hyperventilation challenge using quantitative susceptibility mapping (QSM). Magn Reson Med. 2017;77(5):1762-1773.
[7] Leenders KL, Perani D, Lammertsma AA, et al. Cerebral blood flow, blood volume and oxygen utilization. Normal values and effect of age [J]. Brain,1990,113 (Pt 1):27-47.
[8] Wang DJ, Alger JR, Qiao JX, et al. Multi-delay multi-parametric arterial spin-labeled perfusion MRI in acute ischemic stroke - Comparison with dynamic susceptibility contrast enhanced perfusion imaging. Neuroimage Clin. 2013;3:1-7. Published 2013 Jul 6. doi:10.1016/j.nicl.2013.06.017
[9] Zhang J, Liu T, Gupta A, et al. Quantitative mapping of cerebral metabolic rate of oxygen (CMRO2) using quantitative susceptibility mapping (QSM) [J]. Magn Reson Med,2015,74(4):945-52.
[10] Ma Y, Sun H, Cho J, et al. Cerebral OEF quantification: A comparison study between quantitative susceptibility mapping and dual-gas calibrated BOLD imaging [J]. Magn Reson Med,2020,83(1):68-82.
[11] Cho J, Lee J, An H, et al. Cerebral oxygen extraction fraction (OEF): Comparison of challenge-free gradient echo QSM+qBOLD (QQ) with 15O PET in healthy adults [J]. J Cereb Blood Flow Metab,2021,41(7):1658-1668.
[12] Ibaraki M, Miura S, Shimosegawa E, et al. Quantification of cerebral blood flow and oxygen metabolism with 3-dimensional PET and 15O: validation by comparison with 2-dimensional PET [J]. J Nucl Med,2008,49: 50–59.Figures