4017
Venous blood oxygenation measurements using TRUST and T2-TRIR during hypoxic and hypercapnic gas challenges1Radiology and Nuclear Medicine, Amsterdam UMC, Amsterdam, Netherlands, 2Biomedical Engineering, University of Southern California, Los Angeles, CA, United States, 3Biomedical Engineering and Physics, Amsterdam UMC, Amsterdam, Netherlands, 4Division of Cardiology, Children's Hospital Los Angeles, University of Southern California, Los Angeles, CA, United States
Synopsis
Keywords: Oxygenation, Oxygenation
TRUST and T2-TRIR can be used to measure venous blood oxygenation (Yv) and oxygen extraction fraction (OEF). T2-TRIR also offers simultaneous blood T1 (T1b) measurements for hematocrit calculation in lieu of invasive blood samples. Here, TRUST and T2-TRIR were compared across a broad Yv range using hypoxic and hypercapnic challenges in healthy volunteers, while T2-TRIR-derived hematocrit estimates were compared with venipuncture results. T2-TRIR- and TRUST-derived Yv and OEF values exhibited a small constant bias (-5.4±3.5% and 6.0±4.0% respectively, both p<0.01) across all stimuli. Hematocrit by venipuncture and from T1b were unbiased but had broad confidence intervals (1.7±6.3%, p=0.20).Introduction
Venous blood oxygenation (Yv) can be derived from venous blood T2 (T2b). Yv measurements enable the estimation of oxygen-extraction fraction (OEF) and, combined with cerebral blood flow, the cerebral metabolic rate of oxygen (CMRO2).1 These biomarkers reflect cerebral oxygen metabolism and are thought to be indicative of tissue viability. T2-Prepared-Blood-Relaxation-Imaging-with-Inversion-Recovery (T2-TRIR) was introduced as an alternative to T2-Relaxation-Under-Spin-Tagging (TRUST) to simultaneously measure T2b and T1b.2 T1b enables hematocrit (Hct) estimation in lieu of invasive blood samples. We previously demonstrated that TRUST and T2-TRIR were equally reproducible, but T2-TRIR-derived T2b values were significantly higher compared to TRUST.3 Here, we further investigated this bias over a broader O2 saturation range using hypoxic and hypercapnic gas challenges in healthy volunteers and validated T2-TRIR-derived Hct estimates versus venipuncture.Methods
Twelve healthy volunteers (4F:8M, age 36±10 years) were scanned on a 3T Philips Achieva system. The scan protocol included five respiratory phases: baseline (room air), mild hypoxia, severe hypoxia, hypercapnia, and recovery (room air) which were performed using a computer-controlled gas blender (RespirAct, Thornhill Research, Toronto, Canada). During mild and severe hypoxia, end-tidal pO2 (EtO2) was targeted at 55 mmHg and 40 mmHg respectively. During hypercapnia, baseline end-tidal pCO2 (EtCO2) was increased by 10 mmHg. Fingertip pulse oximetry (SpO2) and cerebral tissue oxygenation index (TOI) were recorded during the whole measurement. During each phase, TRUST and T2-TRIR scans at the superior sagittal sinus and a phase contrast (PC) scan above the bifurcation of the carotid arteries were acquired. TRUST and T2-TRIR scans were acquired as reported previously using effective echo times of 0, 40, 80, and 160ms.3 Complete blood count was measured by venipuncture.For TRUST data, label and control images were subtracted and the difference signal was fitted to obtain T2b.4 For T2-TRIR data, a dedicated voxel-selection strategy was used, as described previously.3 T1b and T2b were simultaneously fitted using the following model:
$$S=M_0\times\left[(1-(e^{-\frac{eTE}{T2_b}}\times IE))\times e^{-\frac{TI}{T1_b}}\right]$$
From the TRUST- and T2-TRIR-derived T2b values, Yv was calculated using an empirically derived model5:
$$R_2=77.5\times Hct\times(1-Yv)^{2}+27.8\times(1-Yv)^{2}+6.95\times Hct+2.34$$
For Yv calculations, first, Hct from the venipuncture (HctVP) was used for TRUST and T2-TRIR. Additionally, Hct was estimated from T2-TRIR-derived T1b (HctTRIR) using a model by Li et al (2016)6 and used to calculate Yv and OEF from T2-TRIR-derived T2b. OEF was calculated as follows:
$$OEF=\frac{Y_a-Y_v}{Y_a}\times 100\%$$
In which Ya is the arterial oxygenation measured by the pulse oximeter.
HctVP and HctTRIR were compared but only for baseline and recovery scans because the model for HctTRIR requires estimation of Yv.6 At baseline and recovery, Yv was estimated at 65%.6 For the other stimuli, Yv could not be estimated and using Yv from the TRUST or T2-TRIR measurements would indirectly use HctVP.
Flow-weighted mean velocity was calculated from the PC scans. Bland-Altman analysis and repeated measurements ANOVA or Friedman test in case of non-normality were performed. Post-hoc comparisons with baseline values included Bonferroni multiple comparison correction.
Results
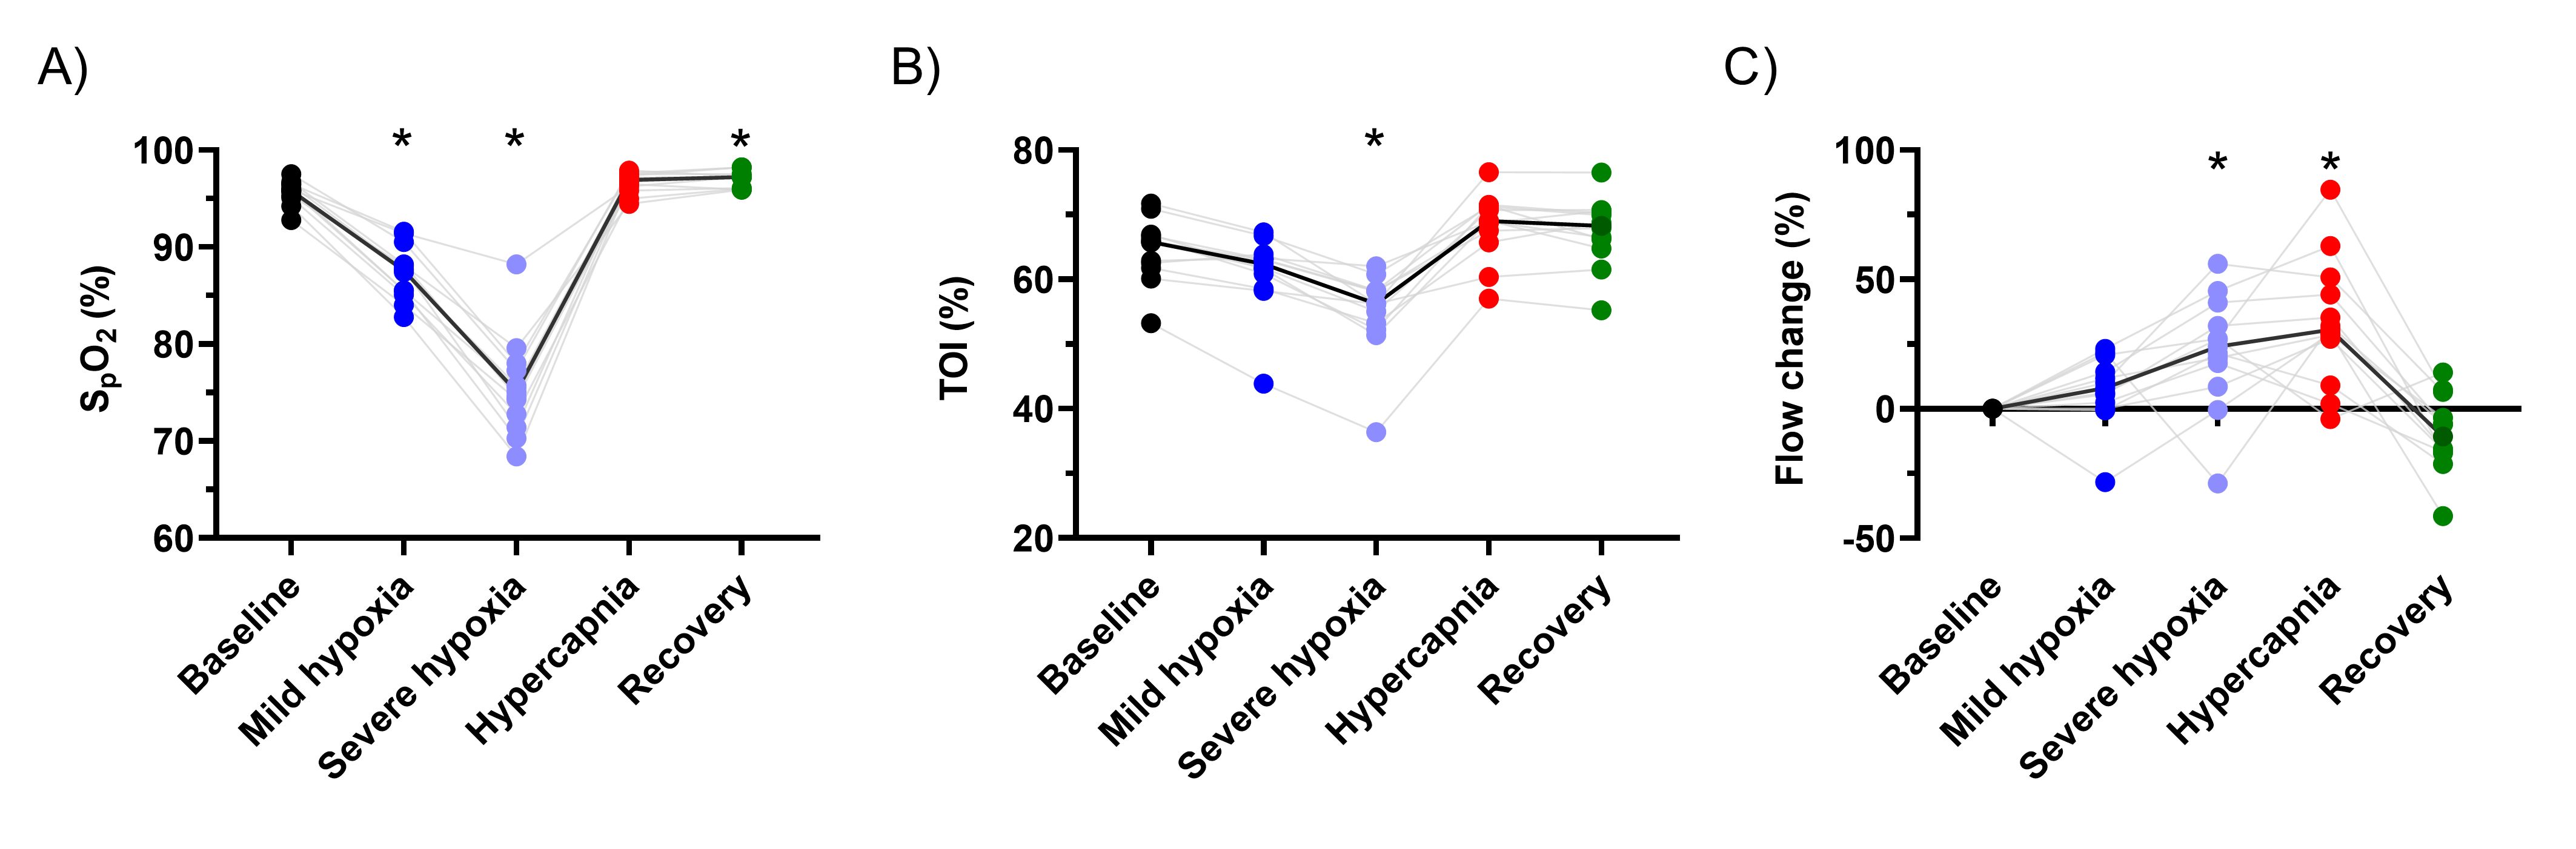
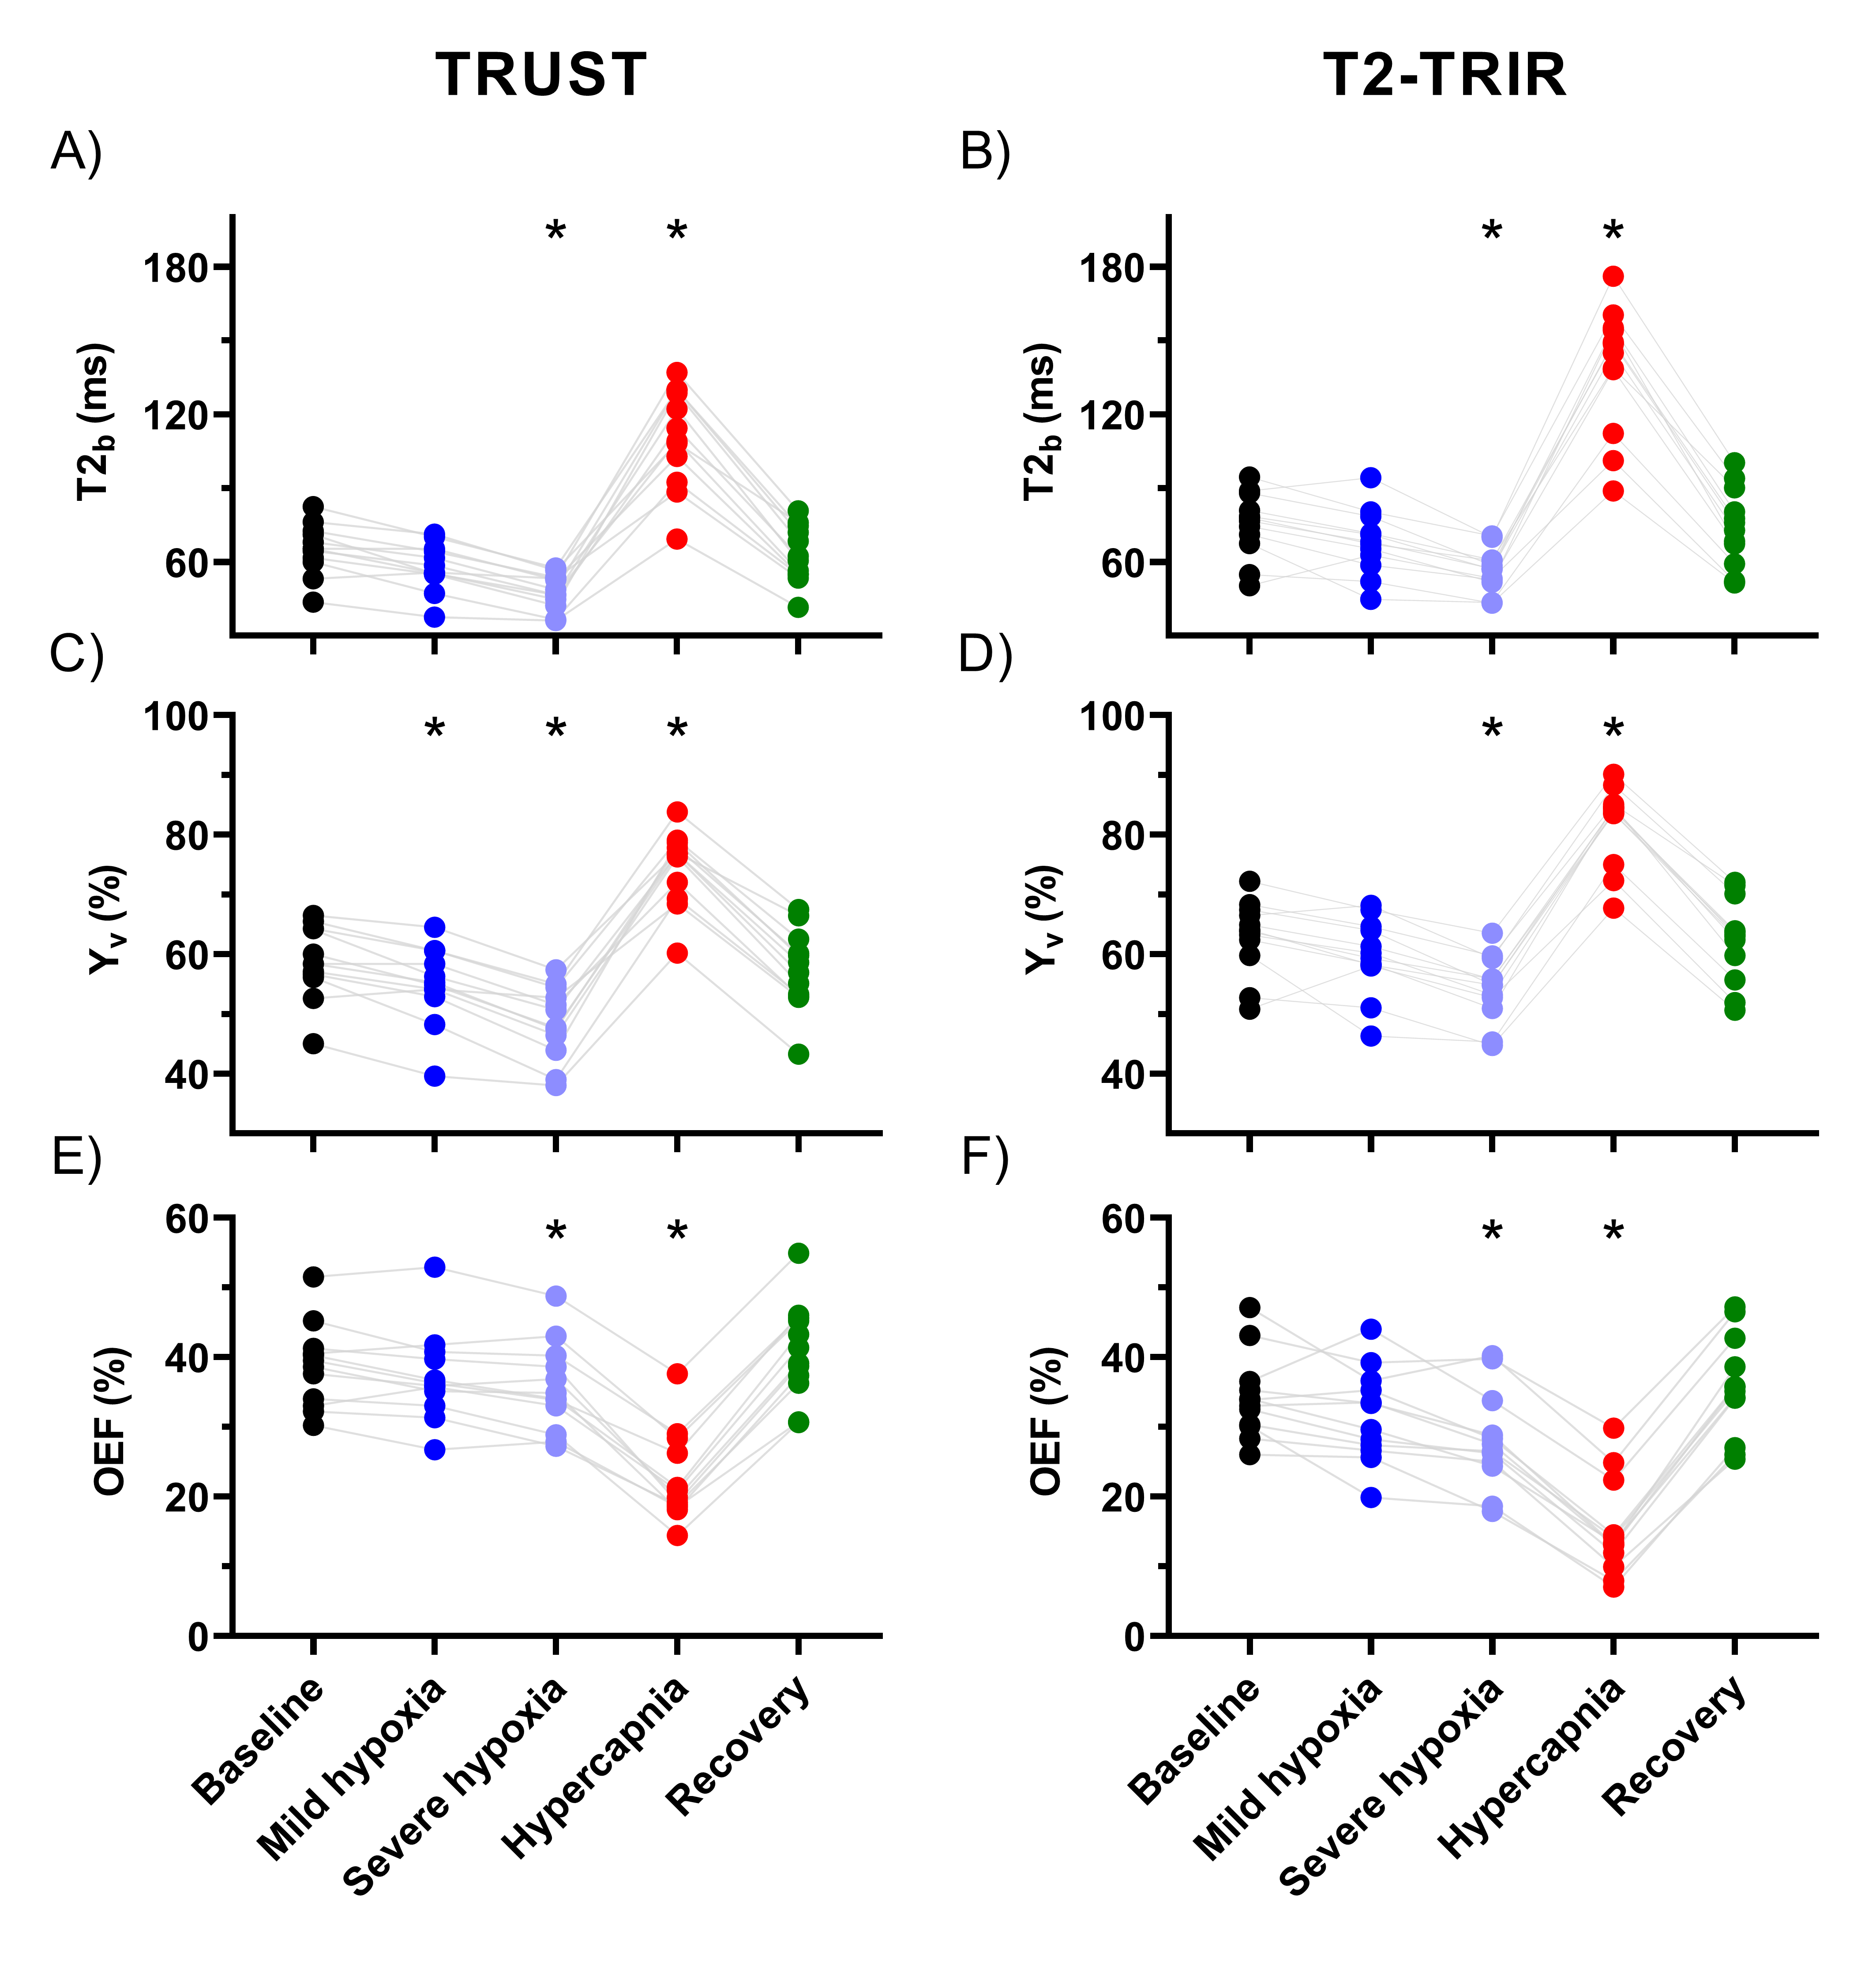
Mean EtO2 and EtCO2 are shown in Figure 1. SpO2, TOI, and blood flow were significantly affected by the respiratory challenges (Figure 2A-C). For one volunteer, SpO2 reduction was smaller presumably due to gas leakage caused by facial hair.During mild hypoxia, T2b, Yv, and OEF were lower compared to baseline but this was only significant for Yv measured by TRUST (p<0.01; Figure 3). During severe hypoxia, T2b, Yv, and OEF further decreased whereas during hypercapnia, T2b and Yv increased and OEF decreased compared to baseline. T2b, Yv, and OEF values were similar at baseline and recovery.
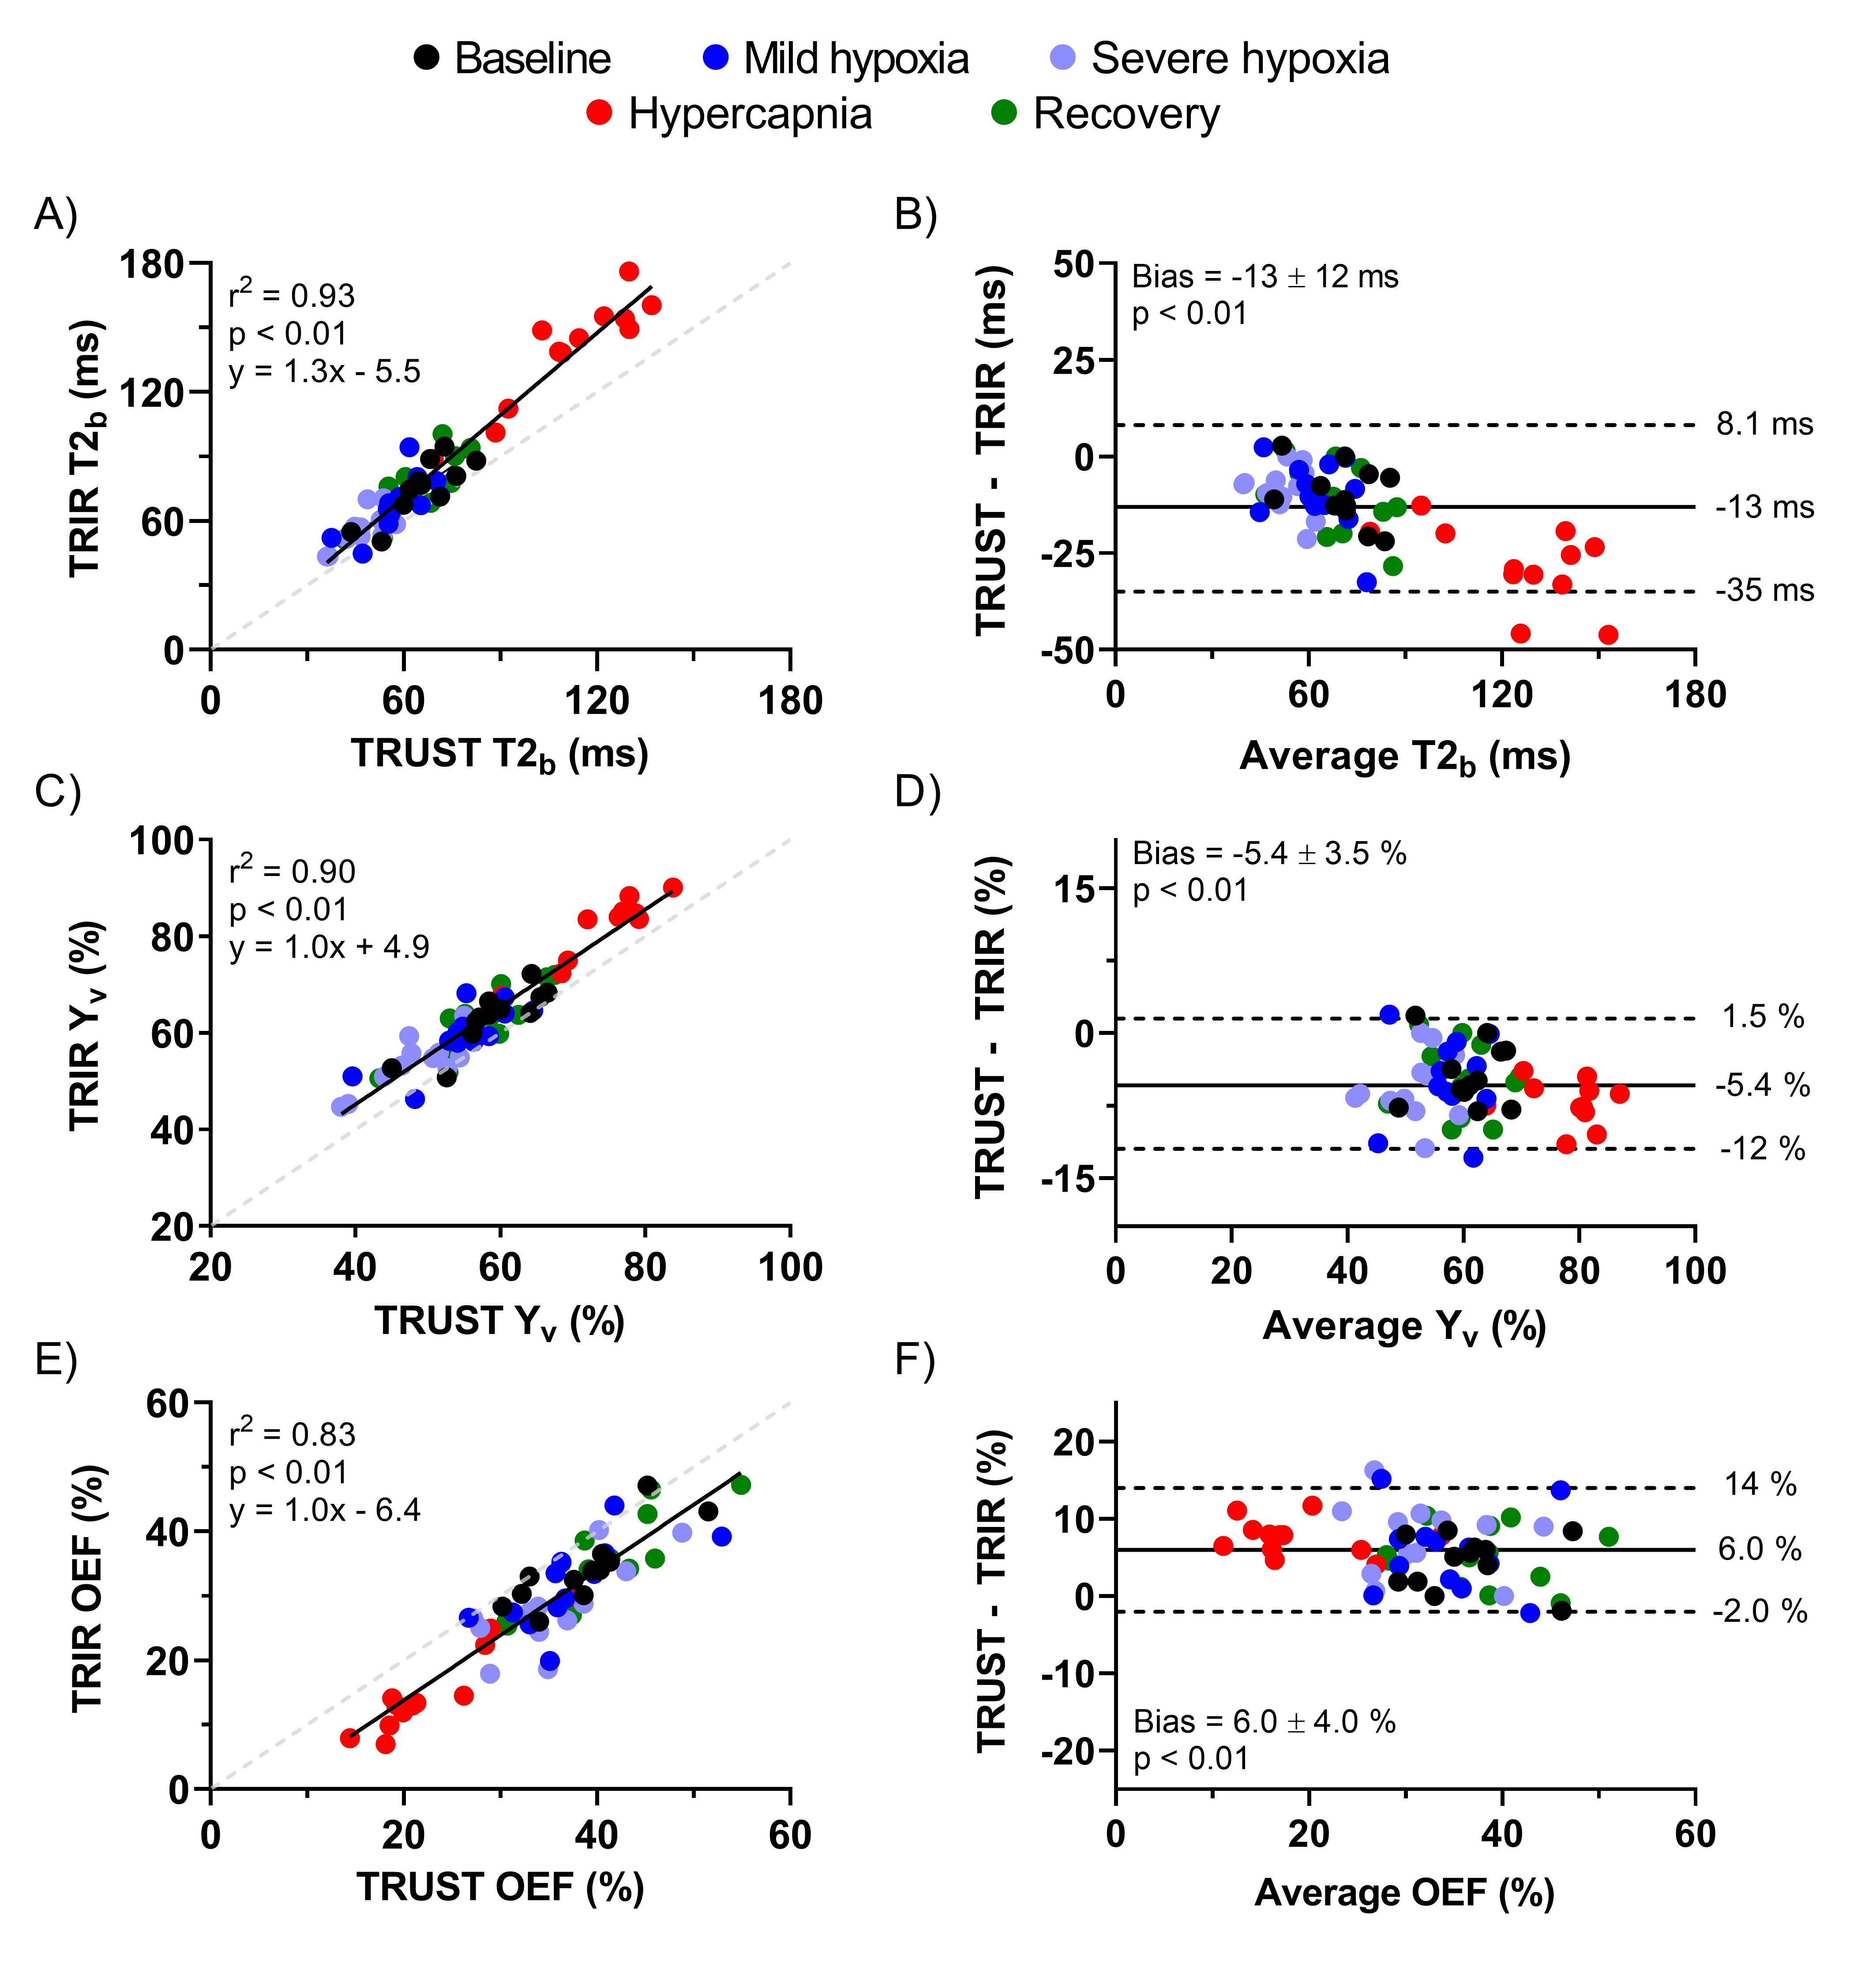
A significant bias was observed between TRUST- and T2-TRIR-derived T2b, Yv, and OEF values (all p<0.01; Figure 4). For Yv and OEF this bias was constant across the range of measured values, indicated by the slopes of 1.0 (confidence interval: 0.92-1.10 and 0.89-1.13).
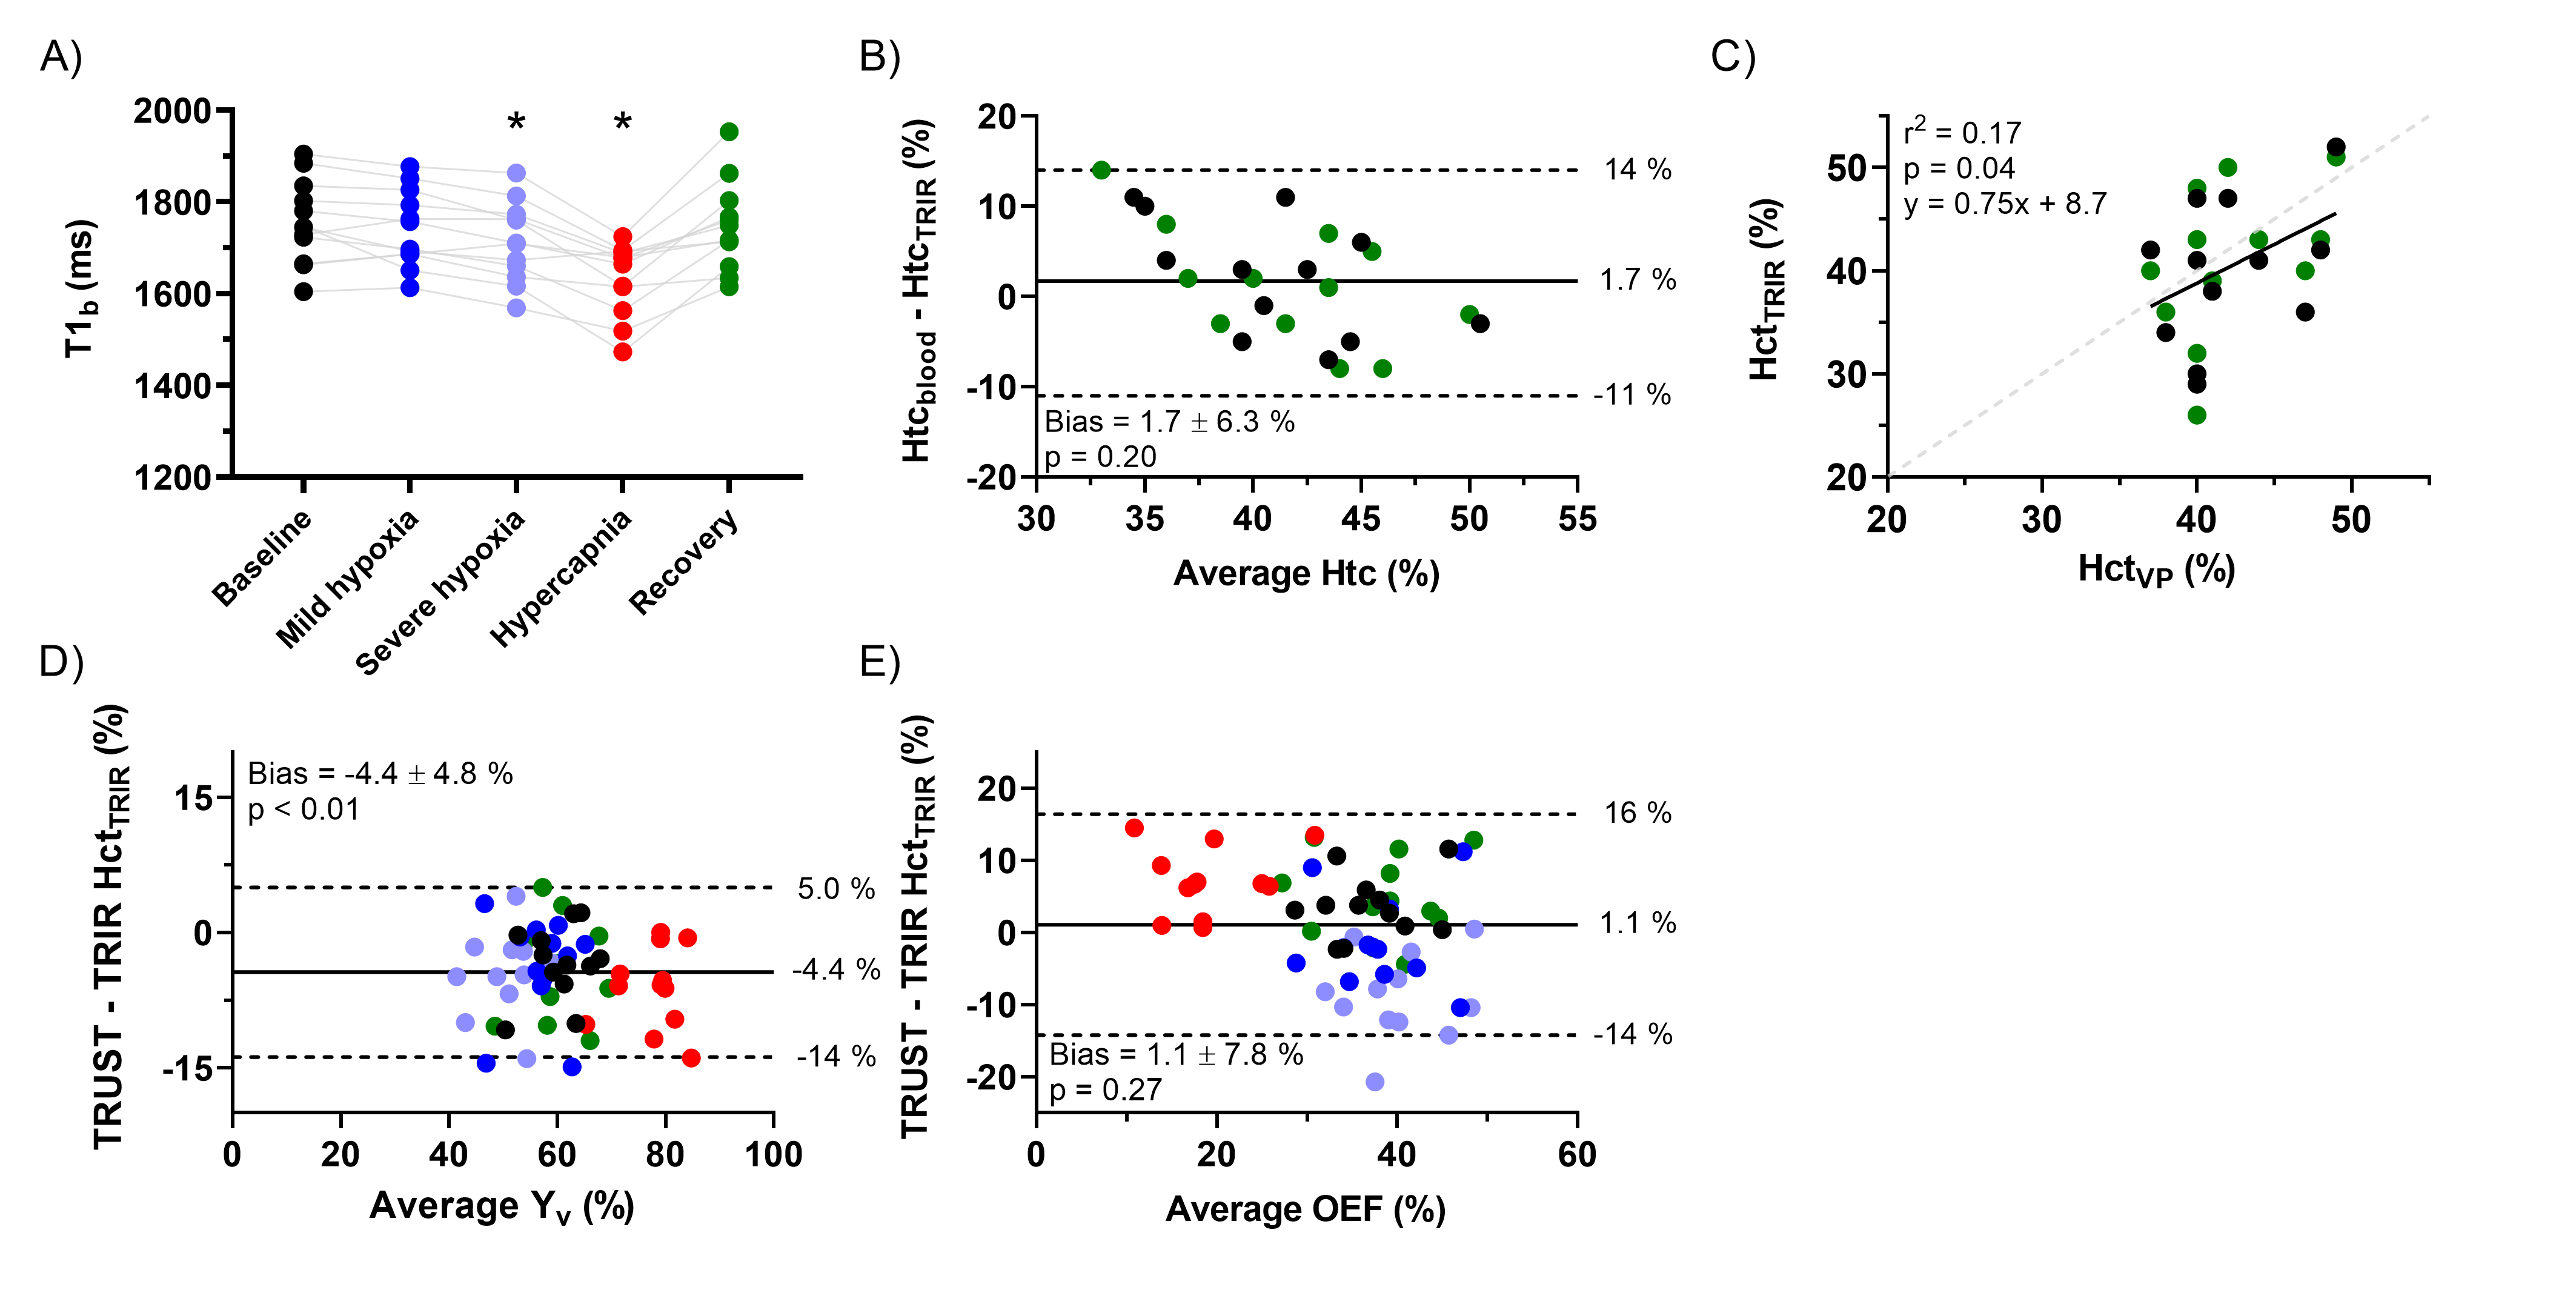
T1b was significantly lower during severe hypoxia and hypercapnia compared to baseline (p=0.02 and p<0.01; Figure 5A). While no significant bias was found between HctVP and HctTRIR (1.7±6.3%, p=0.20; Figure 5B), the observed correlation between these Hct values was only weak (r2=0.17, p=0.04; Figure 5C). Using HctTRIR to calculate T2-TRIR-derived Yv and OEF, the bias between the two techniques to estimate Yv and OEF became more variable (Figure 5D+E).
Discussion
TRUST and T2-TRIR can be used interchangeably for Yv and OEF estimation as long as the fixed bias is corrected. The observed variance of the differences between the two techniques is comparable to the previously reported repeated measures variance of either one.3 However, when replacing venipunctures with T2-TRIR-derived Hct, the uncertainty between the techniques becomes larger, especially for OEF. The source of uncertainty in HctTRIR estimates remains unknown. The reduction of T1b with hypoxia was expected because of the shorter T1 of deoxygenated hemoglobin.6 Surprisingly, T1b reduced further during hypercapnia which could be caused by a pH effect7 or flow-related artefacts.Conclusion
In conclusion, T2-TRIR- and TRUST-derived Yv and OEF values can be compared because of their constant bias across a wide range of values. Using T2-TRIR, Yv and OEF can be estimated without a venipuncture but the uncertainty grows noticeably. Additionally, Hct can be estimated from T2-TRIR-derived T1b values but further validation with blood samples is still needed.Acknowledgements
This work was supported by the National Heart, Lung, and Blood Institute (1R01-HL136484-01A1).References
1. Xu F, Ge Y, Lu H. Noninvasive quantification of whole-brain cerebral metabolic rate of oxygen (CMRO2) by MRI. Magn Reson Med. 2009;62(1):141-148. doi:10.1002/mrm.21994
2. Petersen ET, De Vis J, Alderliesten T, et al. Simultaneous OEF and Haematocrit assessment using T2 Prepared Blood Relaxation Imaging with Inversion Recovery. Proc 20th Annu Meet ISMRM, Melb. Published online 2012:Abstract 472.
3. Baas KPA, Coolen BF, Petersen ET, et al. Comparative Analysis of Blood T2 Values Measured by T2-TRIR and TRUST. J Magn Reson Imaging. 2022;56(2):516-526. doi:10.1002/jmri.28066
4. Lu H, Ge Y. Quantitative evaluation of oxygenation in venous vessels using T2-relaxation-under-spin-tagging MRI. Magn Reson Med. 2008;60(2):357-363. doi:10.1002/mrm.21627
5. Bush A, Borzage M, Detterich J, et al. Empirical model of human blood transverse relaxation at 3 T improves MRI T2 oximetry. Magn Reson Med. 2017;77(6):2364-2371. doi:10.1002/mrm.26311
6. Li W, Grgac K, Huang A, et al. Quantitative theory for the longitudinal relaxation time of blood water. Magn Reson Med. 2016;76(1):270-281. doi:10.1002/mrm.25875
7. Rane S, Gore JC. Measurement of T1 of human arterial and venous blood at 7T Magn Reson Imaging. 2013;31(3):477-479. doi:10.1016/j.mri.2012.08.008
Figures
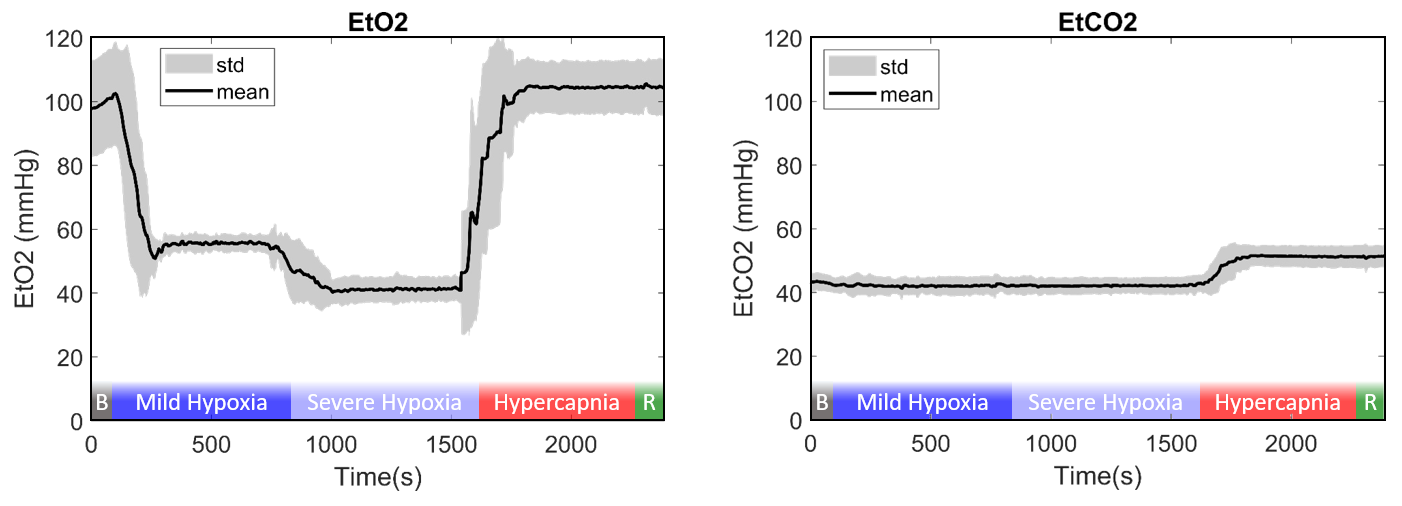
Figure 1: Mean and standard deviation EtO2 and EtCO2 during the end of baseline, mild hypoxia, severe hypoxia, hypercapnia, and beginning of recovery. “B” and “R” indicate the baseline and recovery phase. No measurements were taken during the rest of the baseline or recovery phase to reduce gas usage.