4016
Deuterated trityl spin probe for in vivo pO2 imaging with improved precision using Time-Domain EPR1NCI, Bethesda, MD, United States
Synopsis
Keywords: Oxygenation, Cancer
Due to the narrow linewidth and slower signal decay, it was expected that Ox071 is suitable for wide range pO2 estimation. In this work, we present our first 3D in vivo EPR oximetry using Ox071 in comparison with Ox063. EPR imaging of MIA Paca-2 tumor and healthy kidneys were performed on successive days by using either Ox071 or Ox063, resulting in similar spin density, pO2 maps, and pO2 histograms in the tumor regions and more homogeneous pO2 profile with Ox071 in kidney compared with Ox063. The result suggested that Ox071 is applicable for oximetry in tissue at higher pO2.Purpose
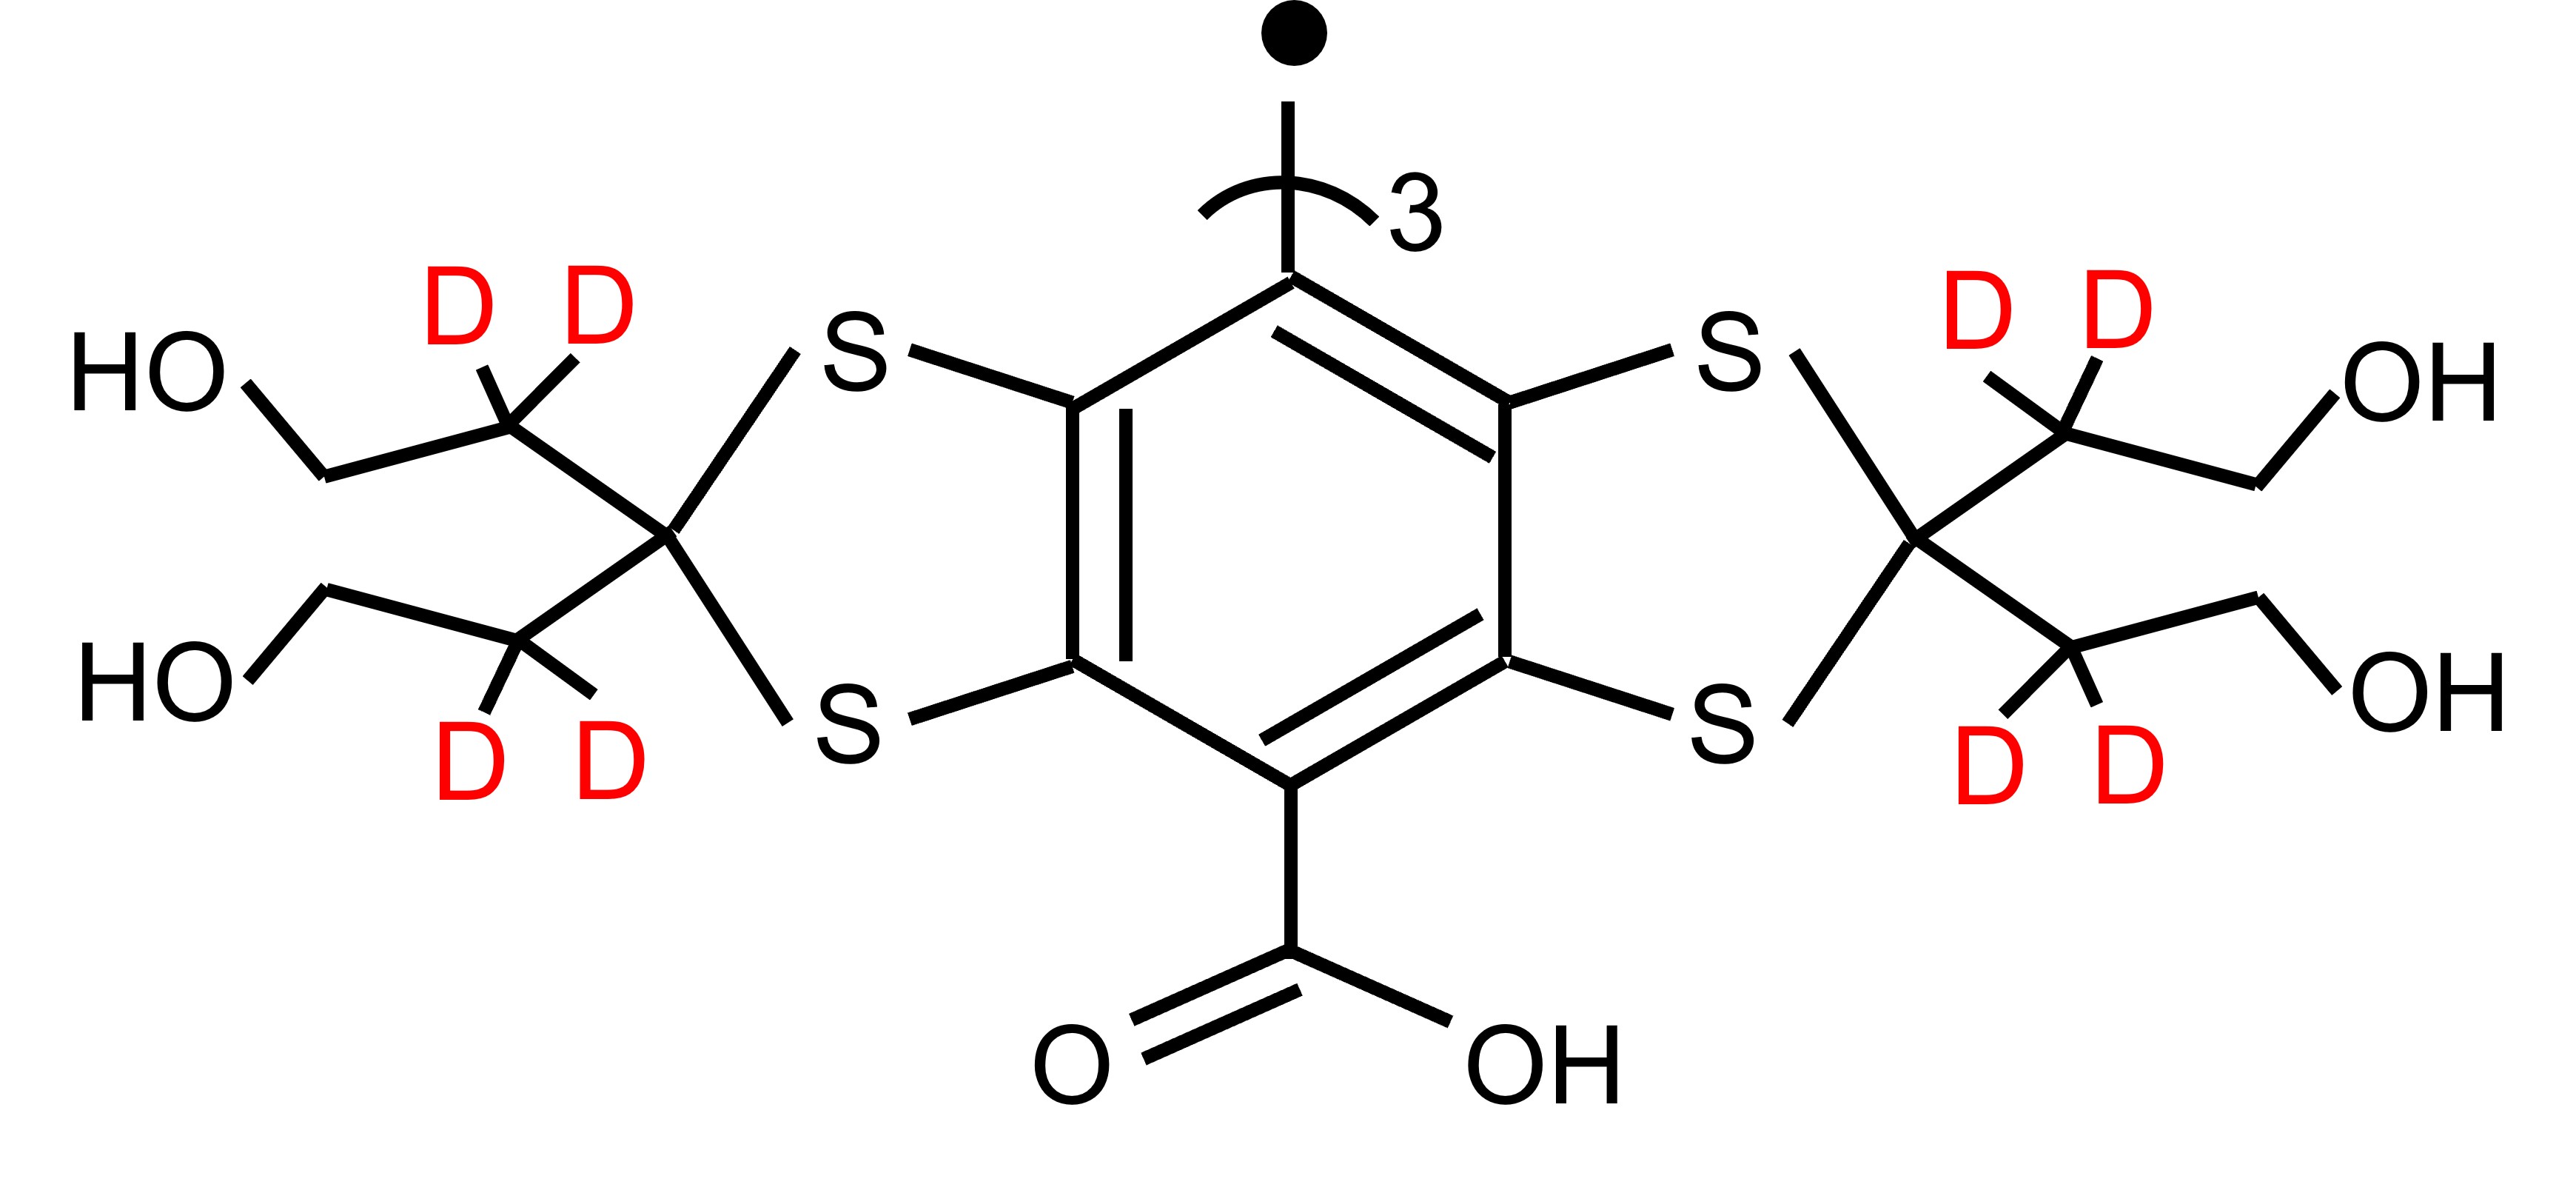
Time Domain (TD) EPR imaging using the triarylmethyl (TAM) radicals offers fast scan of pO2 maps in vivo(1,2). In our laboratory, routine scans of pO2 maps were performed by measuring the R2* of Ox063 spin probe in single point imaging (SPI) modality(3-6). The extremely narrow line of Ox063 without splitting was ideal for the EPR imaging and it was realized by designing the location of unpaired electron more than five bonds away from magnetic nuclei. Ox071 is designed to make the line even narrower by replacing proton with deuterium as indicated in Figure1(7,8). In a preceding study, we have shown that Ox071 spin probe may be used for pO2 estimation by measuring either R1 or R2*. Although R1 based pO2 estimation provided relatively better resolution of pO2 in standard solutions equilibrated with 0, 2, 5%, it required longer scan time, which resulted in higher energy absorption rate(9). Thus, we decided to evaluate in vivo pO2 estimation using R2* based oximetry. In this work, we present our first 3D in vivo oximetry study using Ox071 spin probe by SPI modality.Methods
Acquisition of calibration dataThe spectral and imaging data were scanned on a home-built time-domain EPR imager operating at 300 MHz(1). The pO2 calibration experiments were performed using 2 mM Ox071 aqueous solutions filled in glass tubes and equilibrated at 5 oxygen levels (0%, 2%, 5%,10%, and 21%). The concentration calibration experiments were done using 1, 2, 5, and 10 mM Ox071 solutions filled in separate glass tubes and equilibrated at 0% oxygen. Oxygen levels were achieved by bubbling the appropriate O2 and N2 gas mixtures or argon into the sample for about 45 min. Time-domain EPR signals were recorded by p/2 pulse sequence at repetition time (TR) of 8 and 40 ms at ambient temperature.
In Vivo Imaging
Either Ox071 or Ox063 solution at 75 mM concentration was administered through tail vein cannulation by giving a bolus of 1.125 mmol/g body weight. Images were acquired in the xz plane, which corresponds to the sagittal plane on the mouse leg or body. For comparison between Ox063 and Ox071, EPR scans were performed using the same mouse on successive days in tumor imaging study. Image formation and pO2 map calculations were done using in-house developed MATLAB scripts. The estimation of pO2 maps were done by multi-gradient method using gradient maxima of 14, 11.4, and 9.6 mT/m. The mouse 3D imaging data were acquired at 19 x 19 x 19 Cartesian grid and the image reconstruction was done at 96 x 96 x 96 grid by zero-filling the k-space matrix.
Results and Discussion
MIA Paca-2 tumor oximetryAn imaging experiment of a MIA PaCa-2 tumor implanted in a mouse hind leg was performed using both Ox071 and Ox063 spin probes on successive days respectively. The zero gradient signal intensities from imaging data are compared in Figure 3A. The signal level of Ox071 appears to be approximately twice stronger and lasts twice longer when compared to Ox063. The R2* map was calculated from 12 delay time points starting from 0.75 μs at 30 ns intervals. The pO2 map was calculated from R2* using the calibration parameters estimated from phantom studies (Fig.2). The isosurfaces of Ox063 and Ox071 display overall shape of the tumor leg (Figure 3B) based on probe distribution. In case of Ox063, two regions showed lack of probe distribution (cavities), which were not visible in the isosurface of Ox071. The cross sections of spin density (S0) and pO2 maps of the tumor at a selected slice were shown in Figure 3C. The spin density maps of Ox071 and Ox063 had remarkable similarities. In both cases, there are about 6 high intensity regions (peaks) distributed in a circular manner, but are more diffuse in Ox063 than in Ox071. The pO2 maps assessed by Ox063 and Ox071 also appear to be similar displaying five high pO2 regions distributed circularly within the tumor.
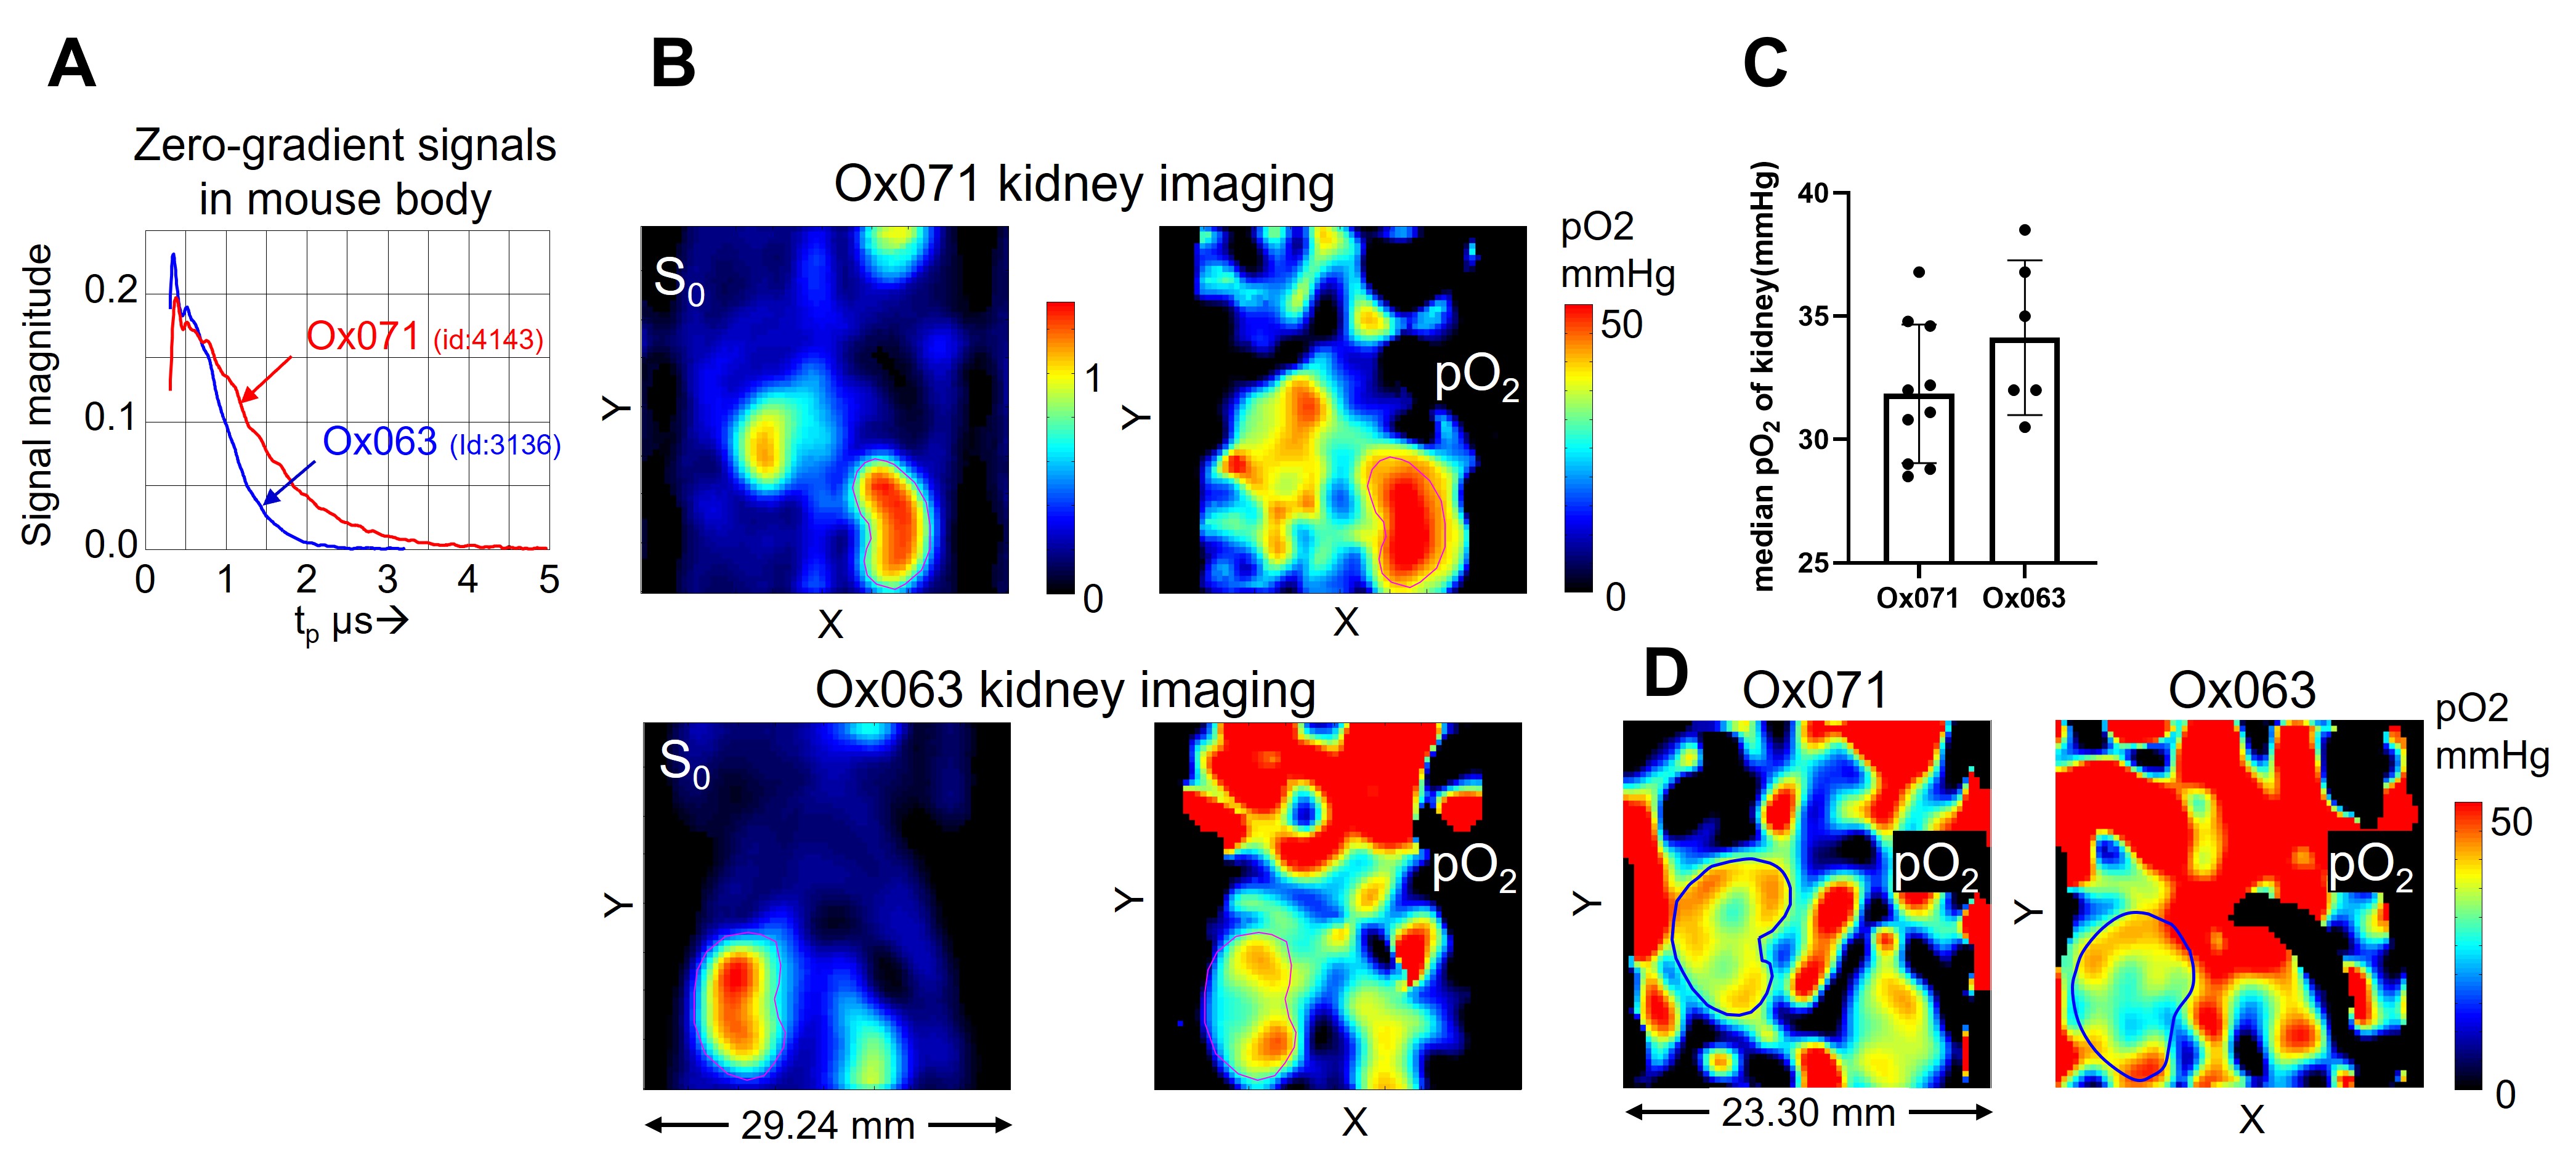
Kidney oximetry
Zero gradient signal intensities from both imaging data are compared in Figure 4A. The signal level from Ox071 appeared to be approximately equal to Ox063 at 0.68 µs but remained high at tp > 0.7 µs and lasted longer compared to Ox063. The pO2 profile showed homogeneous in Ox071 oximetry, while it was less homogeneous in Ox063 oximetry as shown in Figure 4B. Both didn’t match the actual pO2 distribution and it was considered the result of poor spatial resolution (1.6 mm). Figure 4C shows median voxel pO2 values of kidneys of 5 mice estimated using Ox071 and 3 mice estimated using Ox063. The mean (±standard deviation) of pO2 values estimated by Ox071 and Ox63 respectively are 31.6 (±2.8) and 34.1 (±3.1) and their difference was not significant (p = 0.156).
The same set of data were processed using a later tp value to improve the spatial resolution (1.2 mm). Fig 4D shows the comparison between Ox071 and Ox063 kidney oximetry. Although still vague, the Ox071 oximetry showed the pO2 gradient between cortex and medulla/renal pelvis better than Ox063 oximetry. These results suggested that Ox071 oximetry was more accurate and reliable than Ox063 oximetry for kidney imaging.
Acknowledgements
No acknowledgement found.References
1. Matsumoto K, Subramanian S, Devasahayam N, Aravalluvan T, Murugesan R, Cook JA, Mitchell JB, Krishna MC. Electron paramagnetic resonance imaging of tumor hypoxia: enhanced spatial and temporal resolution for in vivo pO2 determination. Magn Reson Med 2006;55(5):1157-1163.
2. Ardenkjaer-Larsen JH, Laursen I, Leunbach I, Ehnholm G, Wistrand LG, Petersson JS, Golman K. EPR and DNP properties of certain novel single electron contrast agents intended for oximetric imaging. J Magn Reson 1998;133(1):1-12.
3. Kishimoto S, Brender JR, Chandramouli GVR, Saida Y, Yamamoto K, Mitchell JB, Krishna MC. Hypoxia-Activated Prodrug Evofosfamide Treatment in Pancreatic Ductal Adenocarcinoma Xenografts Alters the Tumor Redox Status to Potentiate Radiotherapy. Antioxid Redox Signal 2021;35(11):904-915.
4. Kishimoto S, Bernardo M, Saito K, Koyasu S, Mitchell JB, Choyke PL, Krishna MC. Evaluation of oxygen dependence on in vitro and in vivo cytotoxicity of photoimmunotherapy using IR-700-antibody conjugates. Free Radic Biol Med 2015;85:24-32.
5. Brender JR, Saida Y, Devasahayam N, Krishna MC, Kishimoto S. Hypoxia Imaging As a Guide for Hypoxia-Modulated and Hypoxia-Activated Therapy. Antioxid Redox Signal 2022;36(1-3):144-159.
6. Seki T, Saida Y, Kishimoto S, Lee J, Otowa Y, Yamamoto K, Chandramouli GV, Devasahayam N, Mitchell JB, Krishna MC, Brender JR. PEGPH20, a PEGylated human hyaluronidase, induces radiosensitization by reoxygenation in pancreatic cancer xenografts. A molecular imaging study. Neoplasia 2022;30:100793.
7. Poncelet M, Huffman JL, Khramtsov VV, Dhimitruka I, Driesschaert B. Synthesis of hydroxyethyl tetrathiatriarylmethyl radicals OX063 and OX071. RSC Adv 2019;9(60):35073-35076.
8. Epel B, Halpern HJ. In Vivo pO2 Imaging of Tumors: Oxymetry with Very Low-Frequency Electron Paramagnetic Resonance. Methods Enzymol 2015;564:501-527.
9. Matsumoto KI, Kishimoto S, Devasahayam N, Chandramouli GVR, Ogawa Y, Matsumoto S, Krishna MC, Subramanian S. EPR-based oximetric imaging: a combination of single point-based spatial encoding and T1 weighting. Magn Reson Med 2018;80(5):2275-2287.
Figures
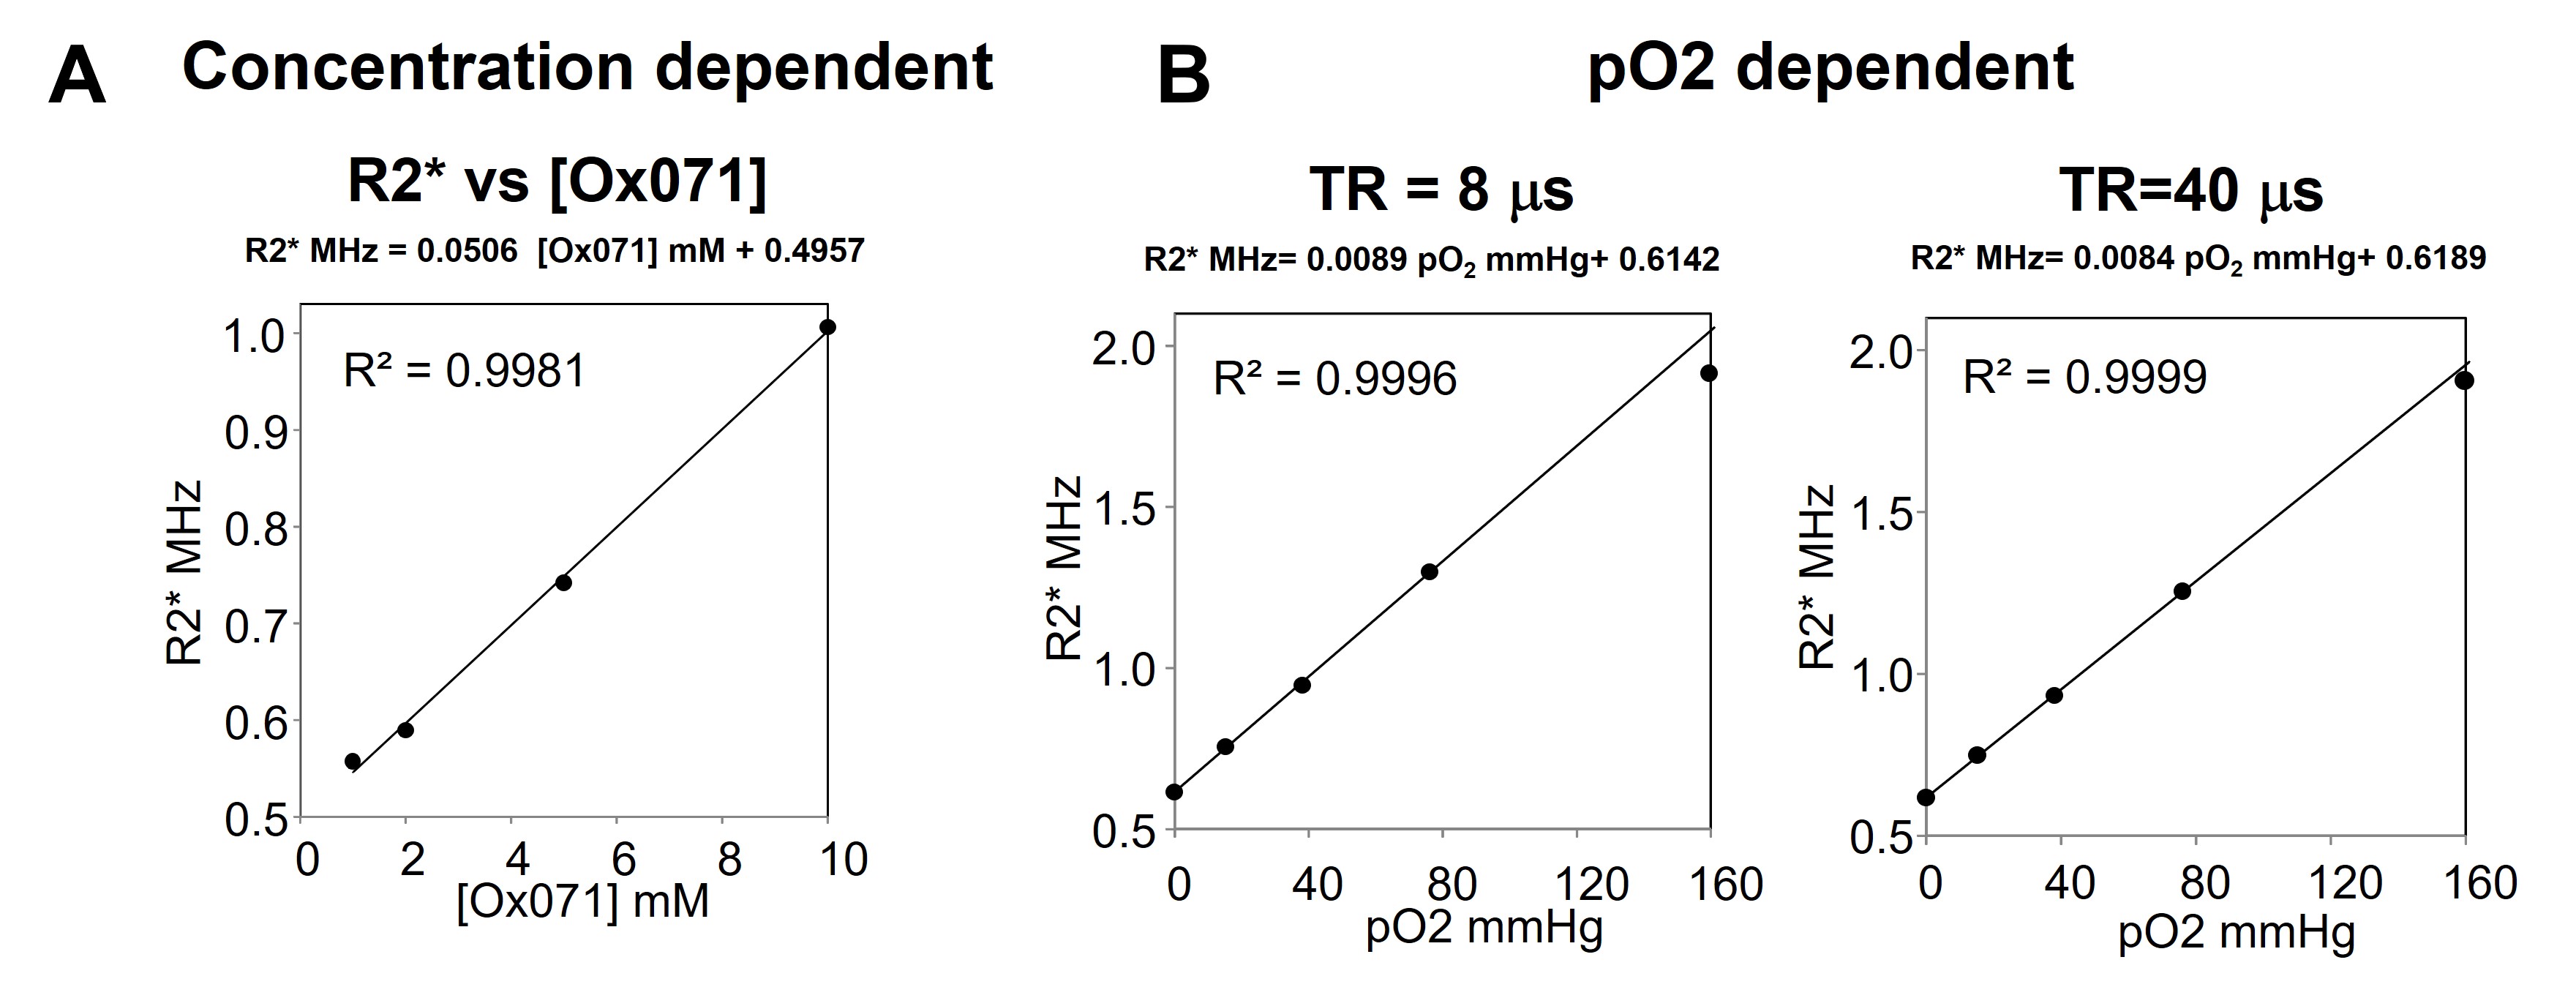
Concentration dependent and PO2 dependent line broadening of Ox071 probe
A. Linear relationships between R2* and the concentration of Ox071 measured at TR = 8 µs. B. Linear relationship between R2* and pO2 at TR = 8 (left) and 40 µs (right). The R2* is linearly proportional to pO2 in the range of 0 – 76 mmHg at TR = 8 µs which is routinely used for mouse experiments. R2* is linearly proportional to pO2 in the range of 0 – 159.6 mmHg at TR = 40 µs.
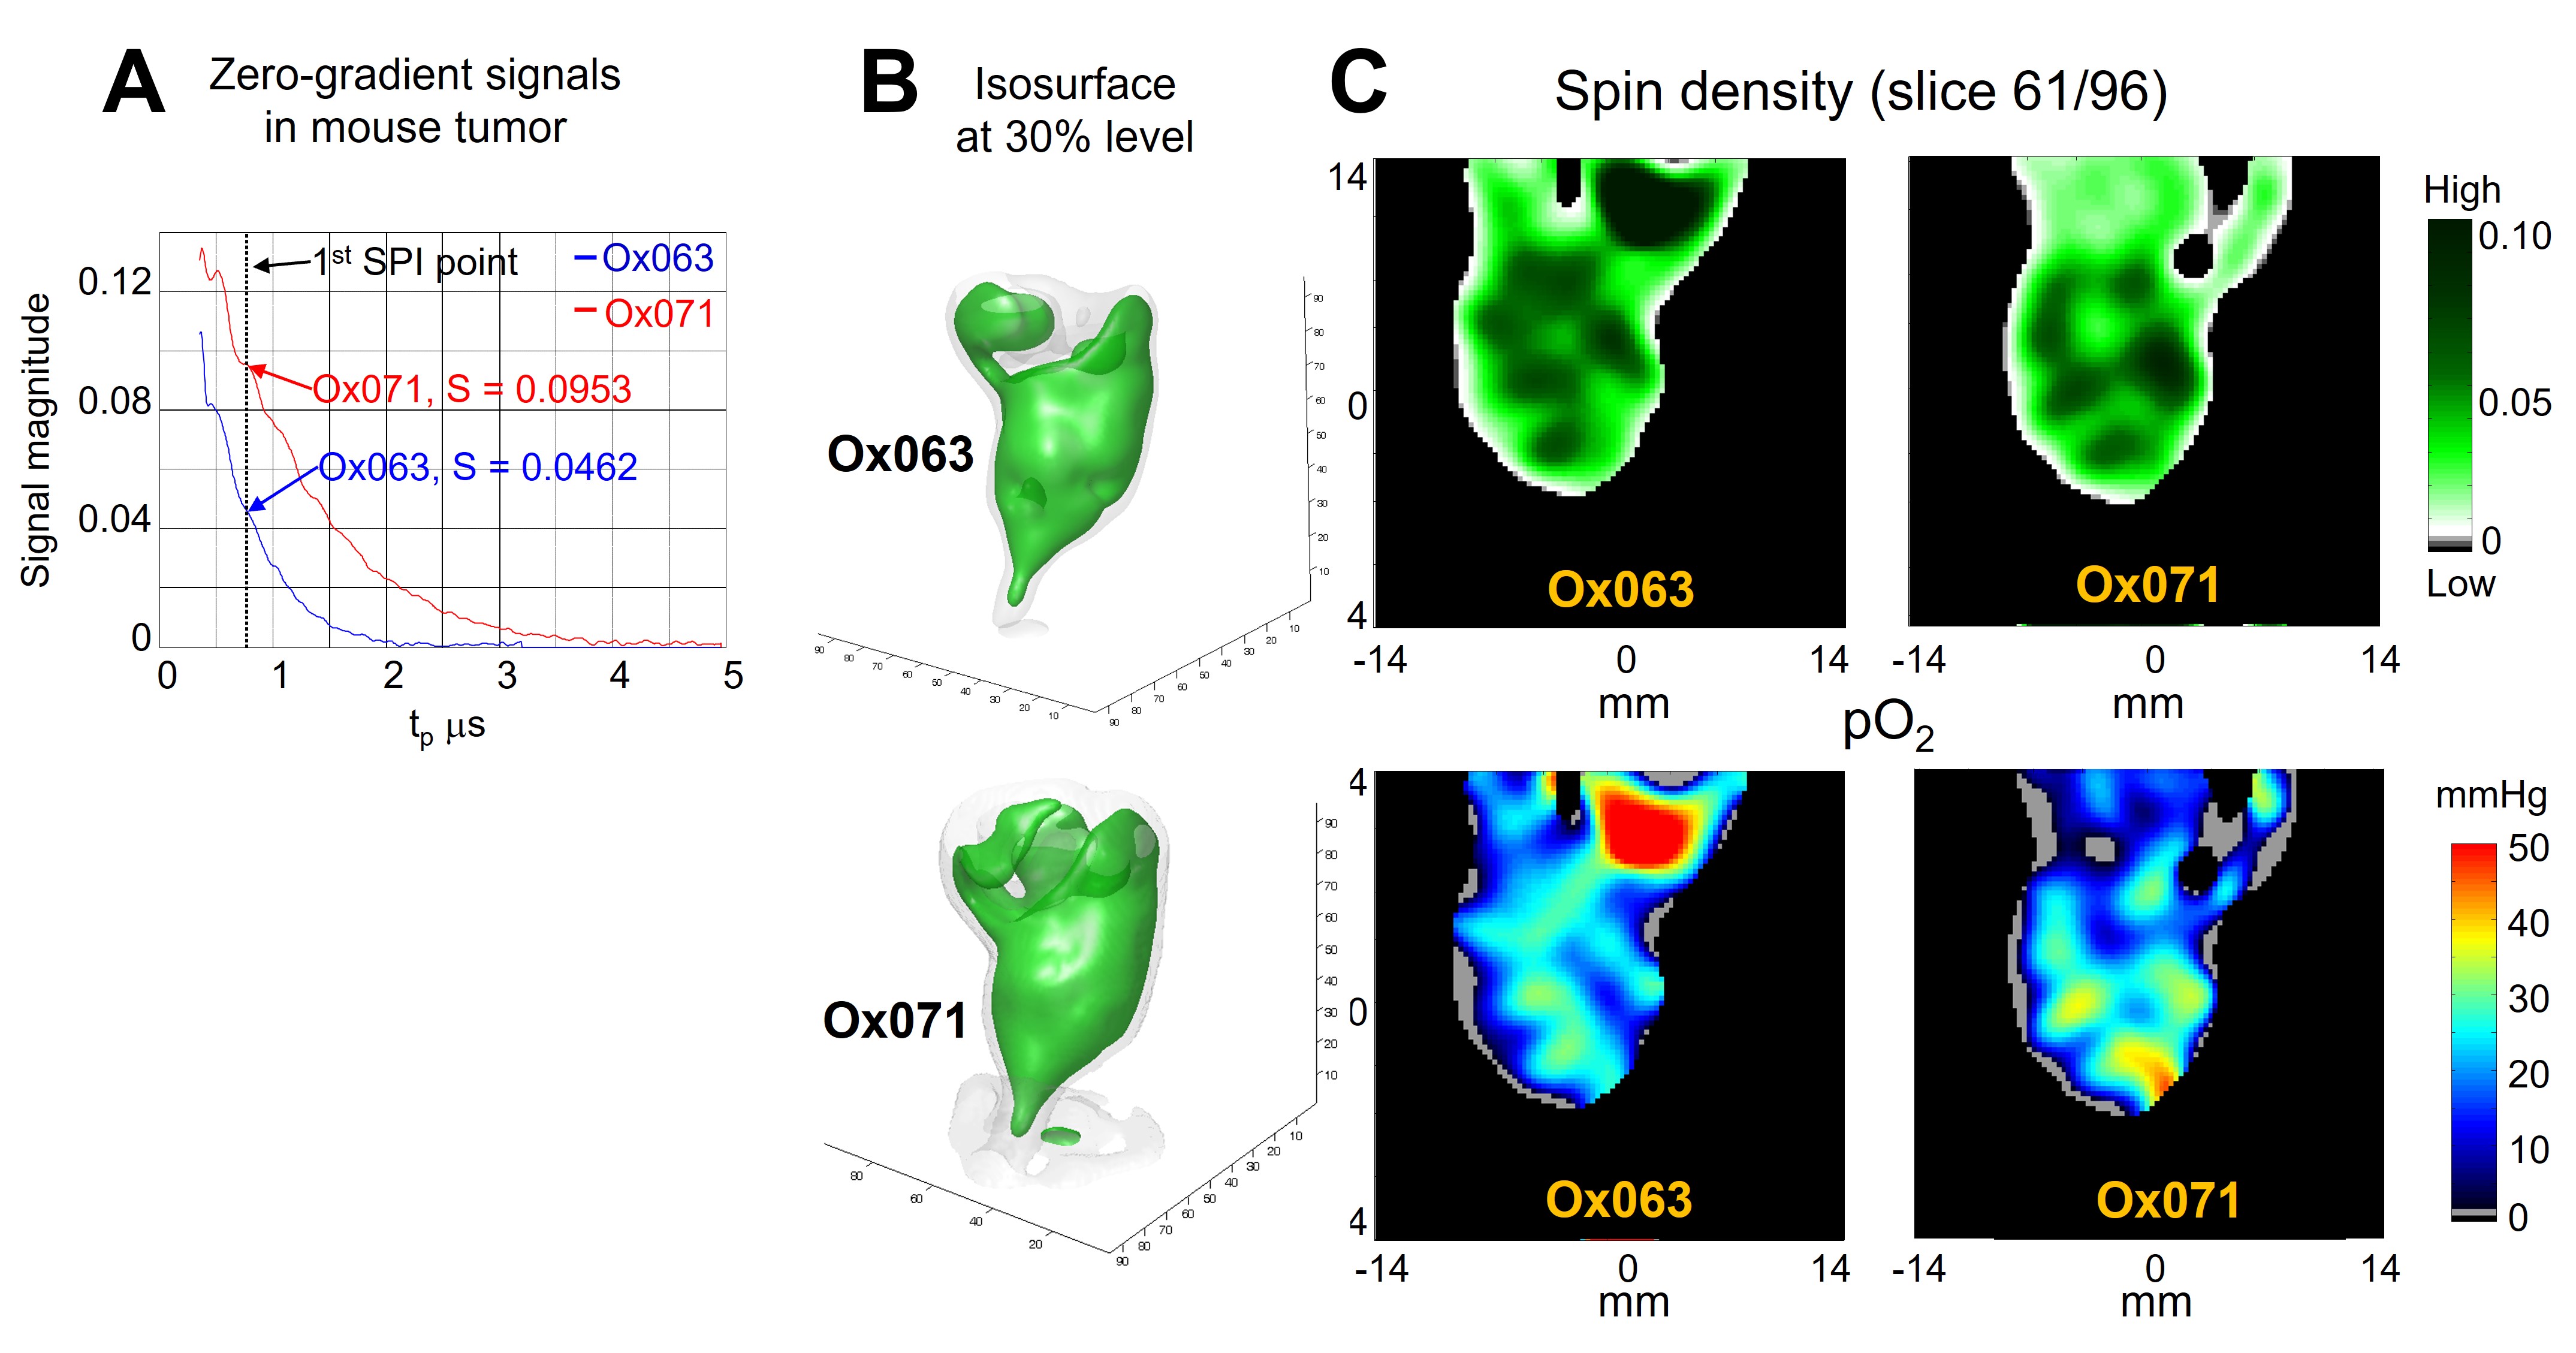
Tumor imaging by the spin probes Ox063 and Ox071. A. Zero-gradient signal intensities of Ox063 (blue) and Ox071 (red) observed in mouse tumor. Vertical dashed line indicates a delay time tp used for image formation. Note the signal level of Ox071 is almost double to Ox063 at this point and its relaxation time is much longer than that of Ox063. B. Isosurfaces of probe distribution based on signal intensities of Ox063 (top) and Ox071 (bottom). C. Spin density (top) and pO2 (bottom) maps determined by the probes Ox063 (left) and Ox071 (right).