4014
Quantification of bilateral kidney oxygen consumption with MOTIVE-bSSFP1University of Pennsylvania, Philadelphia, PA, United States
Synopsis
Keywords: Oxygenation, Kidney, metabolic rate of oxygen
Kidney oxygen consumption rate increases during the early stages of diabetes, ultimately leading to hypoxia of renal tissue. Thus, a reliable non-invasive approach to quantify kidney metabolism has significant clinical potential. Here, an approach to quantify the kidney oxygen utilization of both kidneys is reported. The method relies on the MOTIVE-bSSFP pulse sequence to measure SvO2 and blood flow rate in the inferior vena cava, above and below the branching of the renal vessels. Conservation of mass yields an expression to compute bilateral renal metabolic rate of oxygen.Introduction
Kidney oxygen utilization increases by 40-65% during the early stages of diabetic kidney disease (1-3). The mismatch in oxygen supply and consumption ultimately leads to hypoxia of the kidney tissue. Thus, quantification of whole-organ renal metabolic rate of oxygen (rMRO2) is a potentially valuable biomarker of kidney function before irreversible damage occurs. rMRO2 is quantified by Fick’s Principle with measurements of blood flow rate in the inflowing artery and blood oxygenation level (SvO2) in the draining vein (4). Our group has reported the “Metabolism of Oxygen via T2 and Interleaved Velocity Encoding” (MOTIVE) pulse sequence, which measures blood flow rate and SvO2 in a single pass in under 20 seconds (5). We have previously quantified individual whole-organ rMRO2 by measuring SvO2 and blood flow rate at an oblique cross-section of the kidney’s vasculature (6). We have also proposed a preliminary quantification of bilateral whole-organ rMRO2 with measurements at suprarenal and infrarenal locations (7). In the present study, however, the MOTIVE sequence includes a T2-prepared bSSFP readout (8) (MOTIVE-bSSFP) for higher SNR efficiency and improved visualization of abdominal vasculature to quantify bilateral kidney oxygen consumption (rblMRO2).Methods
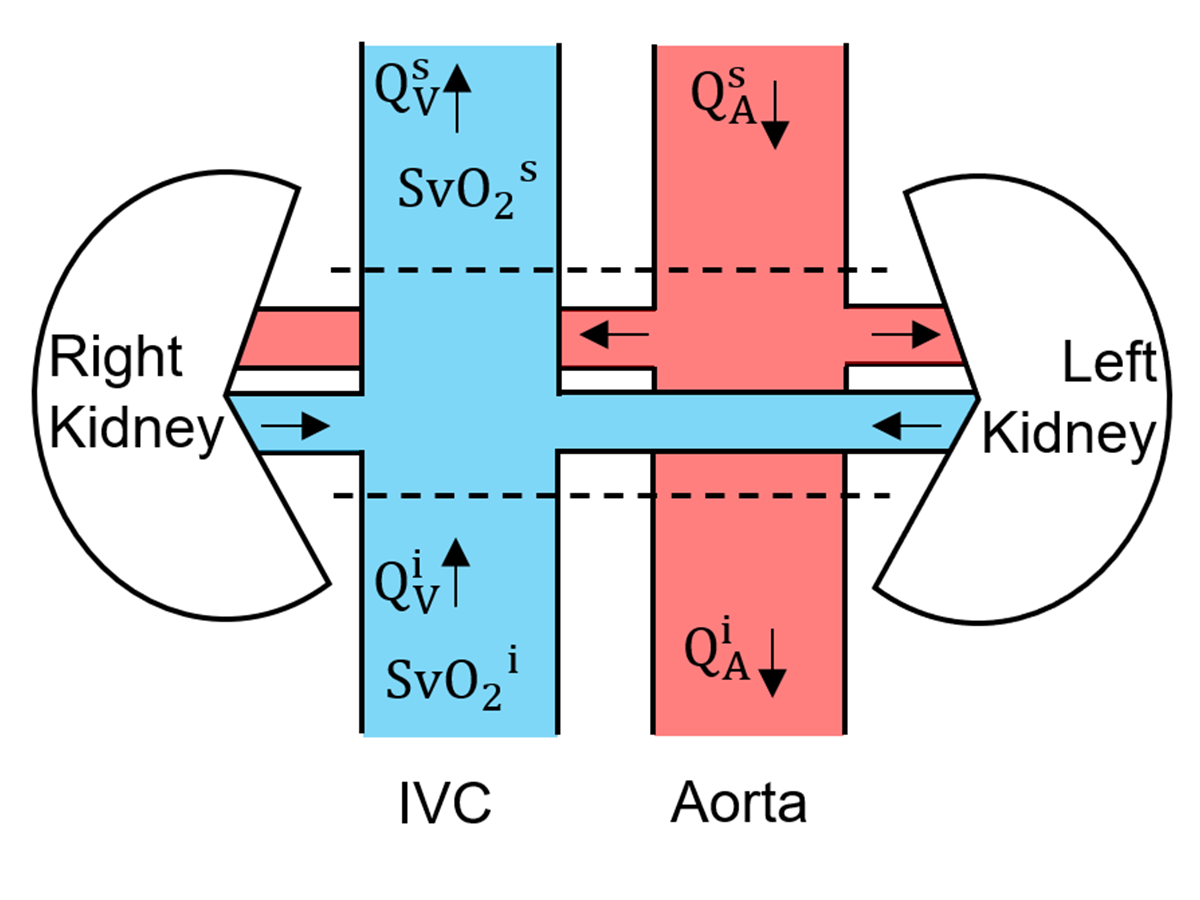
Renal metabolic rate of oxygen is quantified with Fick’s Principle: $$$rMRO_2 = (C_a)(\frac{Q}{mass})(SaO_2 - SvO_2)$$$, where Ca is the concentration of oxygen in blood (9)), Q is blood flow rate, kidney mass is calculated from volume with a density of 1.06g/mL (10), and SaO2 is assumed to be 98%.Quantification of bilateral rMRO2 (derivation in our previous work (7)) follows from Equation 1:
$$r_{b.l.}MRO_2 = (C_a)\left(\frac{Q_A^s - Q_A^i}{mass}\right)\left(SaO_2 - \left(\frac{ (Q_V^s \cdot SvO_2^s) - (Q_V^i \cdot SvO_2^i) }{Q_V^s - Q_V^i}\right)\right) $$
where $$$ Q_A^k $$$ and $$$ Q_V^k $$$ represent blood flow rate in the aorta (A) and inferior vena cava (V) at each location (k = s, suprarenal; k = i, infrarenal). $$$SvO_2^k$$$ represents the venous oxygen saturation in the inferior vena cava at each location (k = s, i). The method is illustrated in Figure 1. After assuming that total renal arterial inflow is equal to total renal venous outflow, namely, $$$Q_A^s - Q_A^i = Q_V^s - Q_V^i$$$, the equation is recast as Equation 2:
$$ r_{b.l.}MRO_2 = \left(\frac{C_a}{mass}\right)\left( (Q_V^s \cdot AVDO_2^s) - (Q_V^i \cdot AVDO_2^i)\right) $$
where, $$$ AVDO_2^k = SaO_2 - SvO_2^k $$$, is the arteriovenous oxygen saturation difference at each location (k = s, i). The simplified equation was adopted for rblMRO2 computation.
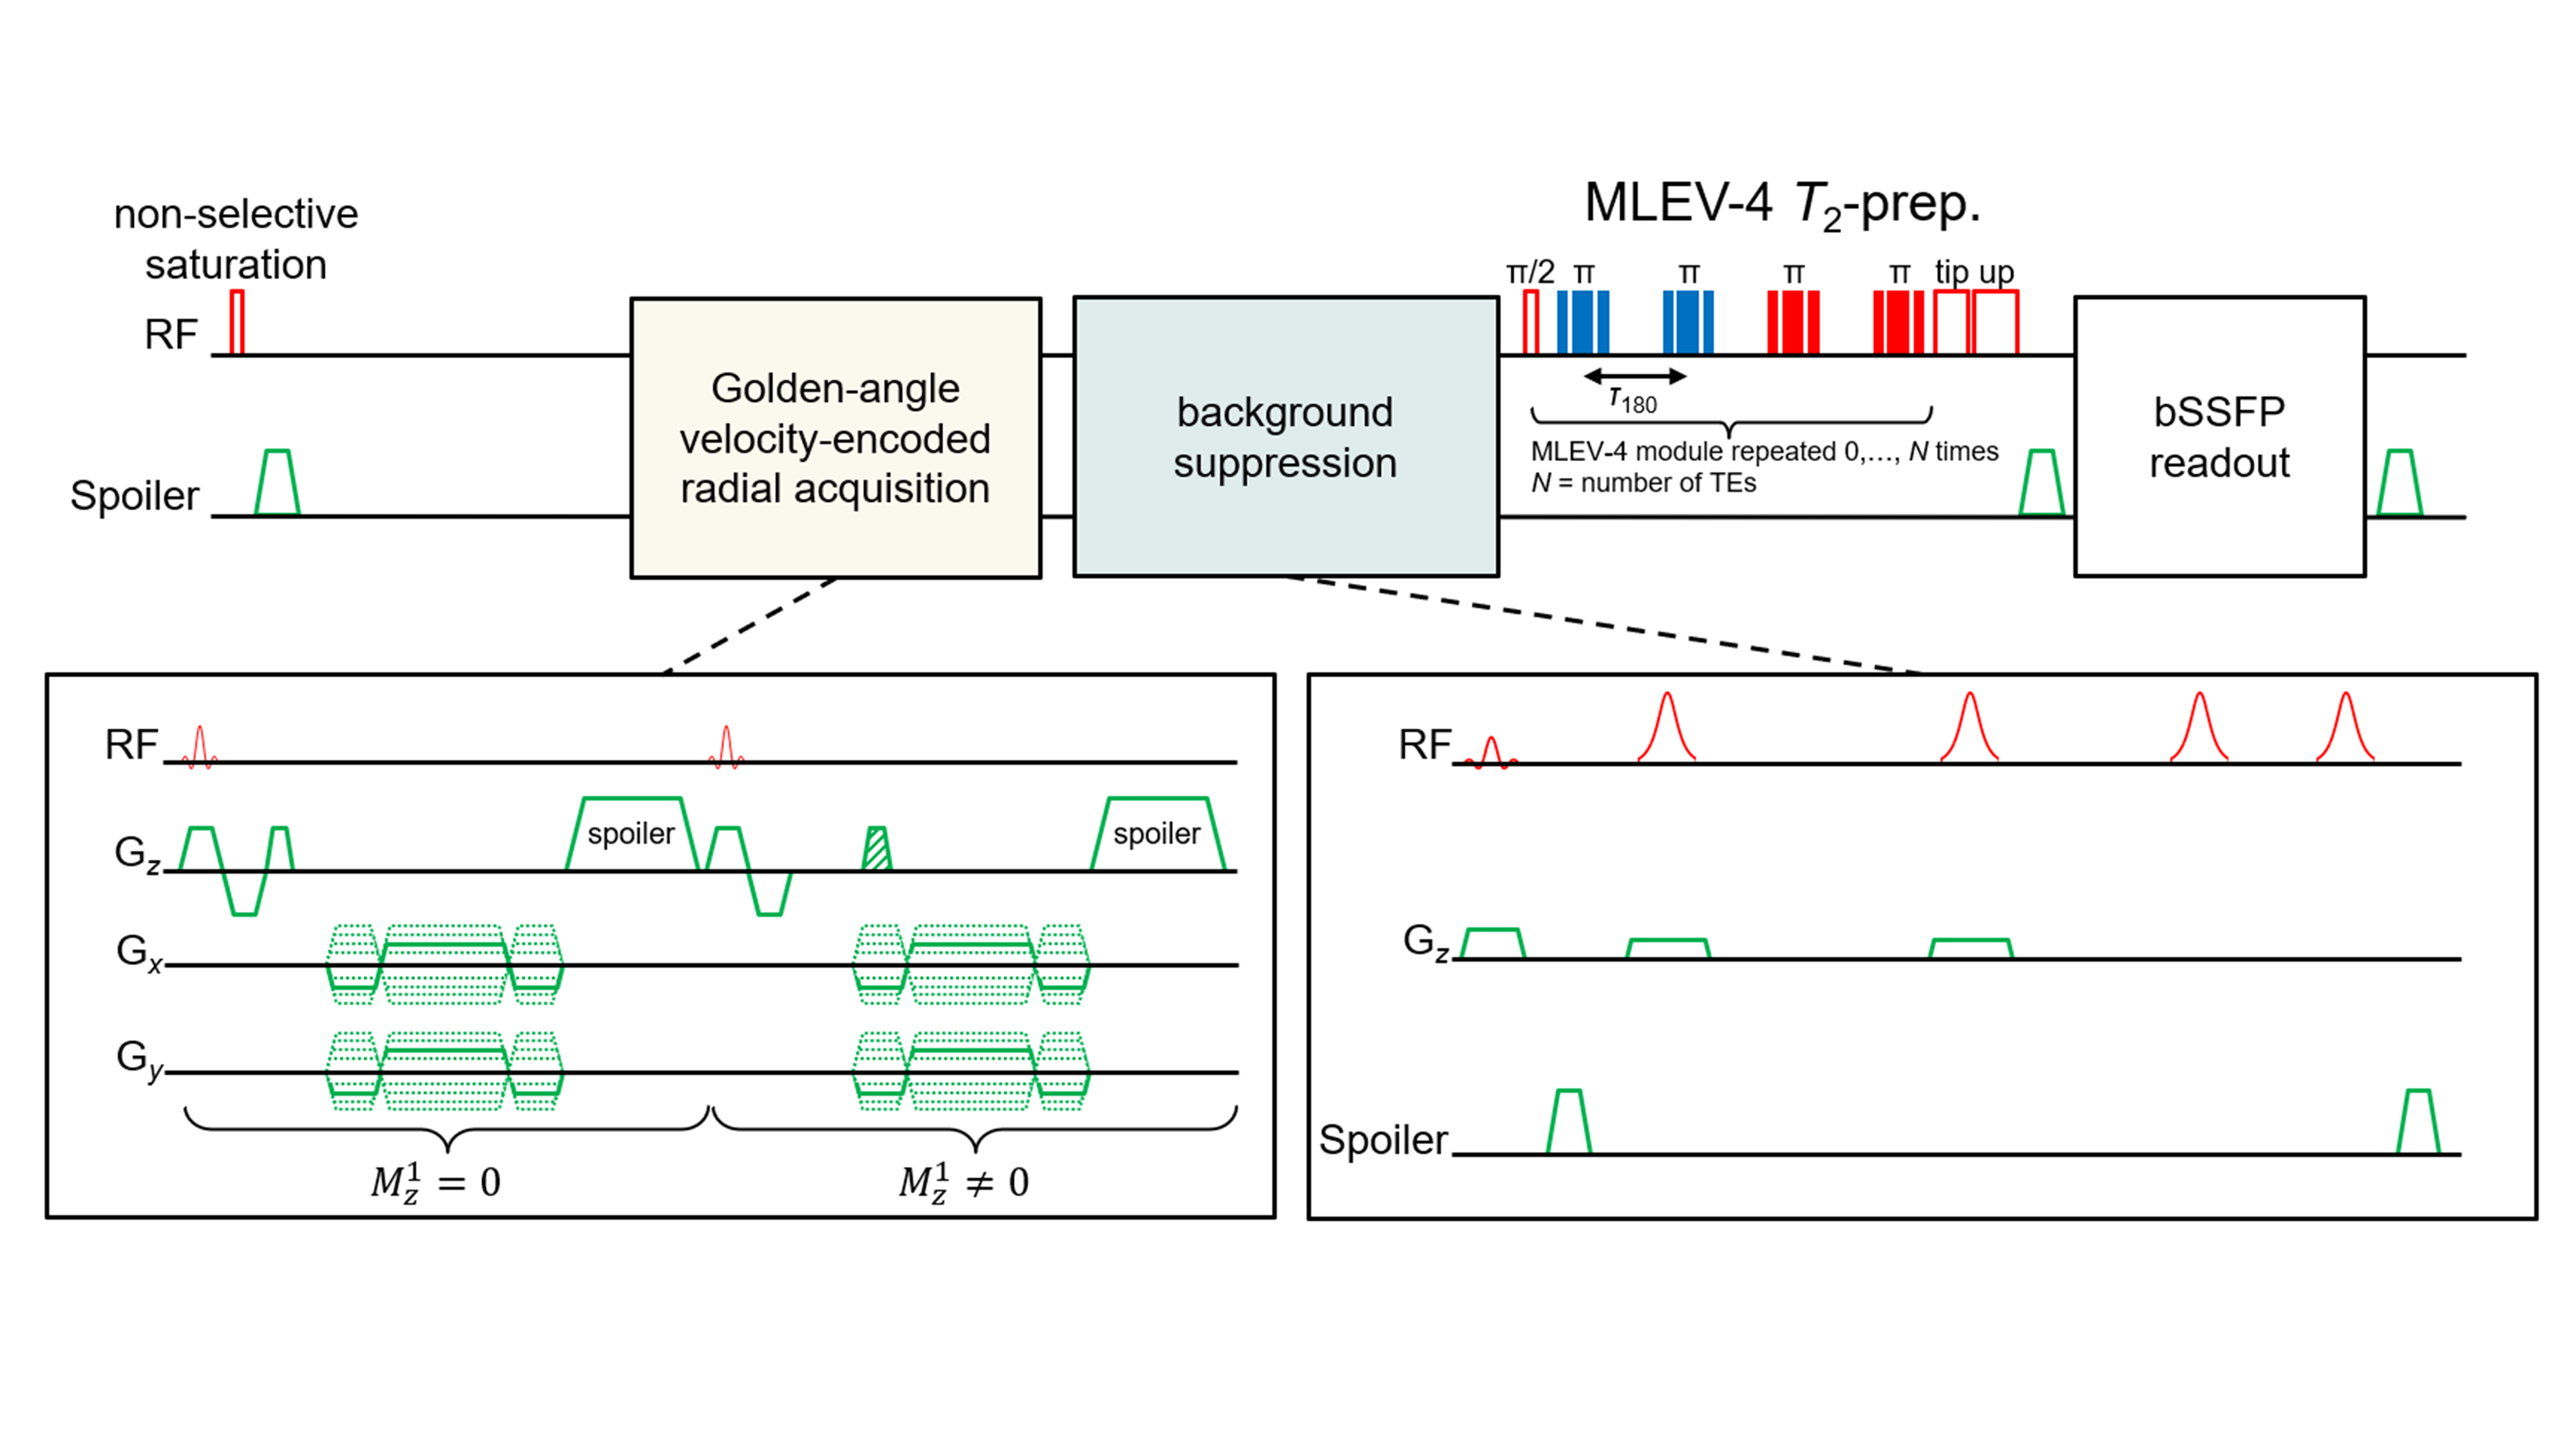
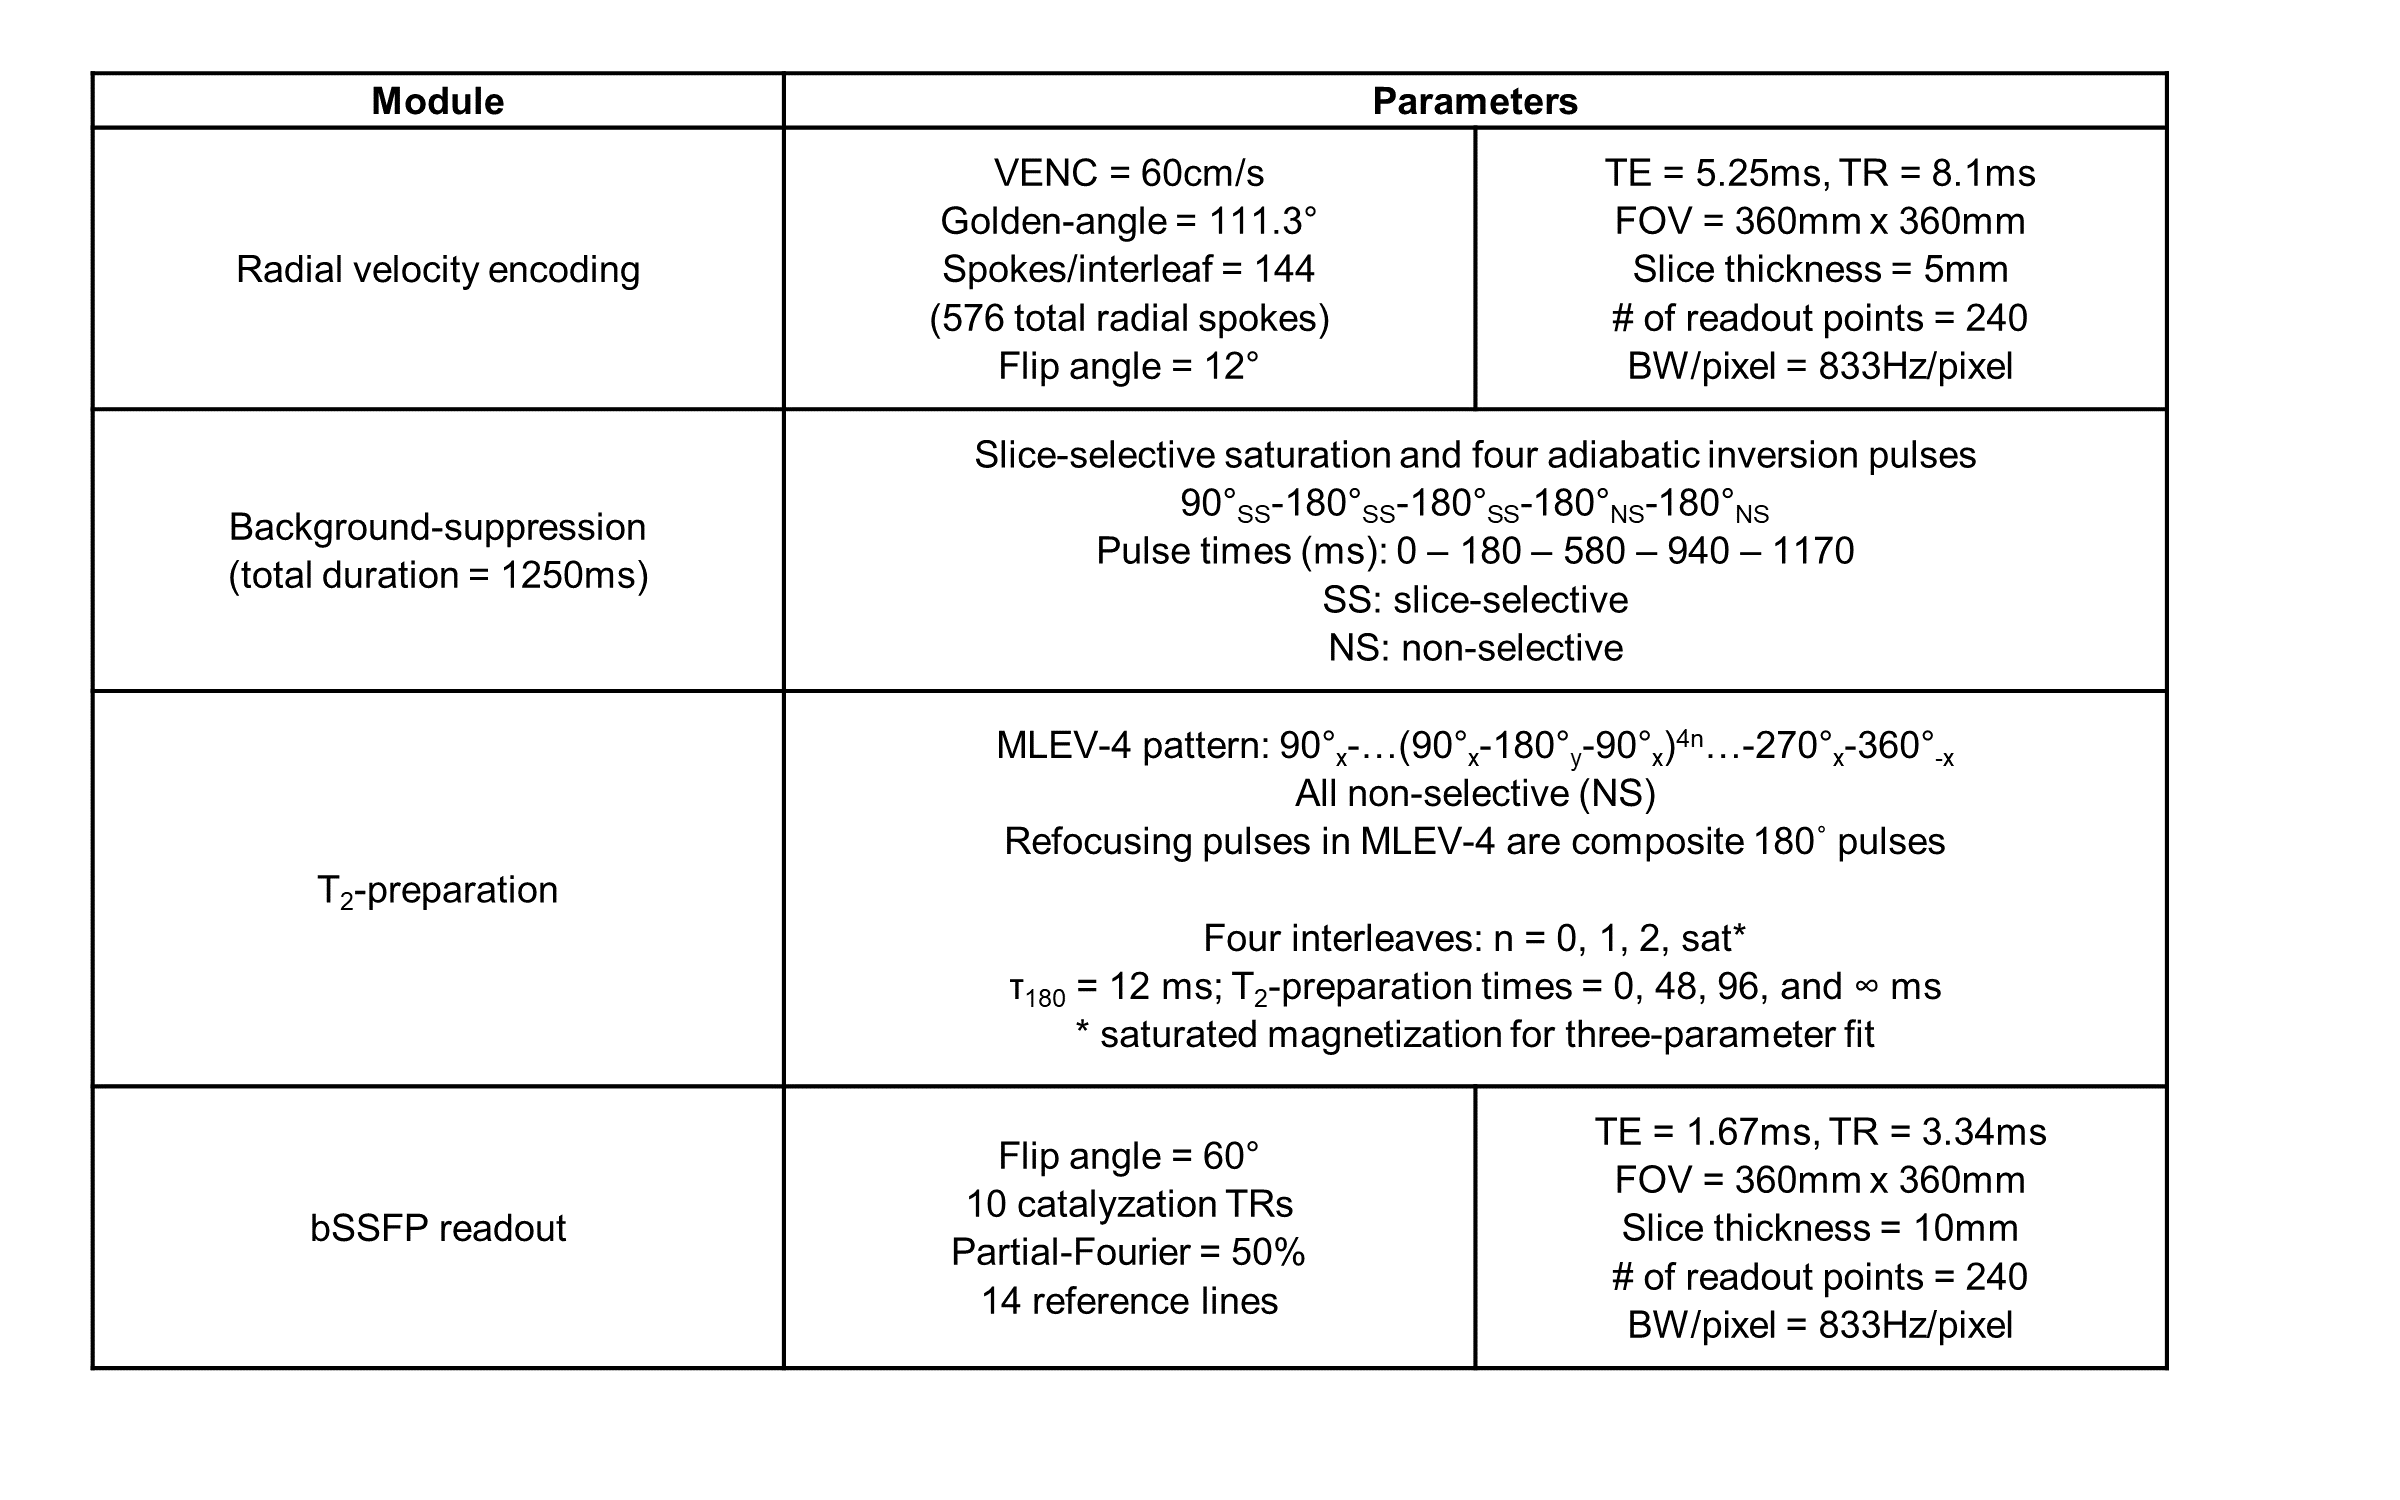
MOTIVE-bSSFP was implemented above and below the renal vessels to measure blood flow and SvO2. The pulse sequence interleaves an ungated golden-angle radial velocity encoding module before a background-suppressed, T2-prepared bSSFP readout. T2 is converted to SvO2 via calibration model (11). The pulse sequence timing diagram and parameters are provided in Figures 2 and 3. The sequence duration is 18 seconds, permitting a breath-held acquisition. Three repetitions at each location (six total breath holds) were acquired to assess intrasession reproducibility.
Five healthy subjects (3F, 26±3 years) were recruited for imaging at 3T (Siemens Prisma) with body flex array and spine coils.
Results
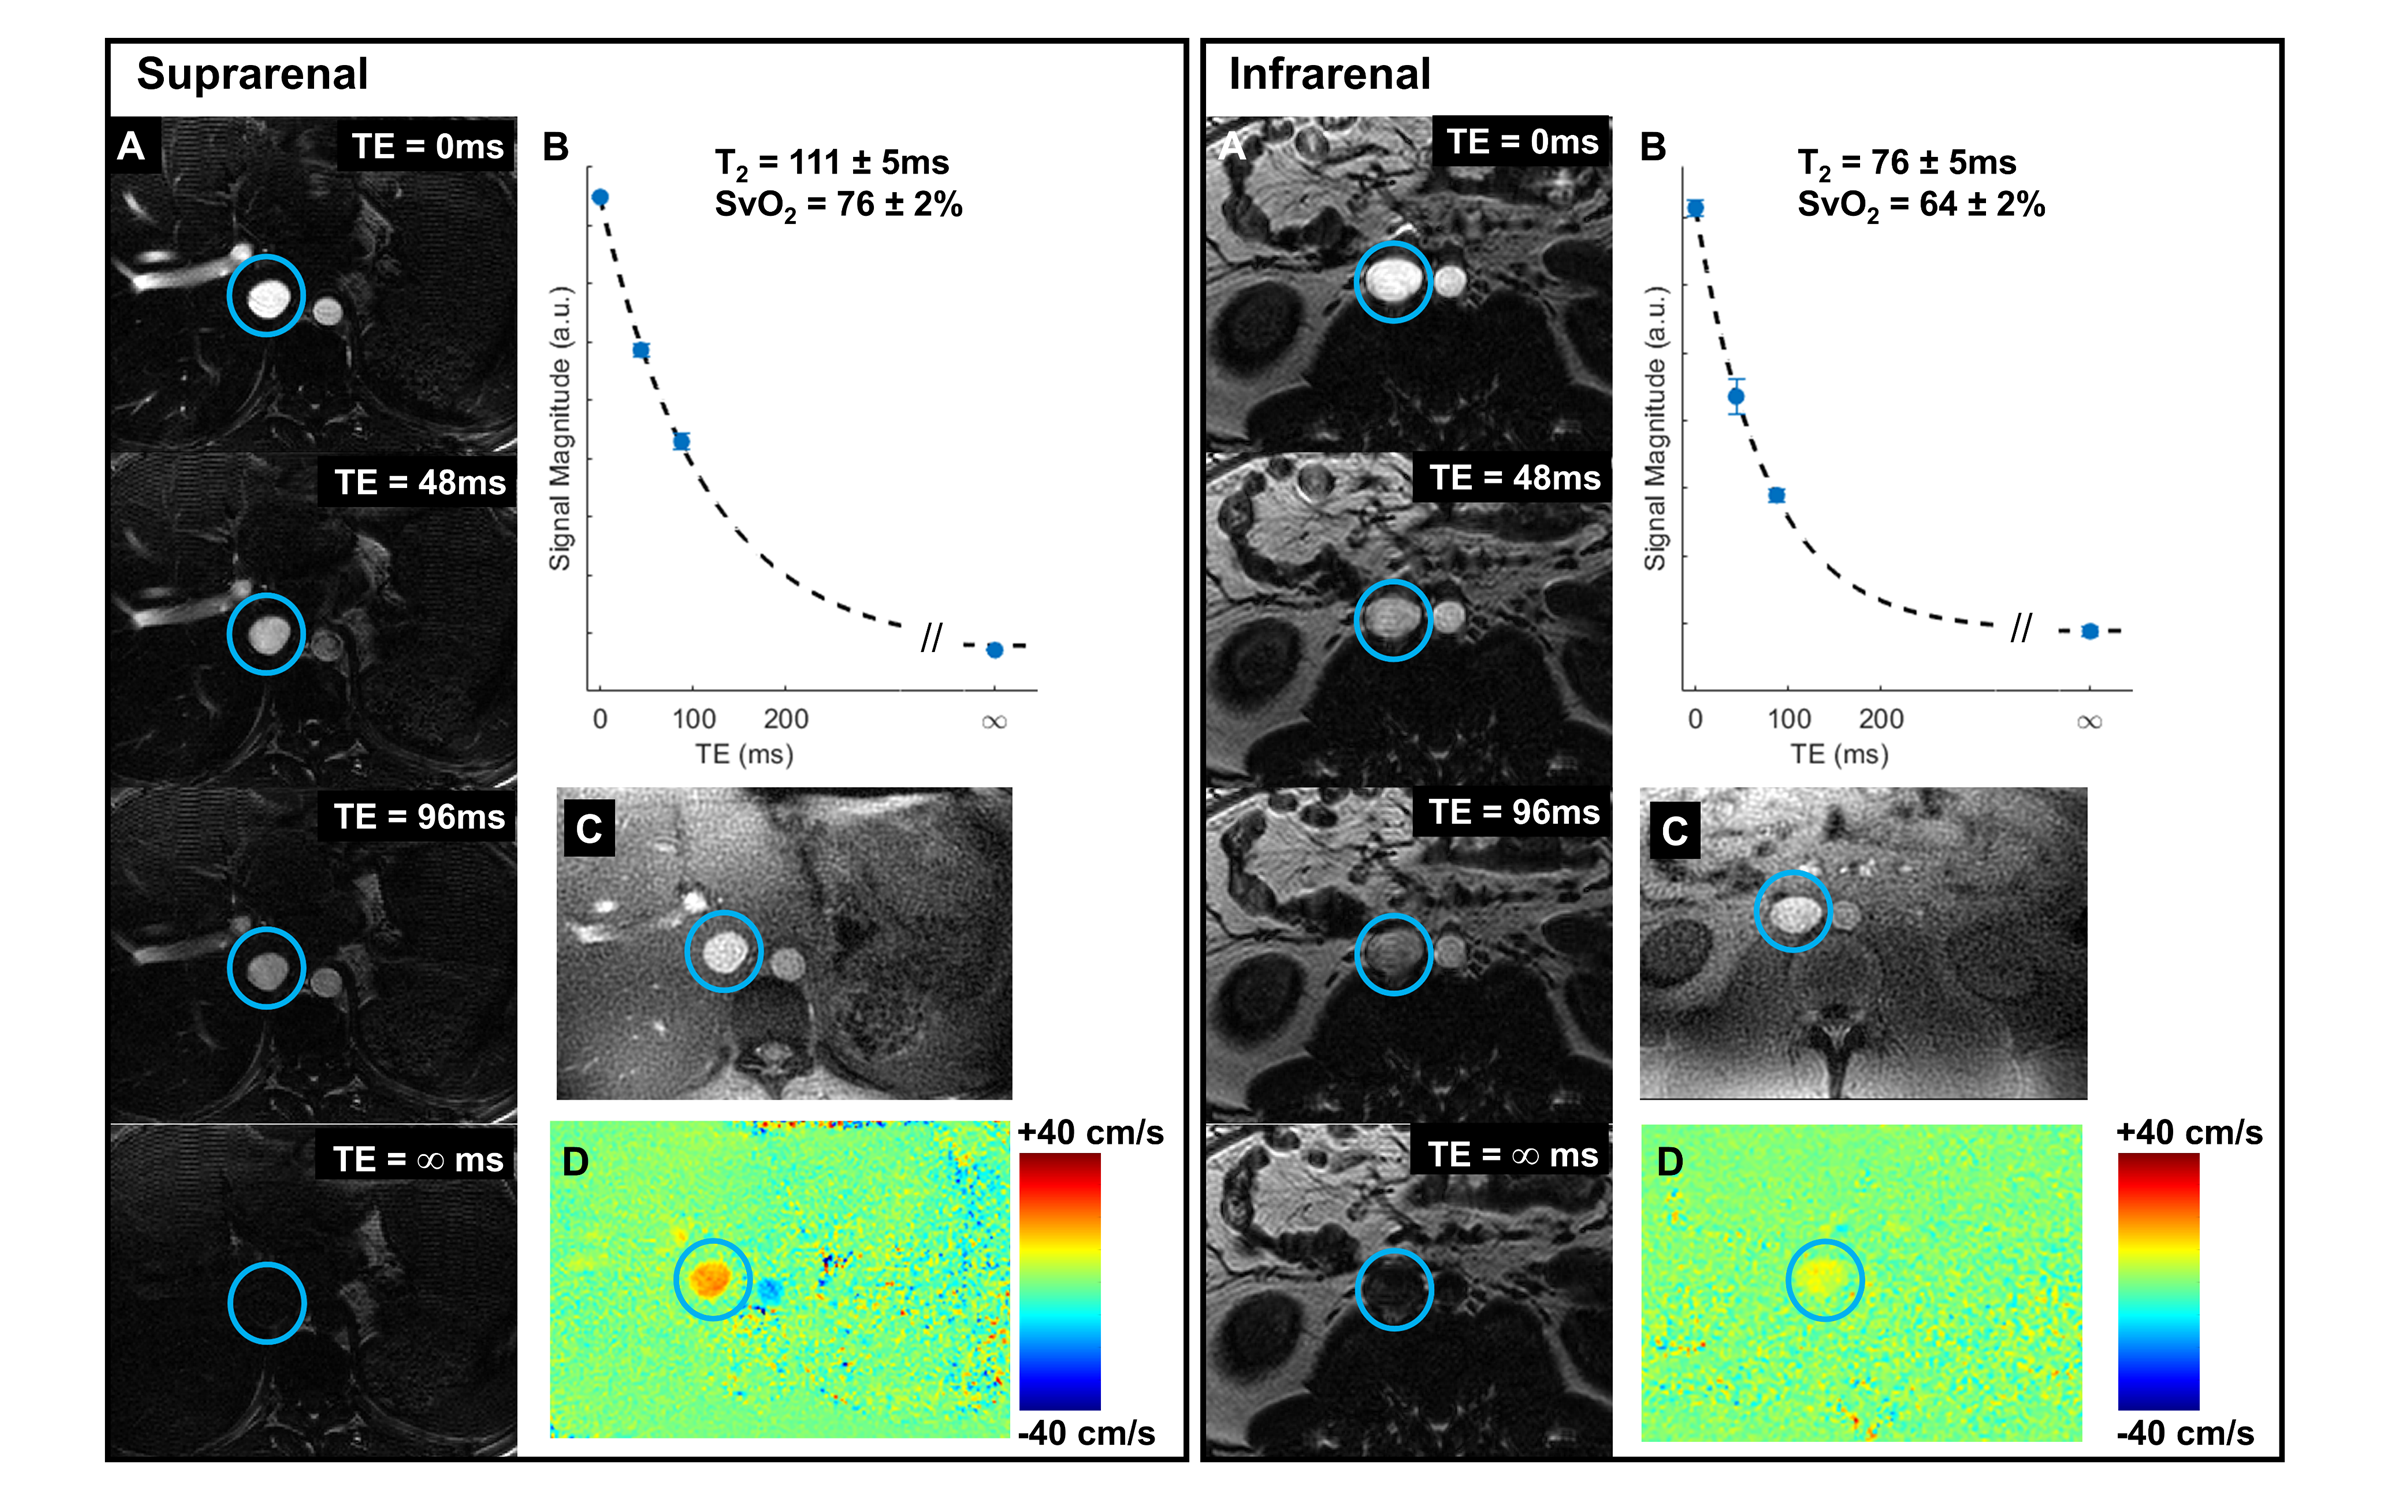
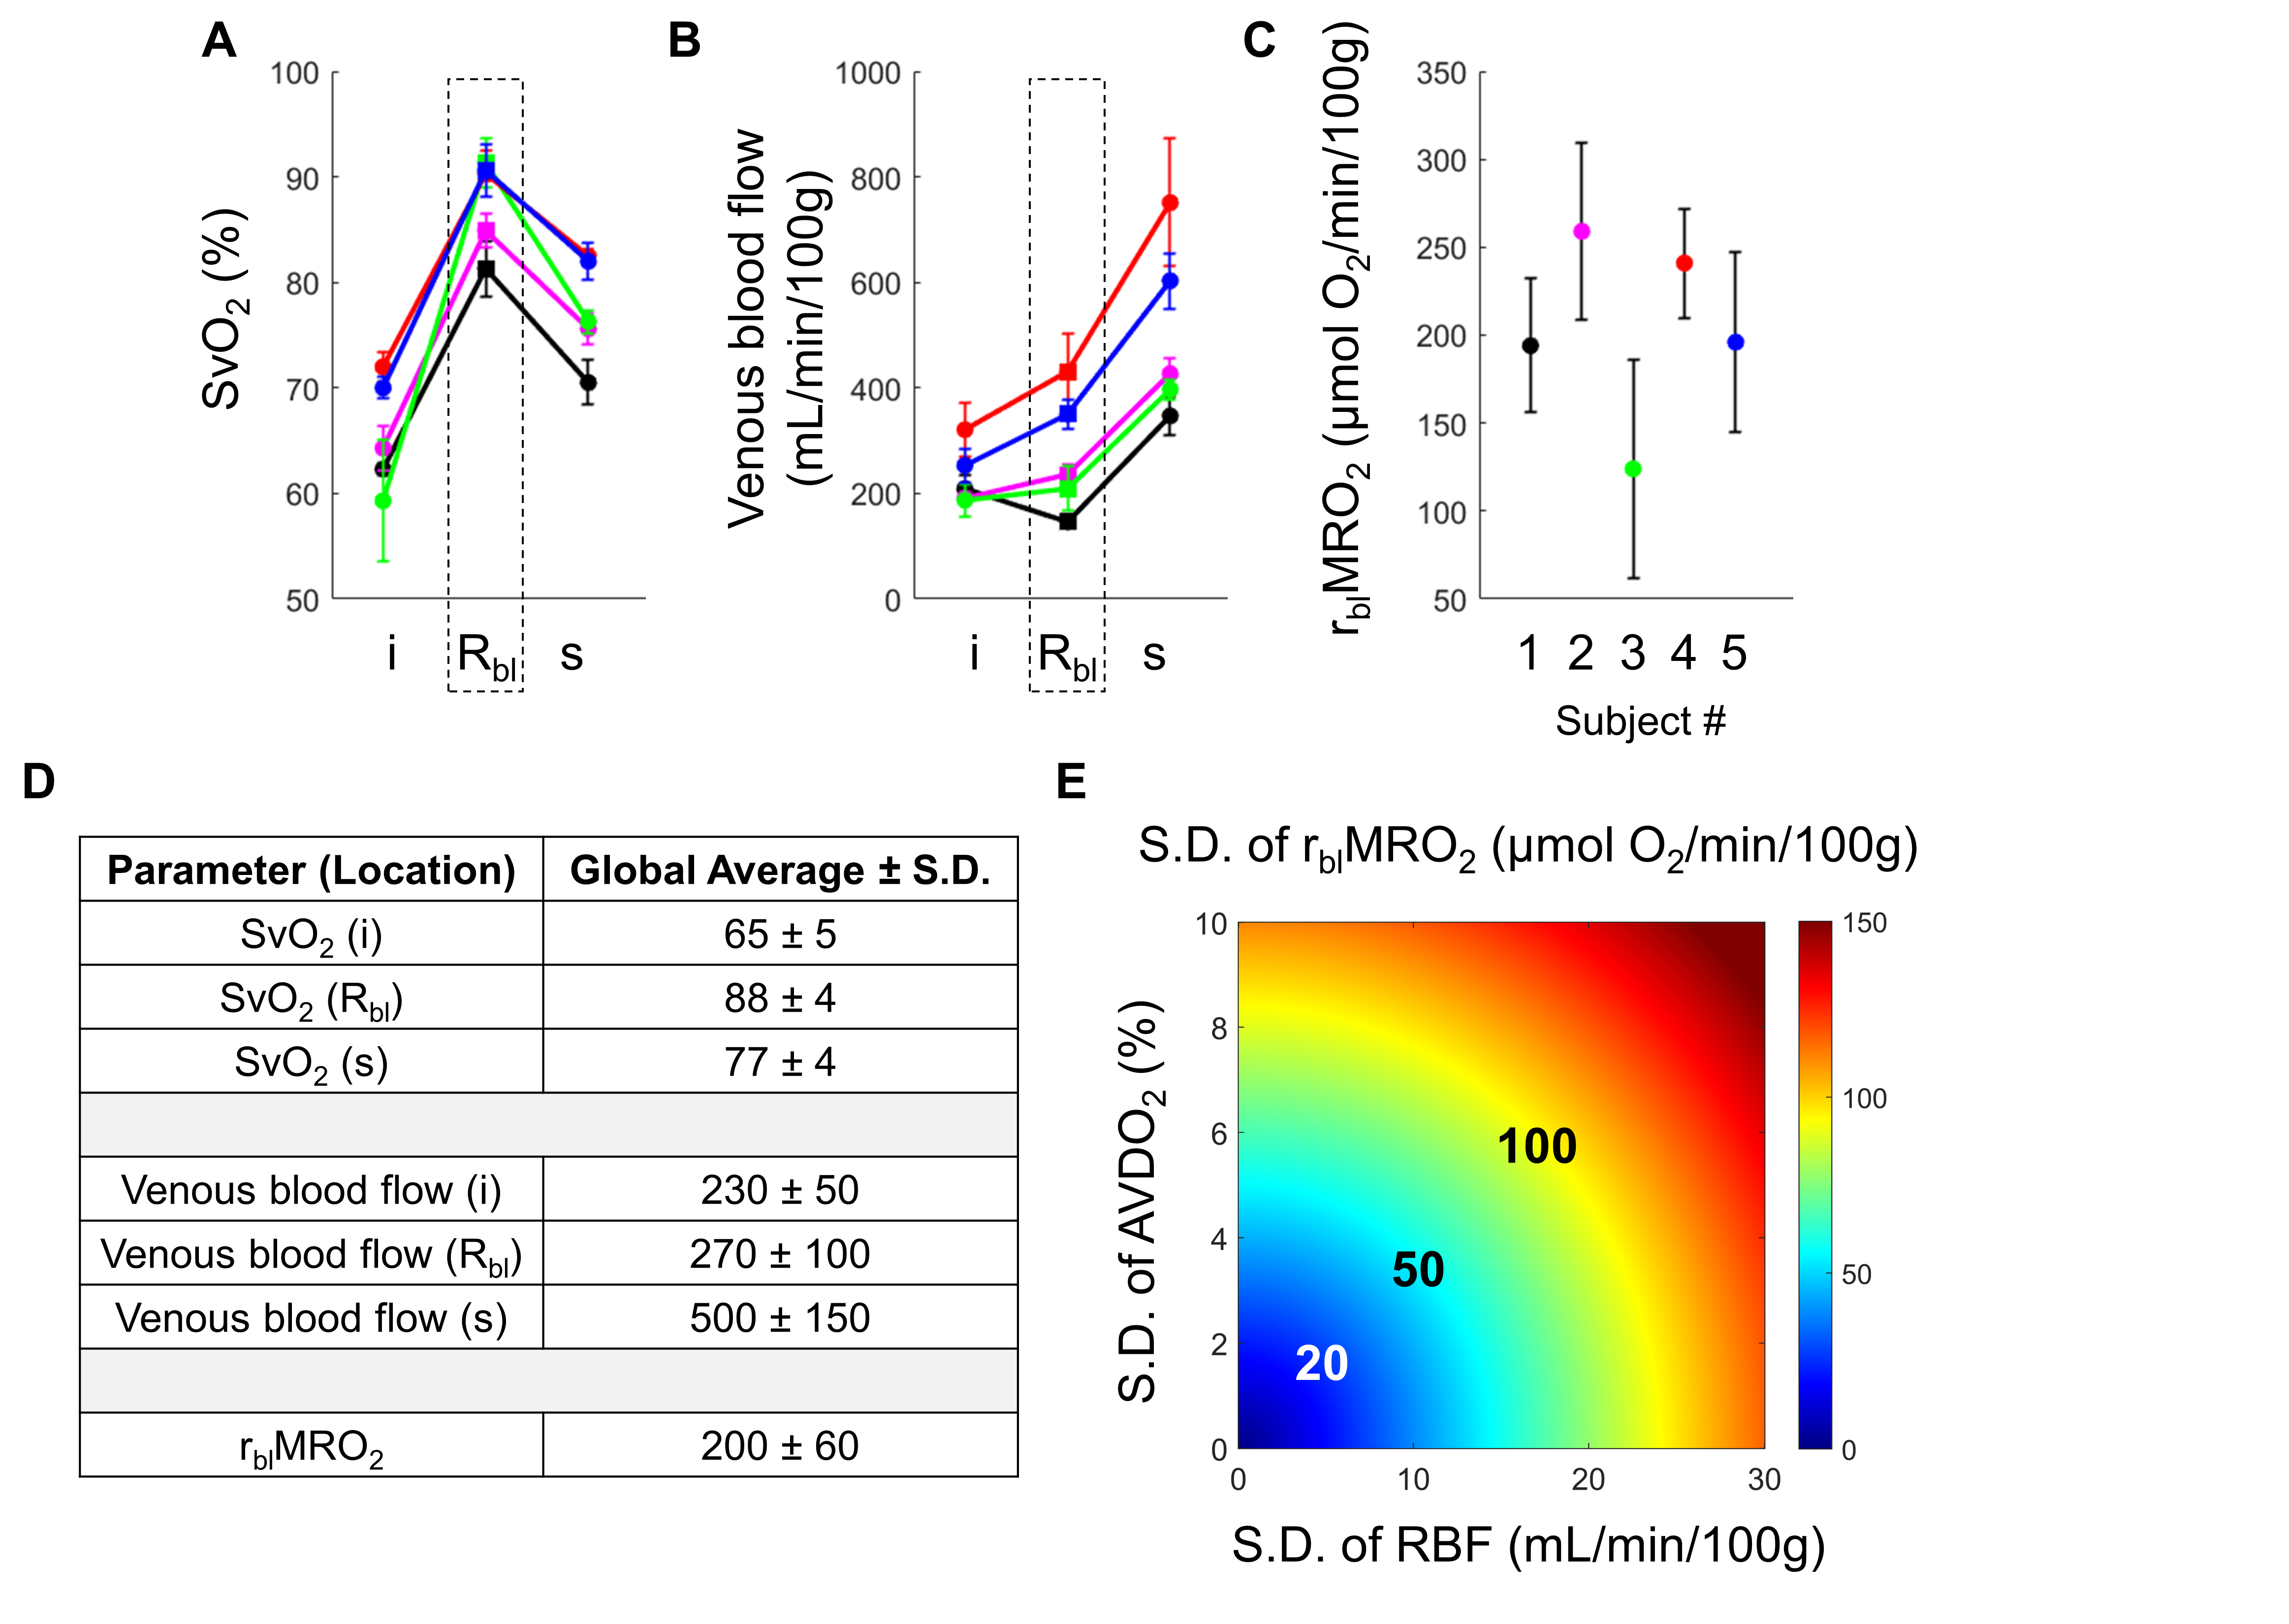
Across all subjects, the average SvO2 in the suprarenal and infrarenal IVC was 77±4% and 65±5%, respectively. The average blood flow rate in the suprarenal and infrarenal IVC was 230±50 mL/min/100g and 500±150 mL/min/100g, respectively. The difference in these flow rates indicates that the venous outflow from both kidneys is 270±10 mL/min/100g. Taken together, the suprarenal and infrarenal SvO2 values and IVC blood flow rates imply that the flow weighted average SvO2 from both renal veins is 88±4%. This is calculated from the venous flow weighted expression for SvO2 in Equation 1.Quantification of bilateral renal MRO2 follows from Equation 2 and yielded an average rblMRO2 of 200±60 μmol O2/min/100g. Representative images in one subject are shown in Figure 4. Renal metabolic parameters and a preliminary analysis of error propagation are presented in Figure 5.
Discussion
The quantified SvO2 and blood flow rates in the IVC fall within an expected range. For instance, the SvO2 increases from 65% to 77% after the renal vessels drain into the IVC, resulting in an average renal vein SvO2 of 88%. The renal veins are known to be highly oxygenated (12). Prior preliminary work by our group found an average renal vein SvO2 of 81% (6). Future work includes directly measuring SvO2 and flow rate in each individual renal vessels for validation.The expression for rblMRO2 comprises multiple parameters, and error propagation may be a concern. Figure 5E relates the S.D. of AVDO2 and blood flow rate to that of rblMRO2.
This study relied on a simplification that total renal arterial inflow is comparable to total renal venous outflow. Prior studies (13,14) have found that this is a reasonable assumption. Since the velocity encoding module in MOTIVE is ungated, flow measurements in the pulsatile aorta may be less reliable. Thus, obtaining measurements entirely in the IVC – as in the presently proposed approach – may be preferable. However, this will need to be tested.
Conclusion
The proposed method enables quantification of bilateral kidney oxygen utilization with measurements of SvO2 and blood flow rate at suprarenal and infrarenal locations. The renal metabolic parameters reported in this study are plausible. Future work will validate the bilateral approach against individual whole-organ renal MRO2.Acknowledgements
This work was supported by NIH Grants T32EB020087, F30DK130510, P41EB029460, and UL1TR001878.References
(1) Korner A, Eklof AC, Celsi G, Aperia A. Increased renal metabolism in diabetes. Mechanism and functional implications. Diabetes 1994;43(5):629-633.
(2) Nordquist L, Friederich-Persson M, Fasching A, Liss P, Shoji K, Nangaku M, Hansell P, Palm F. Activation of hypoxia-inducible factors prevents diabetic nephropathy. J Am Soc Nephrol 2015;26(2):328-338.
(3) Friederich-Persson M, Persson P, Hansell P, Palm F. Deletion of Uncoupling Protein-2 reduces renal mitochondrial leak respiration, intrarenal hypoxia and proteinuria in a mouse model of type 1 diabetes. Acta Physiol (Oxf) 2018;223(4):e13058.
(4) Kety SS, Schmidt CF. The Effects of Altered Arterial Tensions of Carbon Dioxide and Oxygen on Cerebral Blood Flow and Cerebral Oxygen Consumption of Normal Young Men. J Clin Invest 1948;27(4):484-492.
(5) Deshpande RS, Langham MC, Cheng CC, Wehrli FW. Metabolism of oxygen via T2 and interleaved velocity encoding: A rapid method to quantify whole-brain cerebral metabolic rate of oxygen. Magn Reson Med 2022;88(3):1229-1243.
(6) Deshpande RS, Langham MC, Wehrli FW. Quantification of renal metabolic rate of oxygen. Proc Intl Soc Mag Reson Med Workshop on Kidney MRI Biomarkers, September 9-11, 2021; Philadelphia, PA.
(7) Deshpande RS, Langham MC, Cheng C, Wehrli FW. Quantification of bilateral whole-organ renal metabolic rate of O2 by exploiting conservation of flow and mass principle: a preliminary study. 2022 May 7-12; ISMRM, London, England, UK.
(8) Cheng C, Wu P, Langham MC, Wehrli FW. Simultaneous measurements of blood flow and blood water T2: a general-purpose sequence for T2-based measurement of whole-organ O2 consumption. 2020 August 8-14; ISMRM, Virtual.
(9) Yablonskiy DA, Sukstanskii AL, He X. Blood oxygenation level-dependent (BOLD)-based techniques for the quantification of brain hemodynamic and metabolic properties - theoretical models and experimental approaches. NMR Biomed 2013;26(8):963-986.
(10) Allen TH, Krzywicki HJ, Roberts JE. Density, fat, water and solids in freshly isolated tissues. J Appl Physiol 1959;14:1005-1008.
(11) Li W, van Zijl PCM. Quantitative theory for the transverse relaxation time of blood water. NMR Biomed 2020;33(5):e4207.
(12) Bishop JM, Wade OL, Donald KW. Changes in jugular and renal arteriovenous oxygen content difference during exercise in heart disease. Clin Sci 1958;17(4):611-619.
(13) Cox EF, Buchanan CE, Bradley CR, Prestwich B, Mahmoud H, Taal M, Selby NM, Francis ST. Multiparametric Renal Magnetic Resonance Imaging: Validation, Interventions, and Alterations in Chronic Kidney Disease. Front Physiol 2017;8:696.
(14) Sommer G, Noorbehesht B, Pelc N, Jamison R, Pinevich AJ, Newton L, Myers B. Normal renal blood flow measurement using phase-contrast cine magnetic resonance imaging. Invest Radiol 1992;27(6):465-470.
Figures