4011
T1 mapping and extracellular volume for evaluating myocardial fibrosis in animal models with ischemia with non-obstructive coronary artery1Department of Radiology, Xijing Hospital, Fourth Military Medical University, Xi'an, China, 2Department of Radiology, Xijing Hospital, Forth Military Medical University, Xi'an, China, 3Philips Healthcare China, Xi'an, China, 4Xijing Hospital, Fourth Military Medical University, Xi'an, China
Synopsis
Keywords: Cardiomyopathy, Animals
To investigate whether T1 mapping and extracellular volume (ECV) can be used as predictors of myocardial fibrosis for ischemia with non-obstructive coronary artery disease (INOCA). Results showed pigs models with INOCA had higher native T1 mapping and ECV (mean native T1 mappingnormal = 1068.3 ± 111.5 ms, mean native T1 mappingINOCA = 1291.7 ± 109.2 ms, P = 0.018; mean ECVnormal = 23.0 ± 1.7 %, mean ECVINOCA = 46.6 ± 10.4 5, P = 0.006). T1 mapping technology could be a noninvasive way for assessing the myocardial fibrosis for INOCA models.Introduction
Invasive coronary angiography (ICA) is the gold standard technique for diagnosing obstructive CAD based on anatomy (1). However, previous studies found that approximately 70% of patients who underwent angiography for suspected ischemic heart disease did not have obstructive CAD, and other functional examinations confirmed myocardial ischemia in one-third of men and two-thirds of women (2). Further, coronary microvascular dysfunction (CMD) and coronary artery vasospasm, particularly impaired endothelium-dependent vasodilation, play an important role in ischemia with non-obstructive coronary artery disease (INOCA) (3).Noninvasive imaging modalities are the preferred method for diagnosing INOCA in place of invasive coronary angiography (ICA) and functional tests, which were limited by cost, time-consuming, and high risk of hospitalization (4).Cardiac magnetic resonance (CMR) is considered as the gold standard for alternative cardiac imaging techniques. Moreover, it is considered the reference for the measurement of historical parameters, such as T1 mapping and ECV. A study found that INOCA patients had elevated native T1 and a significant association between elevated native T1 and impaired myocardial perfusion reverse index (5). Therefore, T1 mapping and ECV were performed in pig models to assess changes of T1 mapping and ECV and to determine the association of T1 mapping and ECV with myocardial fibrosis.
Method
The CMR was conducted on pigs in the supine position using a 3.0T system (Ingenia CX, Philips Medical Systems, Best, The Netherlands) with 32-channel phase-arrayed coils and electrocardiographic gating. Figure 1 provides an outline of the imaging procedure described previously. The full examination included T1 measurements before and after contrast administration [0.1 mmol/kg gadolinium-diethylenetriamine Penta-acetic acid (Gadovist); (Magnevist; Schering AG, Berlin, Germany)) for tissue characterization, and late gadolinium enhancement (LGE) using phase-sensitive inversion recovery imaging for the scar assessment. Three standard LV cine long-axis slices (4-, 2-, and 3-chamber views) and a stack of contiguous short-axis slices were acquired from the atrioventricular ring to the apex (with a full LV coverage and slice thickness of 6 mm, and no overlap and gap). The imaging parameters were 16 temporal phases per slice, 35.49 ms repetition time (TR), 1.16 ms echo time (TE), 340 × 340 mm2 FOV, and 192 × 192 mm2 matrices. The T1 images were acquired on basal, mid, and apical LV short-axis slices using a modified Look-Locker inversion recovery sequence as previously reported (5). The LGE images for the assessment of scar and focal fibrosis were obtained 10 min after the contrast administration using the previously described inversion recovery sequence in short- and long-axis orientations matching the cine acquisitions.All CMR images were analyzed by the Philips MR post-processing workstation (IntelliSpace Portal; Version 10.1; Philips Healthcare, Best, the Netherlands) and the software (CVI 42; Circle Cardiovascular Imaging Inc., Calgary, AB, Canada). The endocardium and epicardium were delineated by semi-automated software with manual correction by two radiologists (ZMW and LY with 10 years of experience). The extracellular volume (ECV) values were calculated as followed: ECV (%) = l (1 − hematocrit) × 100, where l = [ΔR1myocardium]/[ΔR1bloodpool] native- and post-T1 mapping (where R1 = 1/T1). The hematocrit was acquired on the day of scanning. Statistical analyses were performed using IBM SPSS Statistics software (version 26.0). The continuous variables were reported as means ± standard deviations. Comparison was performed using an independent-sample parametric statistical test. Statistical significance was accepted when a P-value was <0.05 (two-tailed test).Result
7 pigs with INOCA and 3 normal (18.7 ± 1.1 kg vs. 18.8 ± 1.4 kg, P = 0.877) were performed in this study. Native T1 mapping (1291.7±109.2 ms vs. 1002.7±20.4 ms, P=0.002) and ECV (46.6±10.4% vs. 23.0±1.7%, P=0.006) were higher in the INOCA group compared with the normal pigs. However, no difference in post-T1 mapping (383.4±64.8 ms vs. 303.0±16.4 ms, P=0.074) was found between the two groups (Table 1). The ECV measures were averaged from the basal and mid-ventricular in the short-axis slices. The apical slices were avoided due to the error related to partial volume averaging.Discussion
T1 mapping technology was analyzed for exploring the myocardial fibrosis for INOCA models. The finding of our study was that the native T1 mapping and ECV were higher when INOCA was developed, which correlated well with myocardial alterations in commonly diagnosed cardiac disorders. A study by Shaw et al. (5) found that patients with symptoms of INOCA elevated native T1 showing a significant association between the elevated native T1 and CMD. This finding concurred with our results. However, several studies found no statistical difference between the INOCA/CMD group and the normal group (6,7). Moreover, the myocardial ischemia induced by CMD did not elicit myocardial fibrosis in this population, which was markedly different from the result of our study. There might be one possible reasons for this discrepancy: the diagnostic criteria in our study were based on ICA and functional examinations, which were the gold standard diagnostic techniques for the INOCA. Therefore, further investigation for providing histopathologic and immunological evidence are necessary to support our findings.Conclusion
T1 mapping and extracellular volume (ECV) can be used as a predictor of myocardial fibrosis for INOCA models, which could be further used for the treatment and diagnosis for INOCA patients.Acknowledgements
No acknowledgement found.References
1. Pazhenkottil AP, Nkoulou RN, Ghadri JR et al. Impact of cardiac hybrid single-photon emission computed tomography/computed tomography imaging on choice of treatment strategy in coronary artery disease. European Heart Journal 2011;32:2824-2829.
2. Knuuti J, Wijns W, Saraste A et al. 2019 ESC Guidelines for the diagnosis and management of chronic coronary syndromes. Eur Heart J 2020;41:407-477.
3. Camici PG, Crea F. Coronary microvascular dysfunction. N Engl J Med 2007;356:830-40.
4. Kunadian V, Chieffo A, Camici PG et al. An EAPCI Expert Consensus Document on Ischaemia with Non-Obstructive Coronary Arteries in Collaboration with European Society of Cardiology Working Group on Coronary Pathophysiology & Microcirculation Endorsed by Coronary Vasomotor Disorders International Study Group. Eur Heart J 2020;41:3504-3520.
5. Shaw JL, Nelson MD, Wei J et al. Inverse association of MRI-derived native myocardial T1 and perfusion reserve index in women with evidence of ischemia and no obstructive CAD: A pilot study. Int J Cardiol 2018;270:48-53.
6. Mygind ND, Michelsen MM, Pena A et al. Coronary microvascular function and myocardial fibrosis in women with angina pectoris and no obstructive coronary artery disease: the iPOWER study. Journal of Cardiovascular Magnetic Resonance 2016;18.
7. Zorach B, Shaw PW, Bourque J et al. Quantitative cardiovascular magnetic resonance perfusion imaging identifies reduced flow reserve in microvascular coronary artery disease. J Cardiovasc Magn Reson 2018;20:14.
Figures
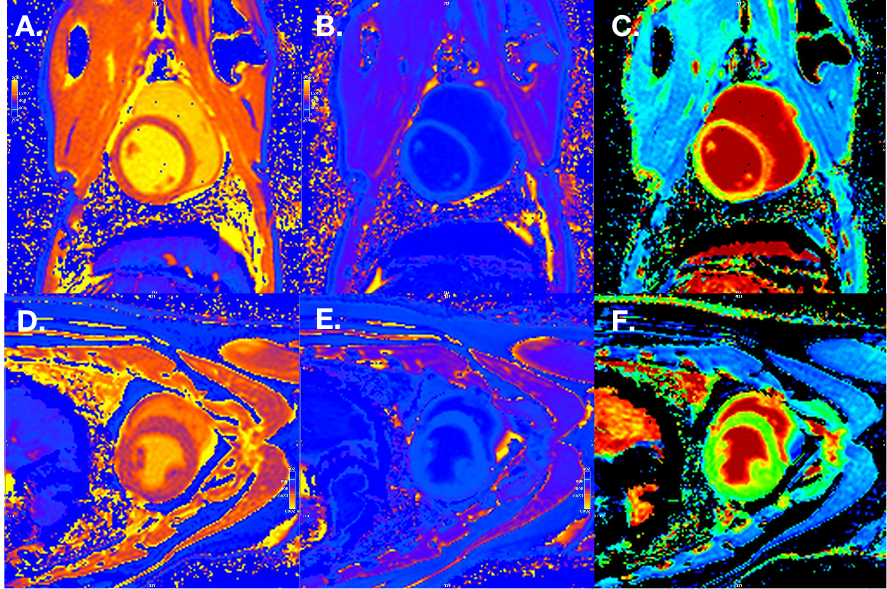
Figure 1 CMR characteristics of swine in INOCA group and Normal group.
CMR images for a pig in INOCA group and a pig in Normal group illustrating native T1 mapping, post T1 mapping, and ECV fraction map. Native T1 mapping map (A), post T1 mapping map (B) and ECV fraction map (C) of a swine in INOCA group. Native T1 mapping map (D), post T1 mapping map (E) and ECV fraction map (F) of a swine in Normal group.

Figure 2 ICA and functional examinations of swine in INOCA group and Normal group.
ICA and functional examinations images for a pig in INOCA group and a pig in Normal group. There are ICA image (A) and examinations images (B) of a swine in DM+HC+CKD group. There are ICA image (C) and examinations images (D) of a swine in Normal group.
