4010
Novel myocardial T1 analysis robust to transient longitudinal relaxation due to irregular heart rate variability in PCTIP1Department of Medical Radiological Technology, Faculty of Health Sciences, Kyorin University, Tokyo, Japan
Synopsis
Keywords: Myocardium, Relaxometry, Myocardial T1 mapping, PCTIP
Myocardial T1 mapping by polarity-corrected inversion time preparation (PCTIP) is expected to reduce measurement underestimation compared to the MOLLI method. However, measurement precision is reportedly reduced, especially for heart-rate variability. We devised an analysis to overcome this problem in PCTIP and showed that it improved measurement accuracy at high heart rates. Conventional analysis has difficulty fitting to this complex T1 relaxation, resulting in less accurate and precise measurement of longer T1. T1 analysis of PCTIP using the proposed analysis showed the potential to achieve accurate and precise T1 measurements, even for irregular heart rate variability.Introduction
Myocardial T1 mapping is useful for characterizing myocardial tissues1. Polarity-corrected inversion time preparation (PCTIP)2, a T1 mapping technique, is expected to reduce measurement underestimation compared to the MOLLI method3. However, measurement precision is reportedly reduced, especially for heart-rate variability. This is mainly due to the transient transition of longitudinal magnetization caused by shortening or variation of the intervals of the inversion recovery (IR) pulse due to the variation of the R-R interval4. We devised an analysis to overcome this problem in the PCTIP method and showed that it improved measurement accuracy, especially at high heart rates5. This study aimed to clarify the effect of the proposed method on T1 measurement accuracy for irregular heart rate variability in a phantom experiment.Methods
A PCTIP scan using a 3T magnetic resonance imaging scanner was performed on a multi-CAGN phantom. This method acquires a relaxation curve of longitudinal magnetization in the same cardiac phase (mostly from mid- to end-diastole) over several cardiac cycles in a single breath-hold. IR pulses were applied at the adjusted delay time synchronized with the electrocardiogram (ECG) trigger for every inversion time (TI), and data were acquired with multiple TIs. We generated the simulated R-waves required for ECG-gated acquisition using a signal generator and applied them to the ECG transmission module. The simulated R-waves were set to the pattern of four varied R-R intervals, and they were periodically repeated. Data acquisition was performed with 30 combinations of the eight patterns shown in Figure 1 and their initial timing. The polarity of the longitudinal relaxation curve was restored using the real component of the complex signals, after correcting for the phase error determined from the longest TI image. T1 of the phantom was estimated by a least-squares fit of the PCTIP data for each obtained inversion time and theoretical longitudinal relaxation formula. We performed this analysis using the conventional formula in a previous study, S(TI) = M0 (1 − 2 exp (−TI/T1) + exp (−TRI/T1)), where TRI denotes the trigger intervals, and in the proposed formula, S(TIn) = M0 (1 − 2 ×βn exp (−TIn/T1) ), β is the correction of the transient transition of the longitudinal magnetization. This depends on T1 and trigger interval, which is represented by γ. This response inherits the state before each IR pulse is applied. In this analysis, the correction term when an IR pulse was applied was incorporated into the recurrence formula to address the correction. In other words, the correction term of the nth TI signal, βn, is represented by the multiplication of the n-1th transient state, βn-1, whereas the degree of the current influence of the transient transition is represented by γn. T1 estimation was performed using the signal train of the PCTIP images along the TIs. Nonlinear curve fitting based on the least-squares algorithm was performed using the conventional and proposed analysis formulae and the simplex method. For the acquired T1 maps, a circular ROI was placed on each rod in the phantom. The average T1 value of the phantom was calculated. To evaluate the fitting accuracy of both analysis methods for the measured signals, the relative fitting error was calculated as the sum of the squares of the residuals normalized by the total signal strength.Results
In Figure 2A, the T1 relaxation observed by PCTIP data acquisition at each TI for T1=1643 ms showed complex behavior. Figures 2 and 3 show that the analysis using the conventional formula exhibited poor accuracy in curve fitting, with a maximum error of 15%. However, the analysis using the proposed formula showed fitting that conformed to the observed T1 relaxation, with an error of less than 1%. Figure 4 shows that the linearity of T1 measurement by the PCTIP method is also more accurate at longer T1 values than the conventional method using the proposed equation. Furthermore, Figures 4 and 5 show that the results of the conventional analysis varied greatly depending on the heart rate variability pattern for the longer T1, whereas the proposed analysis suppressed this variation.Discussion
The PCTIP data acquisition showed complex T1 relaxation behavior due to transient transitions in longitudinal magnetization caused by shortening or fluctuating intervals of IR pulses associated with short or fluctuating R-R intervals. This was particularly noticeable at longer T1 values, which are susceptible to this effect. In addition, variations were observed depending on the heartbeat variability pattern. Conventional analysis has difficulty fitting to this complex T1 relaxation, resulting in less accurate and precise measurement of longer T1. The proposed analysis, on the other hand, achieved this complex fitting and was robust to the heart rate variability patterns. The remaining slight decrease in accuracy was presumably due to perturbations in signal intensity caused by readout during data acquisition, which has also been reported in MOLLI6.Conclusion
T1 analysis of PCTIP using the proposed analysis achieved accurate and precise T1 measurements, even for irregular heart rate variability.Acknowledgements
No acknowledgement found.References
1. Moon JC, Messroghli DR, Kellman P, Piechnik SK, Robson MD, Ugander M, et al. Myocardial T1 mapping and extracellular volume quantification: a society for cardiovascular magnetic resonance (SCMR) and CMR working group of the European Society of Cardiology consensus statement. J Cardiovasc Magn Reson. 2013;15:92.
2. Kuhara S, Ishikawa H, Kanazawa T, Seino S, Bannae S, Takasumi H, et al. Polarity-corrected TI prep tool for delayed-enhancement MR imaging and T1 mapping. Proc ISMRM. 2014:2447;2014.
3. Messroghli DR, Radjenovic A, Kozerke S, Higgins DM, Sivananthan MU, Ridgway JP. Modified look-locker inversion recovery (MOLLI) for high-resolution T1 mapping of the heart. Magn Reson Med. 2004;52:141–6.
4. Takasumi H, Seino S, Kikori K, Ishikawa H, Kanezawa T, Bannae S, et al. Evaluation of the homogeneity of native T1 myocardial mapping using the polarity corrected inversion time preparation method in a myocardial phantom and healthy volunteers. Radiol Phys Technol. 2021;14:50–6.
5. Endo Y, Kuhara S: A novel myocardial T1 analysis method robust to fluctuations in longitudinal magnetization recovery due to heart rate variability in polarity‑corrected inversion time preparation. Radiol Phys Technol. 2022;15:224–33
6. Kellman P, Hansen MS. T1-mapping in the heart: accuracy and precision. J Cardiovasc Magn Reson. 2014;16:2.
Figures
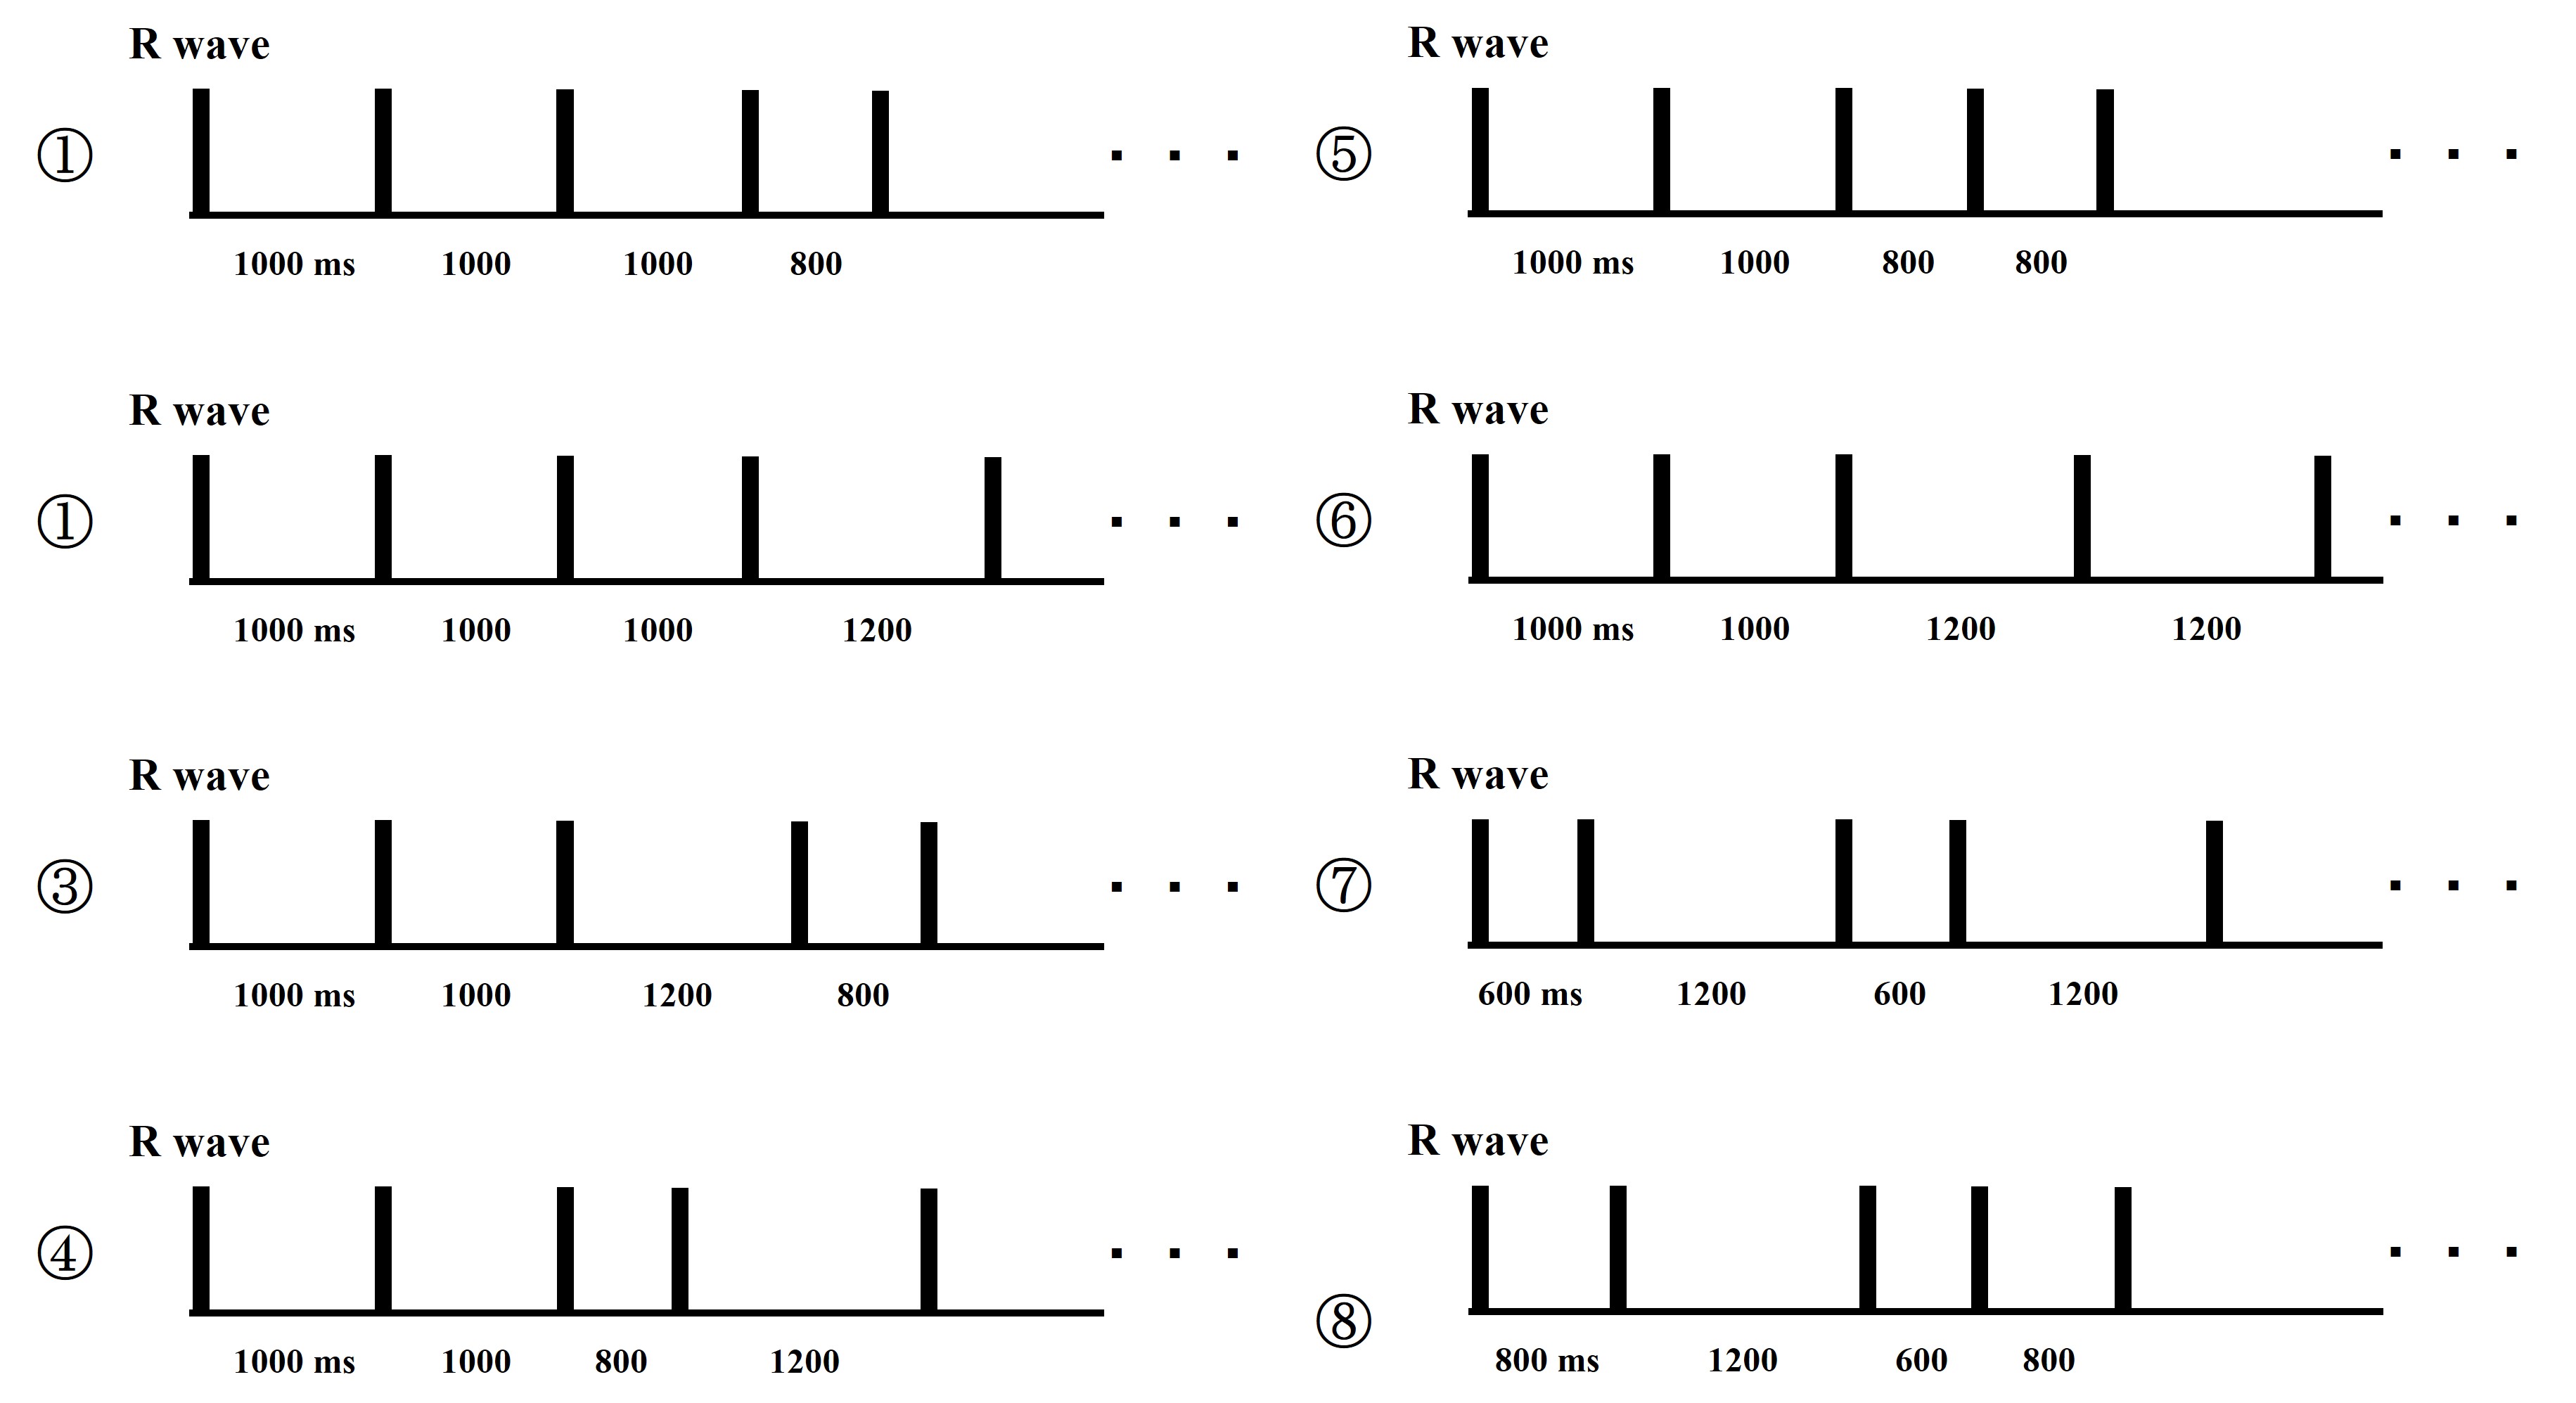
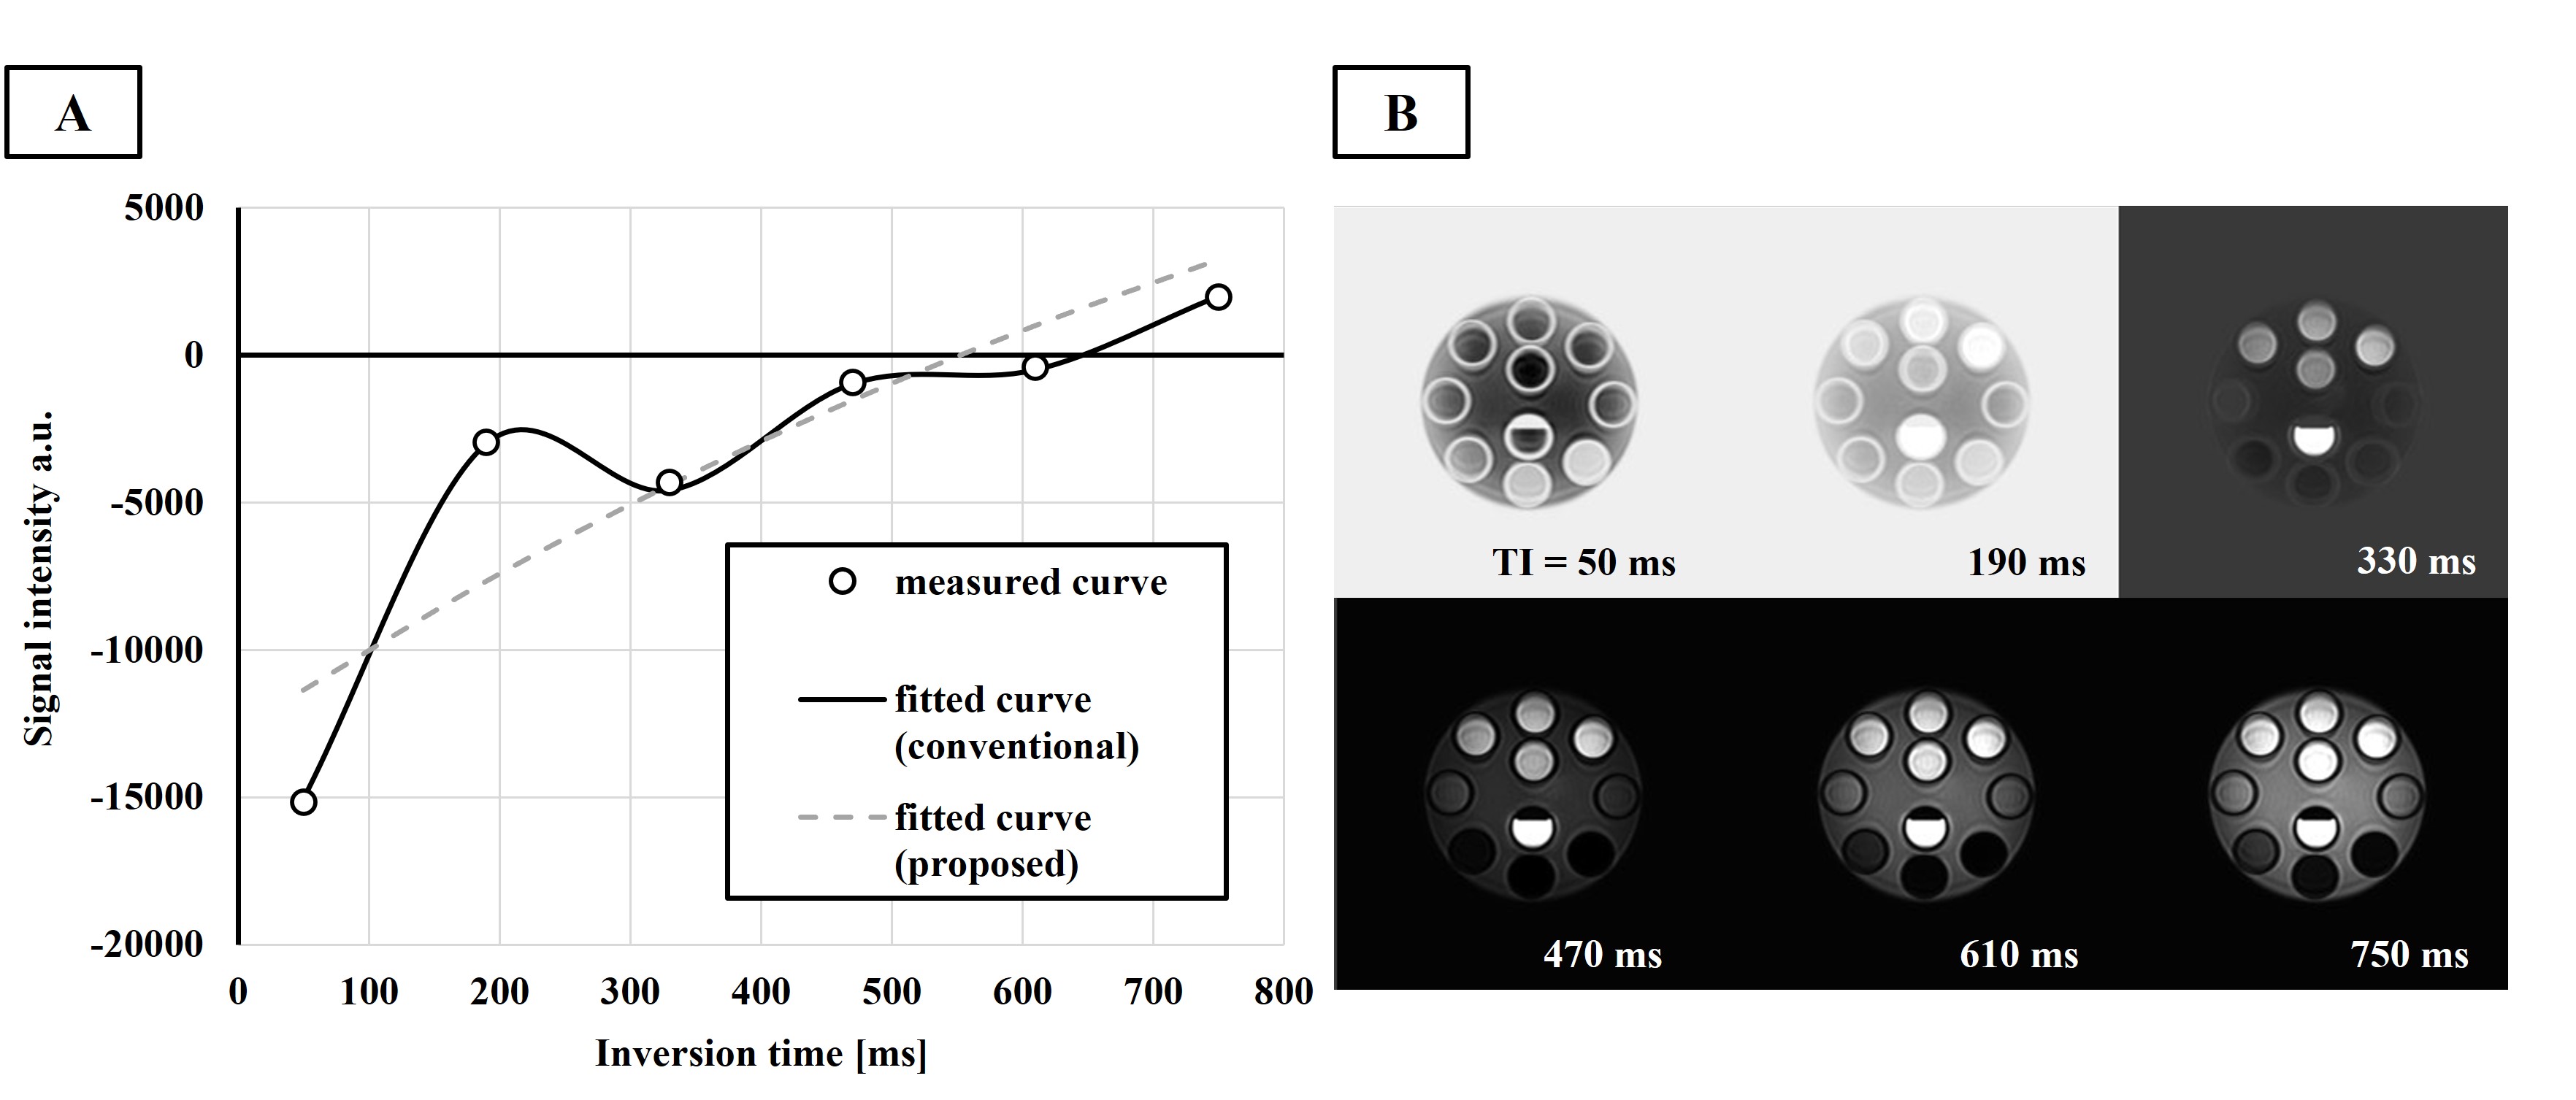
Figure 2. Acquired PCTIP images and curve fitting for T1 analysis.
B shows the phase-corrected images at each TI obtained using PCTIP. A shows the T1 relaxation observed from the PCTIP images of T1=1643 ms and the curve-fitted relaxation curves obtained by each analysis formula. The horizontal and vertical axes represent the inversion time and phase-corrected signals, respectively. The dots represent the measurement data, the broken line represents the T1 relaxation formula for analysis of the conventional method, and the solid line represents the formula of the proposed method.
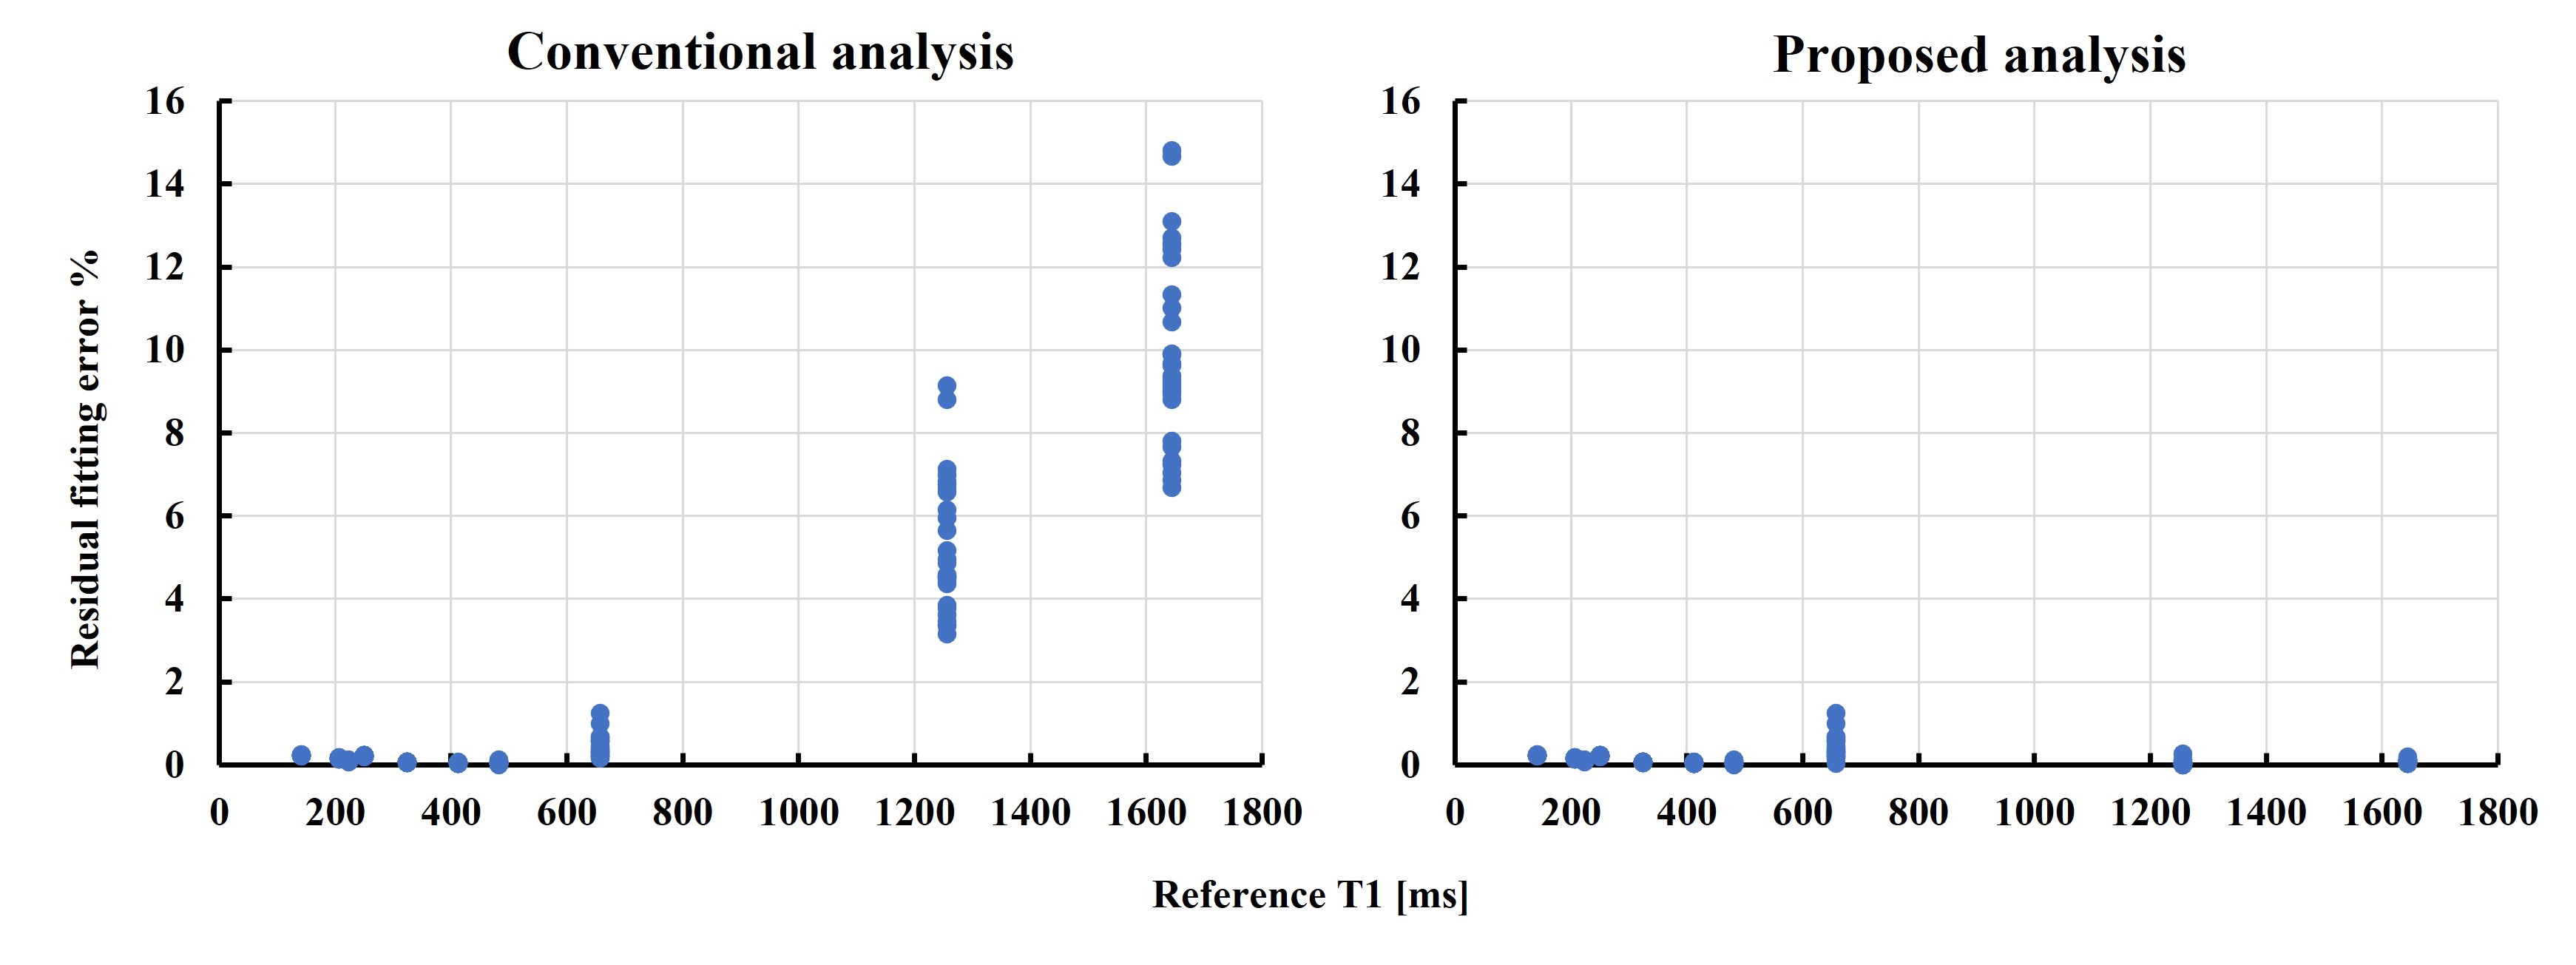
Figure 3. Comparison of errors in curve fitting in both analyses.
The horizontal axis shows the reference T1 values. The vertical axis shows the relative fitting error (%) as the sum of squares of the residuals normalized by the total signal strength in each analysis. On the left and right are the results of measurement T1 acquired using the conventional and proposed analysis formulas, respectively.
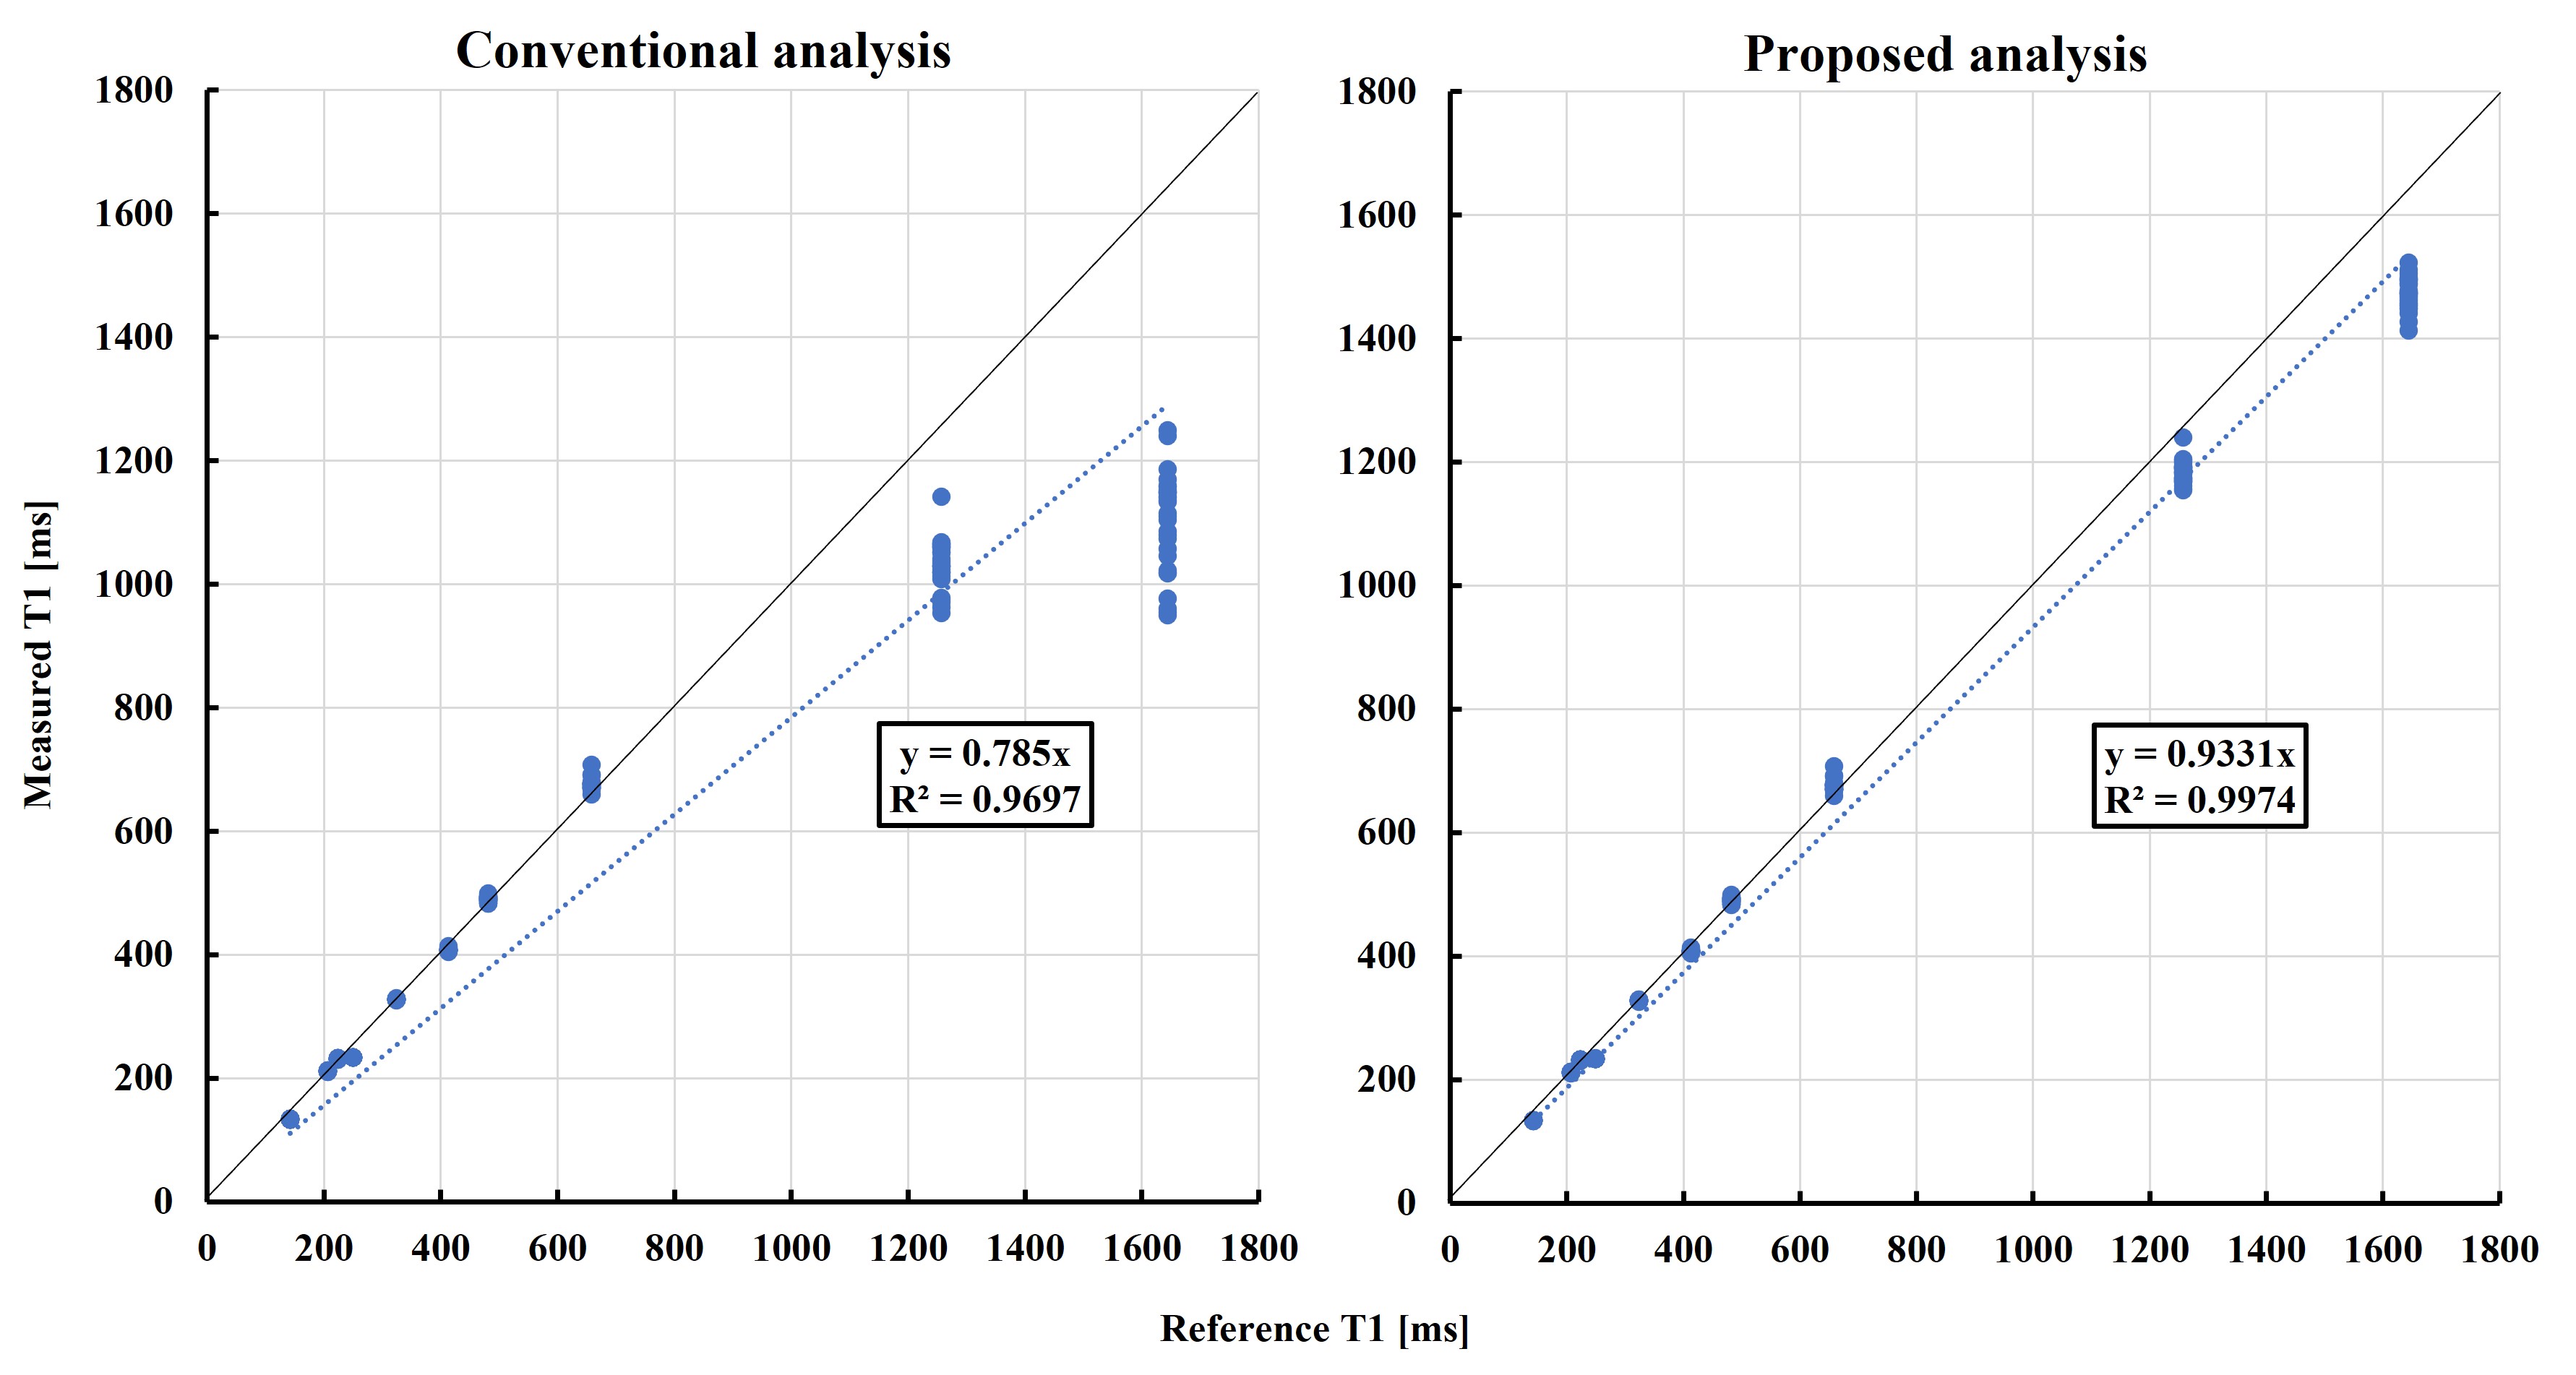
Figure 4. Comparison of the linearity of results with both analytical formulas against a reference standard.
The horizontal axis shows the reference T1 values. The vertical axis shows the T1 values of PCTIP for each analysis. On the left and right are the results of measurement T1 acquired using the conventional and proposed analysis formulas, respectively.
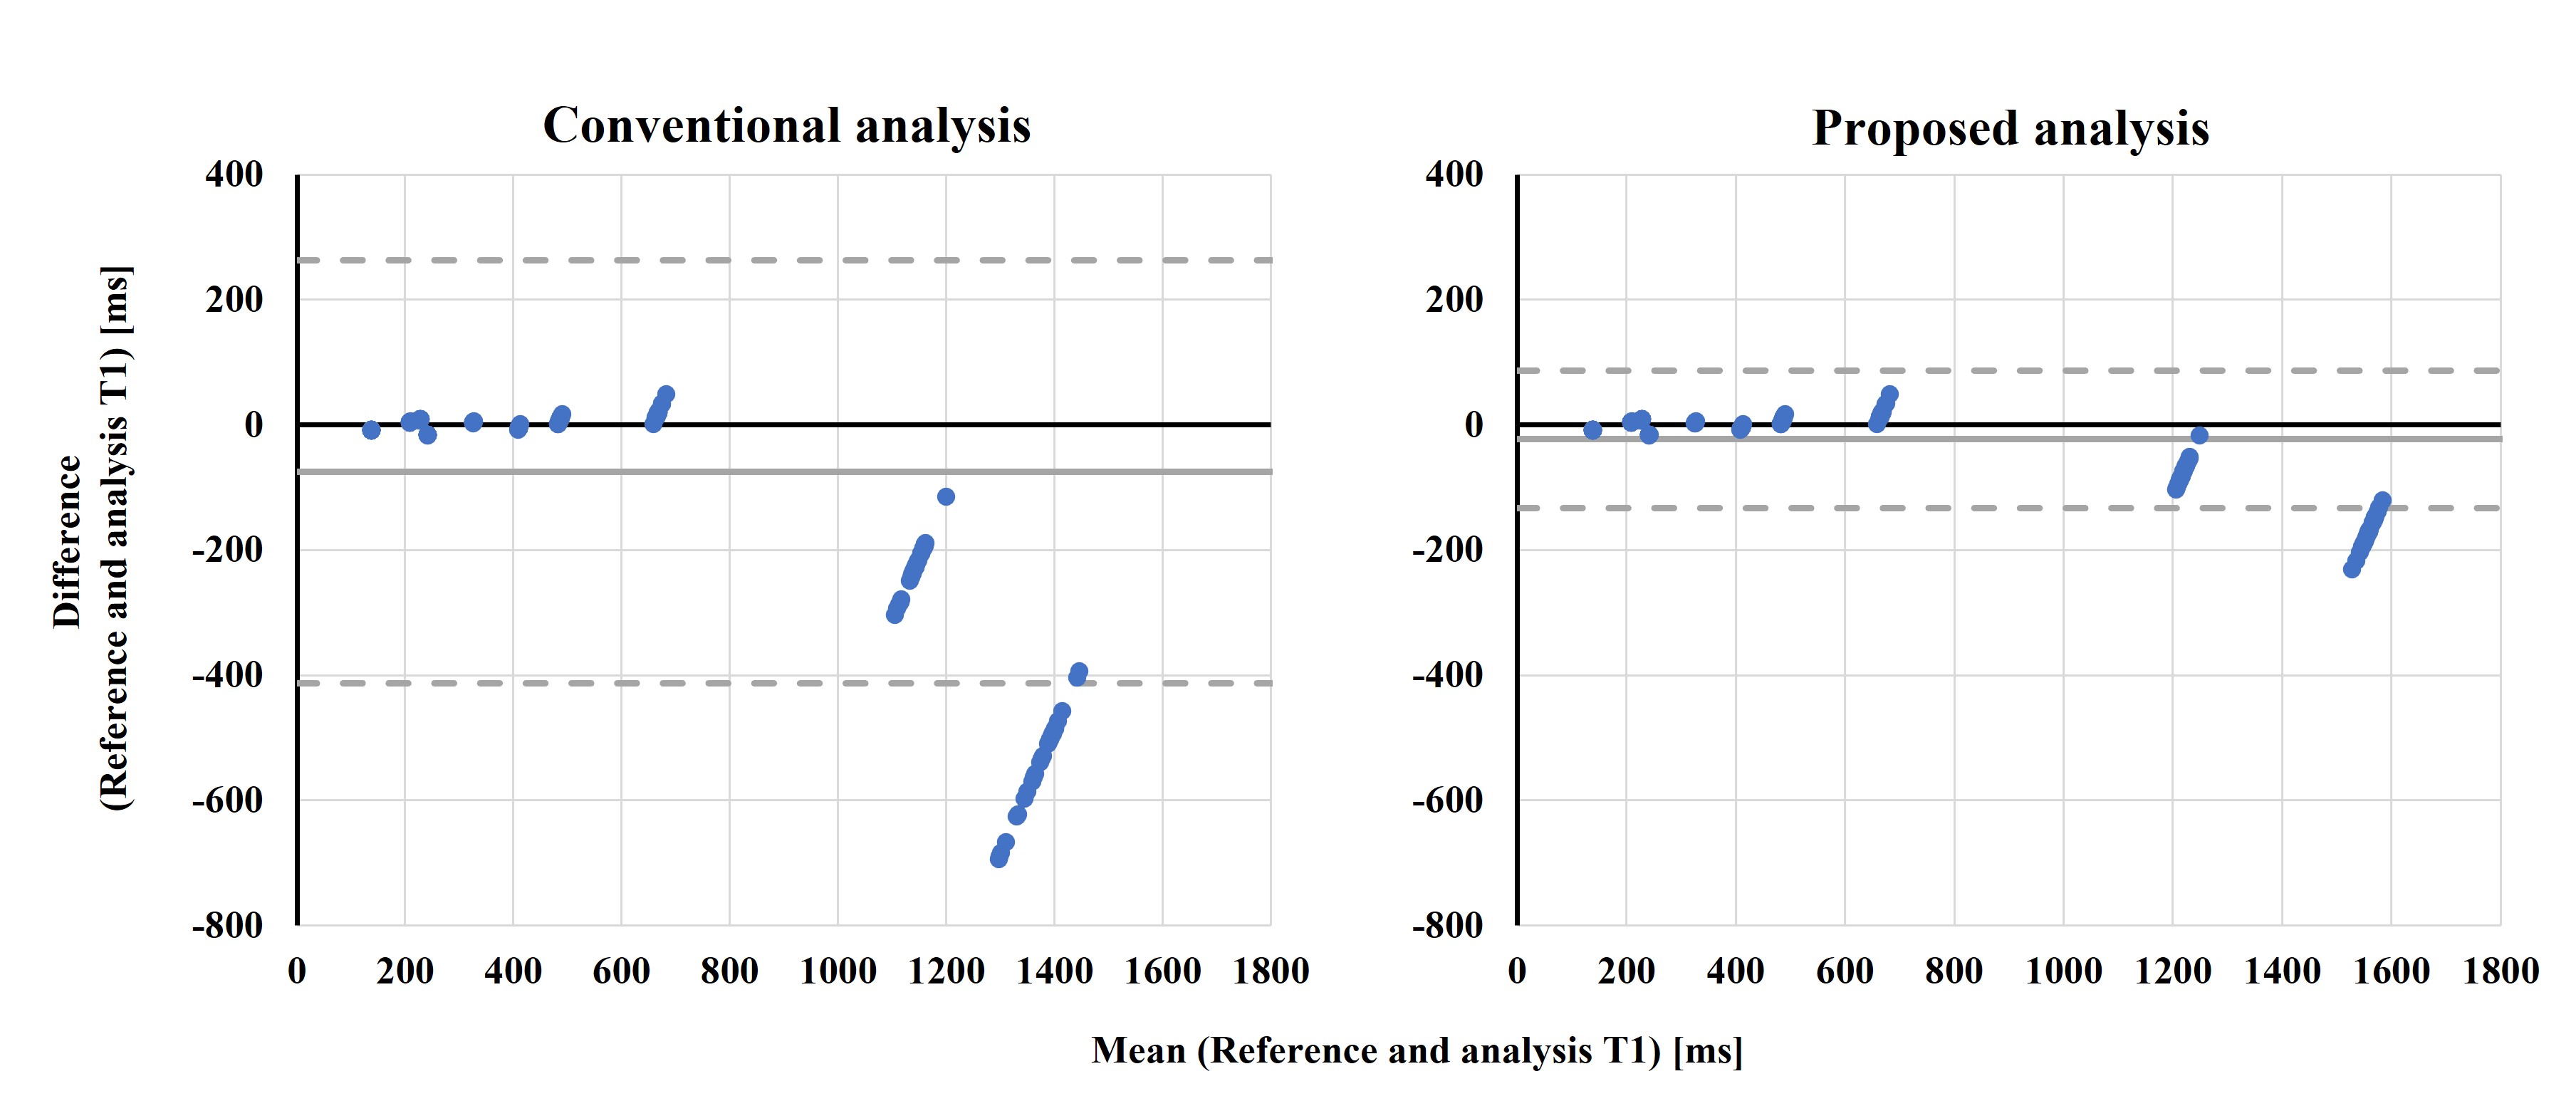
Figure 5. Comparison of results for both analytical formulas against a reference standard using Bland-Altman plots.
The horizontal and vertical axes show the mean and difference of the measured T1 between the reference standard and the results of the PCTIP using each analysis formula. Solid and dashed lines denote bias and 95% limits of agreement (LOA), respectively.