4009
Cardiac MR Susceptibility-weighted Imaging Detects Intramyocardial Hemorrhage of Acute Myocardial Infarction: comparison with T1 / T2 mapping1Tongji Hospital, Tongji Medical College, Huazhong University of Science and Technology., Wuhan, Hubei, China, China, 2MR Collaboration, Siemens Healthineers Ltd., Shanghai, China, China
Synopsis
Keywords: Myocardium, Myocardium, Susceptibility-weighted Imaging
Diagnosis of intramyocardial hemorrhage (IMH) in ST-segment elevation myocardial infarction (STEMI) patients following reperfusion treatment is critical for determining prognosis. This study investigated the feasibility of susceptibility-weighted imaging (SWI) to detect IMH in STEMI patients that underwent reperfusion therapy by comparing the diagnostic performance and image quality with T1/T2 mapping. SWI showed excellent diagnostic performance in detecting IMH among STEMI patients that underwent reperfusion treatment and was comparable with T1/T2 mapping. SWI is a sensitive technique to accurately diagnose IMH in STEMI patients following reperfusion treatment.
Introduction
Intramyocardial hemorrhage (IMH) is caused by severe reperfusion injury in patients with acute myocardial infarction, and is an independent predictor of major adverse cardiovascular events[1,2]. Susceptibility-weighted imaging (SWI) and T1/T2 mapping can be used to detect reperfusion-induced hemorrhage[3-5]. This study compared the image quality and diagnostic performances of SWI and T1/T2 mapping to detect IMH in patients with ST-segment elevation myocardial infarction (STEMI).Methods
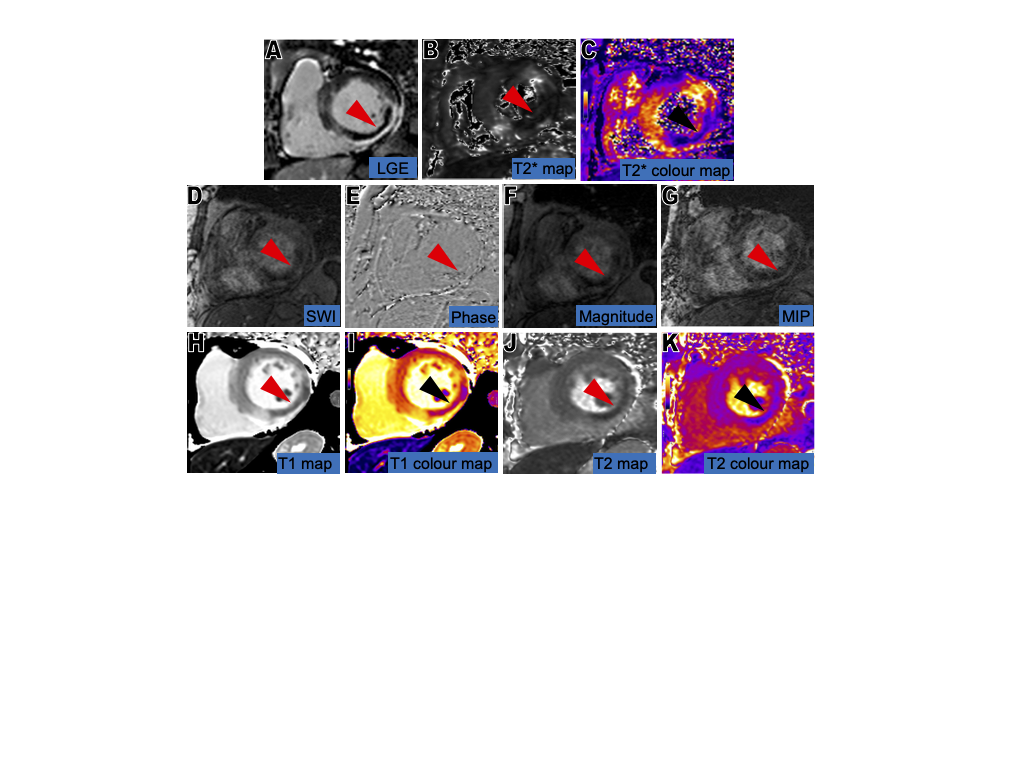
Thirty-six patients with acute STEMI including 30 males and median age of 56.5 (47.0- 64.3) years were prospectively recruited within 2-6 days of reperfusion treatment between January 2022 and July 2022. IMH was defined as an hypointense with a T2* value <20ms within the infarct region. The patients were divided into IMH and non-IMH groups.Cardiac magnetic resonance imaging (MRI) including T2* mapping, T1/T2 mapping, and SWI was performed on a MAGNETOM Skyra 3T MRI scanner (Siemens Healthcare, Erlangen, Germany). T2* mapping parameters were as follows: TR: 12.7 ms; TE: 2.56-17.68 ms with 2.16 ms interval and a total of 8 echoes; flip angle: 15°; FOV: 360mm×360mm; voxel size: 1.5mm×1.5mm×8.0mm. Native T1 mapping was performed at the basal, middle, and apical segments along the left ventricular (LV) short-axis using the Modified Look-Locker Inversion Recovery (MOLLI) sequence with a 5b(3b)3b (b for heartbeat) acquisition protocol.[6] Native T1 mapping parameters were as follows: TR: 2.5ms; TE: 1.2ms; flip angle: 35°; FOV: 360mm×360mm; voxel size: 1.4mm×1.4mm×5.0mm. T2 mapping parameters were as follows: three T2 preparation times (0ms, 30ms and 55ms) at different slices; TR: 3.3ms; TE: 1.35ms, flip angle: 15°; FOV: 360mm×360mm; voxel size: 1.9mm×1.9mm×5.0mm. SWI was acquired with the three-dimensional gradient echo sequence. The heartbeat artifacts were reduced by adjusting the phase-encoding direction and the artifacts in the infarcted myocardium would be less due to its decreased motion. The scan parameters for SWI were as follows: acceleration factor 1, TR: 9.0ms; TE: 6.27ms; flip angle: 15°; FOV: 340mm×340mm; voxel size: 0.8mm×0.8mm×2.5mm. The SWI, MIP, magnitude, and phase images were generated in-line.
Two cardiovascular radiologists independently evaluated all the cardiac MR images using the CVI42 software version 5.12.1 (Circle cardiovascular Imaging Inc., Canada). The signal intensity (SI) values of the remote myocardium (SIremote) and infarct myocardium (SIinfarct) were assessed for all patients with STEMI. The differences in SI between the remote myocardium and the infarct myocardium (SIremote-infarct) were estimated for each patient. Furthermore, the differences in the relative signal to noise ratio (rSNR) values between the IMH area and the remote myocardium (rSNRremote-IMH) were also estimated for all IMH patients.
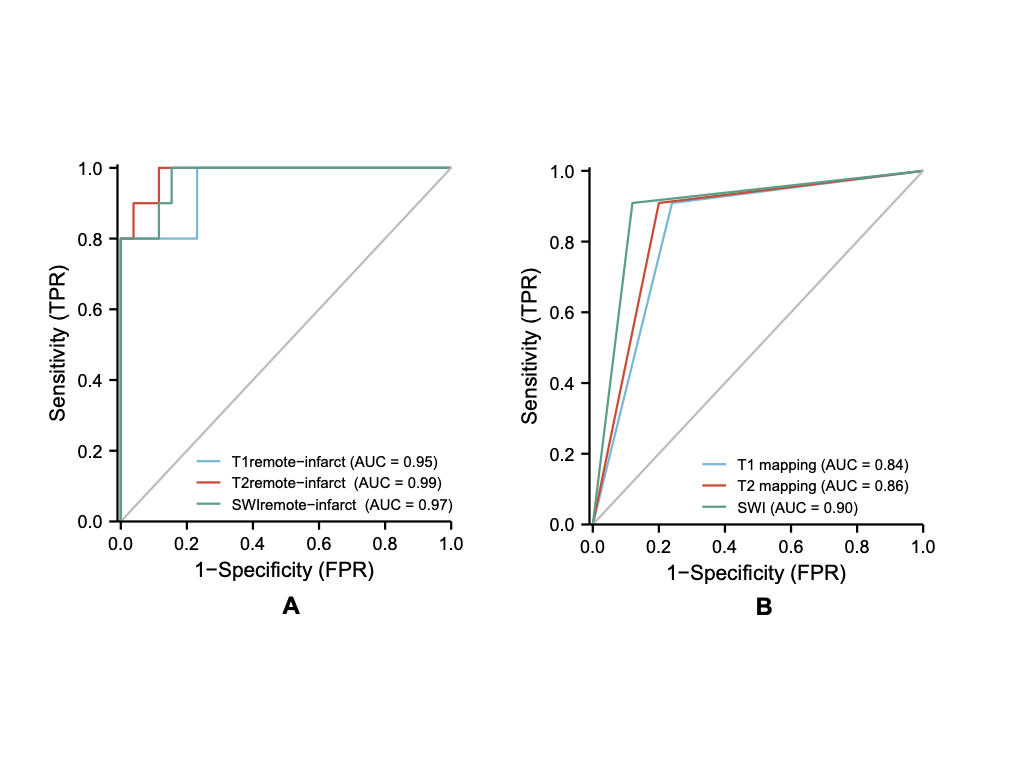
Statistical analysis was performed using the IBM SPSS Statistical software (version 23.0; Chicago, IL). The differences between SIremote and SIinfarct values from the three MRI sequences were analyzed using paired t test or the Mann-Whitney U test. The differences in the SIremote-infarct, rSNRIMH, and rSNRremote-IMH values among the three MRI sequences were analyzed by One-way ANOVA or Kruskal–Wallis test. Receiver operating characteristic (ROC) curve analysis was performed to analyze the diagnostic performances of the three sequences in detecting IMH. P<0.05 was considered statistically significant.
Results
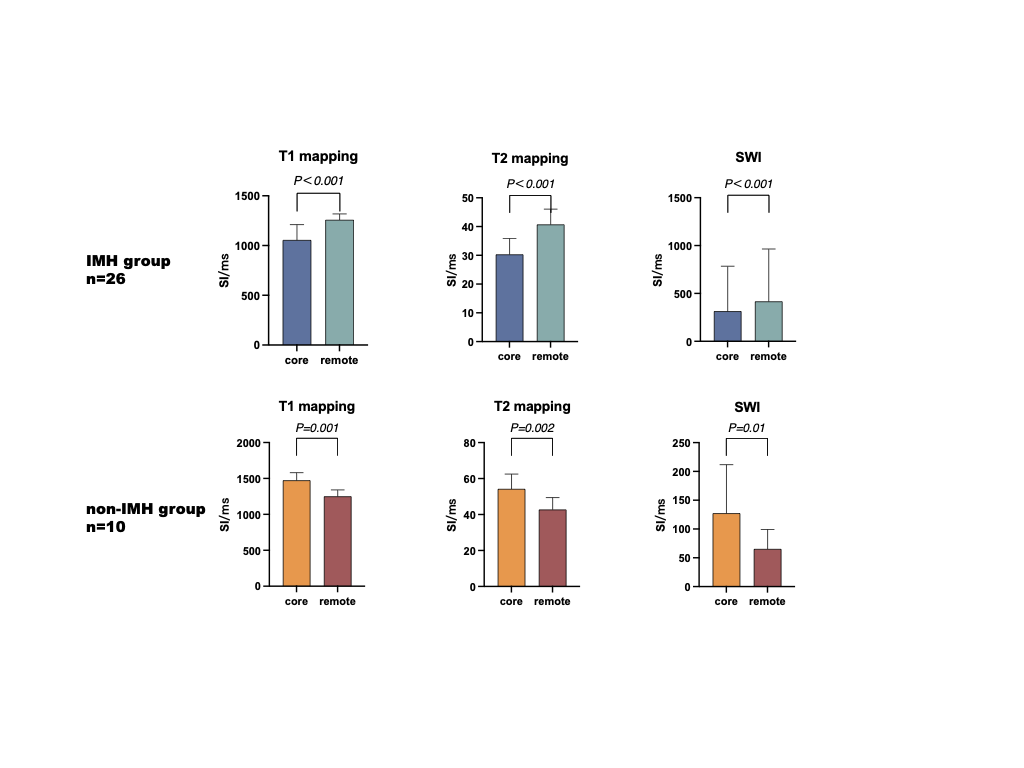
T2* map results identified 26 STEMI patients (72.2%) with IMH and 10 STEMI patients (27.8%) without IMH. Figure 1 shows MR images for a representative STEMI patient with IMH.Our data showed that SIinfarct values were significantly lower than the SIremote values in the IMH group (P<0.001 for all), whereas SIinfarct values were significantly higher than the SIremote values in the non-IMH group (P<0.01 for all) based on both SWI and T1/T2 mapping data (Figure 2).Quantitative and qualitative ROC curve analysis demonstrated that SWI and T1/T2 mapping accurately detected IMH with no statistical difference (all P>0.05) (Figure 3). The rSNRIMH values were highest for T1 mapping followed by T2 mapping and SWI (P <0.05 for all). The rSNRremote-IMH value was the highest for T1 mapping but was similar for both T2 mapping and SWI.
Discussion
Our study demonstrated that diagnostic performances of SWI, T1 mapping, and T2 mapping to detect IMH in STEMI patients were excellent. The SIremote-infarct values from all the 3 sequences were significantly different between IMH and non-IMH groups. These results showed that the hypointense core of the infarct zone was clearly distinguishable from the normal myocardium as shown in previous studies.[7,8] Our study showed that SNR and rSNRremote-IMH values from the T1 and T2 mapping data were higher than those from the SWI data. However, diagnostic performances of all 3 techniques did not show any significant differences, both quantitatively or qualitatively. This suggested that SWI was highly sensitive in detecting the phase change of small-sized structures.[3] Therefore, small-size IMH can be easily identified on the SWI compared to the T1/T2 mapping images despite longer breath-holding time. These results suggested that SWI can be used to quantify the size of IMH and assess prognosis of STEMI patients with IMH.Conclusion
SWI is a feasible method with excellent diagnostic performance in detecting IMH among patients with STEMI. It is comparable with T1/T2 mapping for estimating IMH and can serve as an alternative when T2* images are not available.Keywords
Susceptibility-weighted Imaging, T1 mapping, T2 mapping, Intramyocardial Hemorrhage, Cardiac Magnetic ResonanceAcknowledgements
No acknowledgement found.References
[1]. Ferre-Vallverdu M, Sanchez-Lacuesta E, Plaza-Lopez D, et al. Prognostic value and clinical predictors of intramyocardial hemorrhage measured by CMR T2* sequences in STEMI. Int J Cardiovasc Imaging. 2021, 37(5):1735-44.
[2]. Assimopoulos S, Shie N, Ramanan V, et al. Hemorrhage promotes chronic adverse remodeling in acute myocardial infarction: a T1, T2 and BOLD study. NMR in Biomedicine. 2021, 34(1):e4404.
[3]. Kidambi A, Biglands JD, Higgins DM, et al. Susceptibility-weighted cardiovascular magnetic resonance in comparison to T2 and T2 star imaging for detection of intramyocardial hemorrhage following acute myocardial infarction at 3 Tesla. J Cardiovasc Magn Reson. 2014, 16(1):86.
[4]. Bulluck H, Rosmini S, Abdel-Gadir A, et al. Diagnostic performance of T1 and T2 mapping to detect intramyocardial hemorrhage in reperfused ST-segment elevation myocardial infarction (STEMI) patients. J Magn Reson Imaging. 2017, 46(3):877-86.
[5]. Goldfarb JW, Hasan U, Zhao W, et al. Magnetic resonance susceptibility weighted phase imaging for the assessment of reperfusion intramyocardial hemorrhage. Magn Reson Med. 2014, 71(3):1210-20.
[6]. Kellman P, Hansen MS. T1-mapping in the heart: accuracy and precision. Journal of cardiovascular magnetic resonance. 2014, 16(1):1-20.
[7]. O'Regan DP, Ahmed R, Karunanithy N, et al. Reperfusion hemorrhage following acute myocardial infarction: assessment with T2* mapping and effect on measuring the area at risk. Radiology. 2009, 250:916-22.
[8]. Kali A, Tang RL, Kumar A, et al. Detection of acute reperfusion myocardial hemorrhage with cardiac MR imaging: T2 versus T2. Radiology. 2013, 269(2):387.
Figures