4008
Texture analysis of area-at-risk based on T1-mapping associated with infarct characteristics following acute STEMI
Jiali Wang1, Kai Xu1, Chunfeng Hu1, Yankai Meng1, Shuguang Han1, Peng Wu2, Lu Han2, and Yongzhou Xu3
1The Affiliated Hospital of Xuzhou Medical University, Xuzhou, China, 2Philips Healthcare, Shanghai, China, 3Philips Healthcare, Guangzhou, China
1The Affiliated Hospital of Xuzhou Medical University, Xuzhou, China, 2Philips Healthcare, Shanghai, China, 3Philips Healthcare, Guangzhou, China
Synopsis
Keywords: Myocardium, Ischemia, T1 mapping
To assess the potential of texture analysis (TA) of area-at-risk (AAR) based on native T1 mapping in predicting the severity of injury in ST-segment elevation myocardial infarction (STEMI) patients. Cine, T1 mapping, and late gadolinium enhancement (LGE) images were analyzed to evaluate cardiac function, and scar characteristics. The predictive value of TA for adverse LV remodeling (ALVR) and large final infarct size was evaluated. Entropy and uniformity (parameters of TA) in AAR of T1 mapping were highly correlated with convalescent infarct size, uniformity independently predicted large final infarct size, however, TA of AAR was not associated with convalescent ALVR.Introduction
Despite the fact that timely reperfusion by the primary percutaneous coronary intervention (PCI) has reduced cardiovascular mortality in ST-segment elevation myocardial infarction (STEMI), progressive adverse left ventricular remodeling (ALVR) and cardiac insufficiency have become leading causes of death1. Texture analysis (TA) on cardiovascular magnetic resonance (CMR) can provide additional information for traditional methods to improve clinical diagnosis and risk prediction2. At present, TA based on native T1 mapping for the prediction of myocardial damage after STEMI is uncertain. Thus, we investigated the additional predictive value of TA parameters (entropy and uniformity) of area-at-risk (AAR) on native T1 mapping in predicting myocardial injury and short-term ALVR in patients with STEMI treated with PCI.Methods
Seventy-eight patients with STEMI, which were successfully treated with PCI within 12 h from symptom onset and underwent two CMR examinations post-PPCI at 7 days (acute phase) and 4 months (convalescent phase) respectively were included. The patient flowchart is shown in Figure 1. All CMR examinations were performed on a 3.0 T MR scanner (Ingenia, Philips Healthcare, Amsterdam, Netherlands) with surface body coil and posterior spinal coil. The protocol and parameters were: cine imaging was performed using steady-state free precession (SSFP), echo time (TE) = 1.3ms; repetition time (TR) = 2.6ms; flip angle = 45°; slice thickness 7 mm; matrix = 236 × 161 pixels; field of view (FOV) = 350mm × 350 mm. T2 weighted imaging (T2WI): TR/TE, 1643/ 80ms; flip angle, 90°; thickness, 7 mm, FOV, 300mm × 300 mm. Native T1 mapping was scanned using modified Look-Locker inversion recovery (MOLLI) with a 5 s (3 s) 3 s scan scheme, the parameters were TR/TE, 2.3/1.0ms; flip angle, 25°; FOV, 300 × 300 mm, covering the base, mid-ventricular, and apex level of LV. LGE sequence [TR/TE, 3.0/ 6.1ms; flip angle, 25°; and slice thickness, 7 mm] was obtained 10–15 min after the administration of contrast agents.Cvi42 (Circle Cardiovascular Imaging, cvi42®, v5.12.4, Calgary, Alberta, Canada) analysis software was used to assess LV function, including left ventricular end-diastolic volume (LVEDV), left ventricular end-systolic volume (LVESV) and left ventricular ejection fraction (LVEF), and scar characteristics as described previously. AAR was defined as LV myocardium with pixel values > 2SDs of remote myocardium on T2WI3. The LVEDV and LVESV parameters obtained by two CMR examinations were used to evaluate short-term ALVR: LVESV and/or LVEDV increased ≥ 12% was defined as ALVR at about 4 months4. Large final infarcts at the convalescent phase were defined using a final infarct size cut-off of 9.5% on LGE, as a surrogate for long-term clinical prognosis.
The slice with the largest infarct size was chosen for native T1 mapping analysis and TA analysis. Native T1 values of AAR (T1a) was measured using a dedicated workstation (Intelligence Space Portal, version 10.1, Philips Healthcare, Amsterdam, Netherlands), and the 3D-slicer (Version 4.11) was used for TA analysis. Entropy and uniformity within the region of interest were extracted to quantify the heterogeneity of native T1mapping images (Figure 2).
Statistical analysis was performed using the statistical software SPSS 22.0. The two-tailed p-value <0.05 indicated statistical significance.
Results
Entropy and uniformity of AAR in native T1 correlated with convalescent infarct size (IS) (r = 0.58, P < 0.001; r = -0.61, P < 0.001, respectively), and uniformity was independently associated with large final IS (OR = 0.327, 95% CI = 0.128–0.832, P = 0.019).30.8% of patients suffer short-term ALVR at about 4M after MI. Patients with ALVR had larger entropy, native T1a, and lower uniformity than patients without ALVR in the acute phase (all P <0.05). However, acute entropy and uniformity were not independent predictors of ALVR (Figure 3).
Discussion
Myocardial injury after reperfusion in STEMI is a dynamic process involving a complex cascade. Changes in histology may cause changes in texture that are suitable for analysis. TA allows for the assessment of spatial distributions of gray levels and pixels for discrimination and diagnosis5. The heterogeneity of the AAR was assessed by two texture parameters in our study: uniformity and entropy. Higher entropy and lower uniformity represent increased heterogeneity. Our results demonstrated that entropy and uniformity based on native T1 mapping images were positively and inversely correlated with convalescent infarct size, respectively, and final infarct size is a strong predictor for the prognosis in patients with STEMI. Therefore, the heterogeneity of the injured myocardium on native T1 mapping may have important prognostic significance after MI. However, our study failed to find a correlation between texture features and short-term adverse LV remodeling. Further confirmatory studies will be needed. Native T1 mapping has emerged as the preferred approach to quantify myocardial T1 value without contrast agents, adding a new dimension to the information provided by conventional CMR methods6, but our results suggest that native T1 in AAR was not an independent predictor of short-term ALVR. The reasons for the different results may be the influence of MVO, different time points of imaging, or various MR scanners.Conclusion
We demonstrated the heterogeneity property of AAR on native T1mapping was associated with final infarct size. The prognostic value of native T1 mapping can be incorporated as complementary parameters to improve the predictive power of CMR imaging.Acknowledgements
No acknowledgement found.References
- J.F. Rodriguez-Palomares, J. Gavara, I. Ferreira-Gonzalez, et al. Prognostic value of initial left ventricular remodeling in patients with reperfused STEMI. JACC Cardiovasc. Imaging. 2019; 12 (12): 2445–2456.
- Q. Ma, Y. Ma, X. Wang, et al. A radiomic nomogram for prediction of major adverse cardiac events in ST-segment elevation myocardial infarction. Eur Radiol. 2021; 31 (2) : 1140-1150.
- Z.Y. Fan, C.W. Wu, D.A. An et al. Myocardial area at risk and salvage in reperfused acute MI measured by texture analysis of cardiac T2 mapping and its prediction value of functional recovery in the convalescent stage. Int J Cardiovasc Imaging. 2021; 37(12) : 3549-3560.
- H. Bulluck, J. Carberry, D. Carrick, et al. Redefining adverse and reverse left ventricular remodeling by cardiovascular magnetic resonance following ST-segment-elevation myocardial infarction and their implications on long-term prognosis. Circ Cardiovasc Imaging. 2020; 13 (7): e009937.
- B. Baessler, C. Luecke, J. Lurz, et al. Cardiac MRI texture analysis of T1 and T2 maps in patients with infarct-like acute myocarditis. Radiology. 2018; 289 (2) : 357-365.
- M.X. Yang, Y. He, M. Ma, et al. Characterization of infarcted myocardium by T1-mapping and its association with left ventricular remodeling. Eur J Radiol. 2021; 137: 109590.
Figures
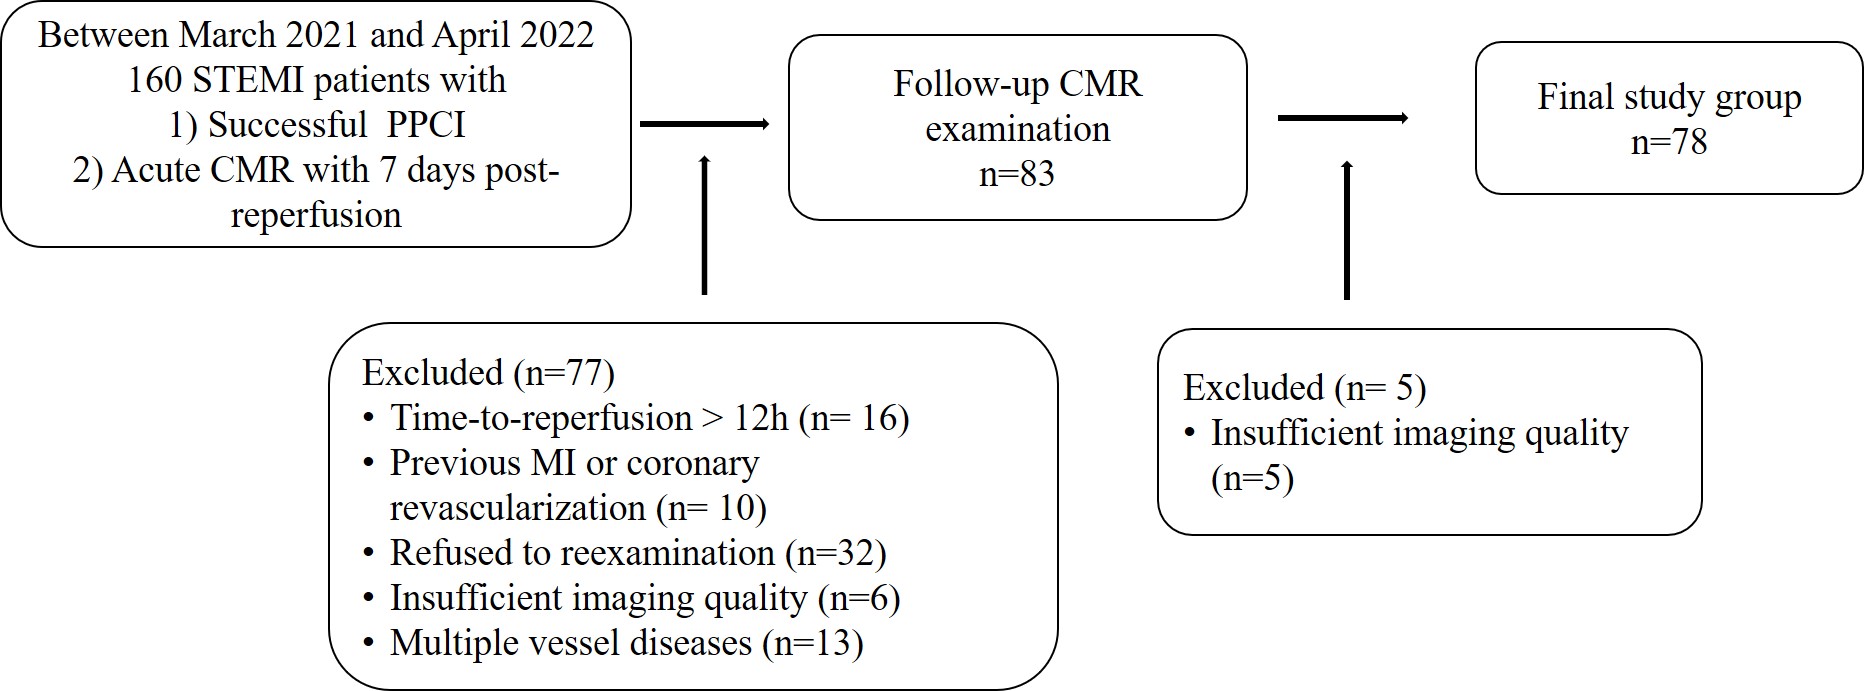
Figure 1 The patient flowchart.
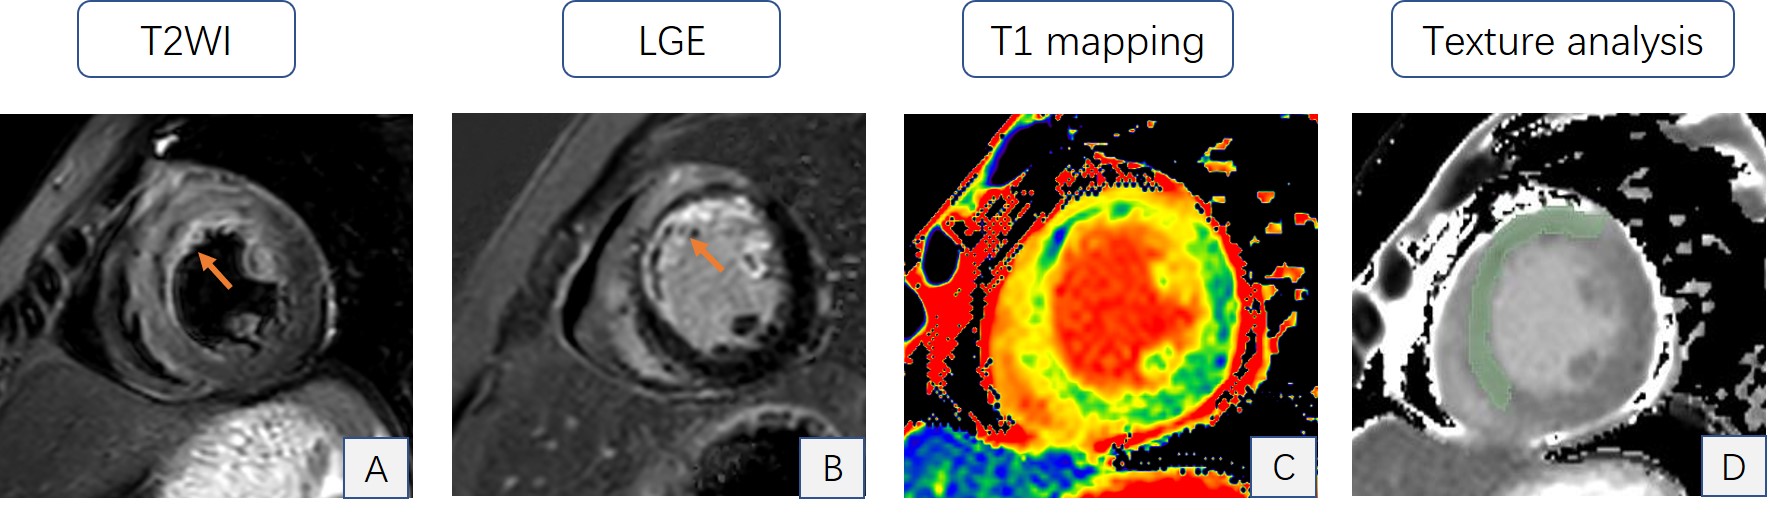
Figure 2 Image
shows the mid-cavity section in acute cardiac resonance imaging of one
post-ST-segment-elevation myocardial infarction patient. A and B short-axis T2
weighted image and late gadolinium enhancement (LGE) image show the large
extent of the infarction zone (arrow). C. A short-axis T1 map matching the LGE
showed an increased T1 value in the infarction zone compared to that in the
remote zone. D. Radiomic feature extracted (green part) from the native T1
mapping using a 3D slicer.

Figure 3
Correlation between convalescent infarct size and early post-myocardial
infarction entropy (A); and uniformity (B). Receiver operating characteristic
(ROC) analyses for predicting short-term adverse left ventricular remodeling
(C) and large final infarct size (D).

Table 1 CMR findings
DOI: https://doi.org/10.58530/2023/4008