4007
3D whole-heart joint T1/T1ρ mapping and water/fat imaging at low-field 0.55T scanner1School of Biomedical Engineering and Imaging Sciences, King's College London, London, United Kingdom, 2MR Research Collaborations, Siemens Healthcare Limited, Camberley, United Kingdom, 3Institute for Biological and Medical Engineering, Pontificia Universidad Catolica de Chile, Santiago, Chile, 4School of Engineering, Pontificia Universidad Catolica de Chile, Santiago, Chile
Synopsis
Keywords: Myocardium, Low-Field MRI
Native T1 and T1ρ mapping has shown promising results for the detection of focal and diffuse myocardial fibrosis without requiring contrast agents. However, conventional myocardial maps are acquired sequentially in 2D at 1.5T/3T fields. 3D joint T1/T1ρ mapping has recently been proposed at 1.5T, but not demonstrated at lower field, which could potentially make cardiac MRI more accessible and affordable. Furthermore, lower T1 relaxation times, reduced SAR and fewer B0/B1 inhomogeneities make low-field MRI an attractive alternative for joint T1/T1ρ mapping. Here, we investigate the feasibility of novel 3D whole-heart joint T1/T1ρ mapping on the latest 0.55T MR scanner generation.Introduction
Native T1 and T1ρ mapping has shown promising results for the detection of focal and diffuse myocardial fibrosis without the need of contrast agents1,2. However, conventional myocardial maps are acquired sequentially in 2D breath-hold scans with limited heart coverage at 1.5T or 3T fields. A 3D whole-heart joint T1/T1ρ mapping sequence with Dixon encoding has recently been proposed at 1.5T3. However, this approach has not been demonstrated at lower fields, which may provide more affordable access to cardiac MRI in the future4. Furthermore, lower T1 relaxation times (improved T1 sensitivity), reduced SAR (higher spin-locking frequencies) and fewer B0/B1 inhomogeneities (fat-water separation) make low-field MRI an attractive alternative for joint T1/T1ρ mapping5. Here, we investigate the feasibility of a novel free-breathing, 3D whole-heart joint T1/T1ρ mapping sequence with Dixon encoding to provide native 3D T1 and T1ρ maps with isotropic resolution and co-registered water and fat volumes for myocardial tissue characterisation on the latest 0.55T MR scanner generation.Methods
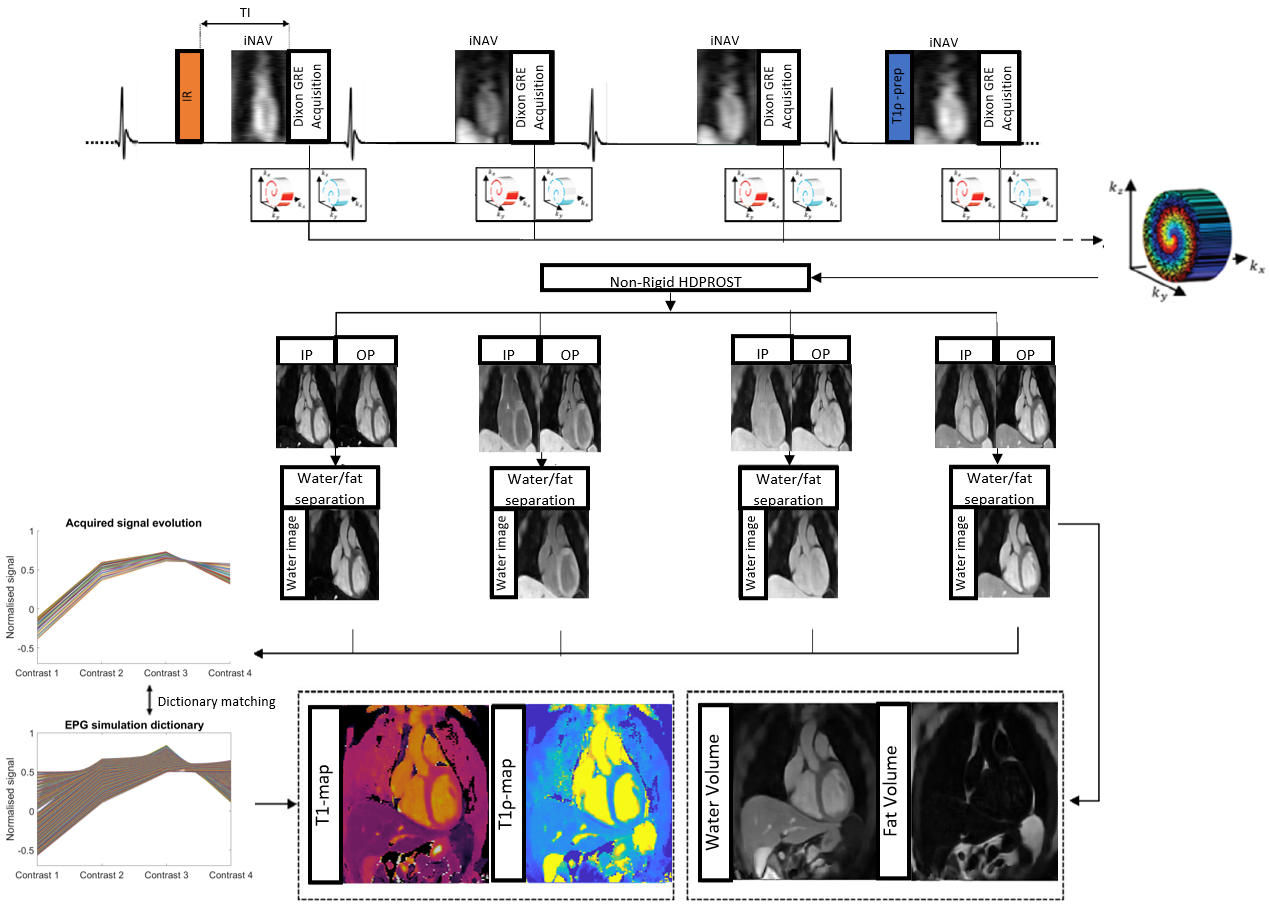
The ECG-triggered 3D joint T1/T1ρ research sequence (Fig. 1) consists of a repeating set of preparation modules over 4 heartbeats (HBs): IR preparation (TI=245ms), no preparation, no preparation and T1ρ preparation (spin-lock duration(TSL)/amplitude(fSL)=40ms/175Hz). A 2-point Dixon GRE read-out (TE1/TE2/TR=2.6/6.5/9.7ms, flip angle=8o, bandwidth=451 Hz/pixel, spatial resolution 2 mm isotropic) is used every HB to acquire pseudo in-phase (IP) and opposed-phase (OP) echoes. A 4x undersampled variable-density Cartesian trajectory with spiral profile order and golden angle step6 is used to acquire the 3D data. 2D image navigators (iNAVs)7 acquired prior to each spiral are used to perform beat-to-beat translational respiratory motion estimation and correction, as well as to bin the 3D data into 4 equally populated respiratory bins for estimation of bin-to-bin 3D non-rigid motion8. The 8 3D image contrasts (pseudo IP and OP echoes for each HB) are reconstructed using non-rigid motion correction with patch-based multi-dimensional low-rank regularisation (HD-PROST)9. Water and fat images are estimated from the reconstructed IP/OP HB images10. An EPG simulation11 was used to generate a dictionary with Np~6.7k T1/T1ρ parameter combinations, and mapping was performed voxel-by-voxel by maximising the inner-product of the dictionary and water HB images. Research 2D MOLLI12 and 2D T1ρ13 maps were acquired during a breath-hold at 0.55T and used as a reference to compare with proposed 3D joint T1/T1ρ values. For 2D T1ρ reference, the sequence13 was adapted from a bSSFP readout with Fat-Sat at 1.5T to a 2-echo Dixon GRE readout (TE1/TE2/TR=2.6/6.2/9.5ms, flip angle=20o) at 0.55T. Four T1ρ-contrasts were acquired (TSL=5,15,30,40 ms) in a total of 12 HB breath-hold sequence. Mono-exponential fitting of reconstructed water contrast images was used to estimate a 2D T1ρ map. For 3D joint T1/T1ρ and 2D T1ρ, TSL was limited to 40ms (with fSL=175 Hz) due to the maximum power of the RF amplifier available in the scanner.Data was acquired on a 0.55T MR scanner (MAGNETOM Free.MAX, Siemens Healthcare, Erlangen, Germany) on phantoms with varying simulated heart rate (HR) and on 4 healthy subjects.
Results
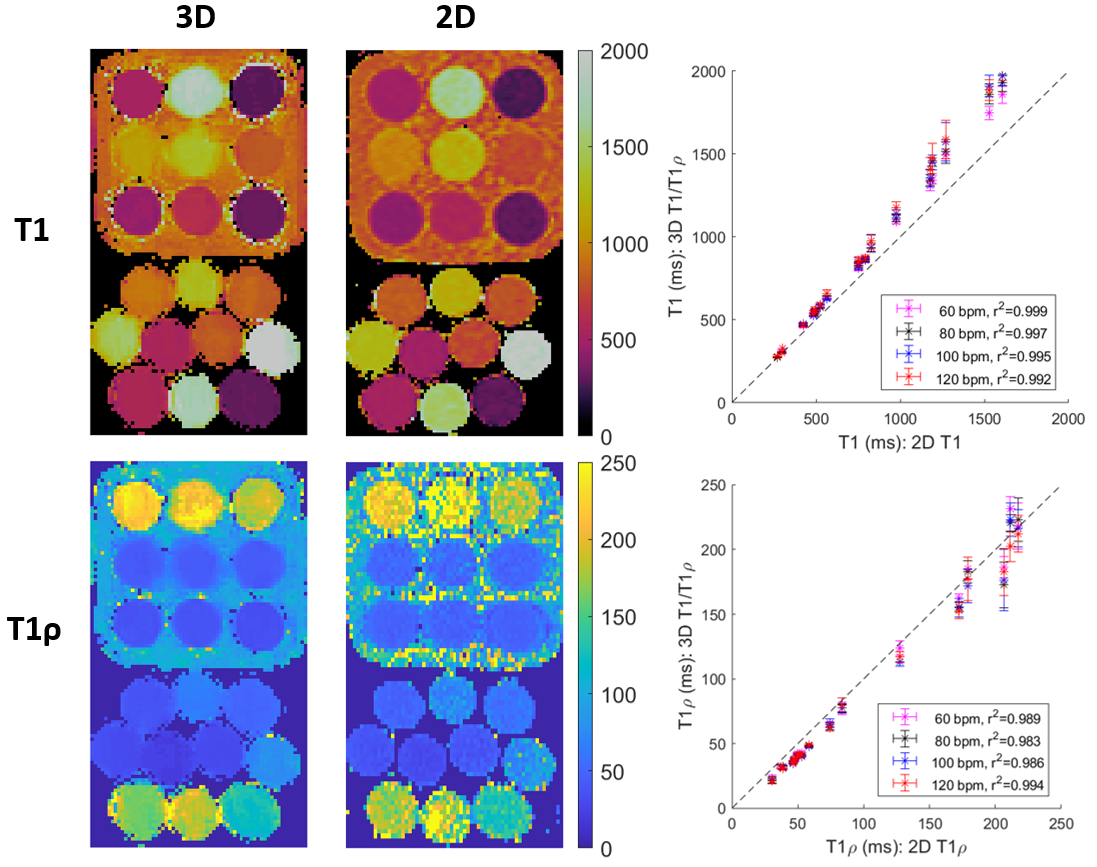
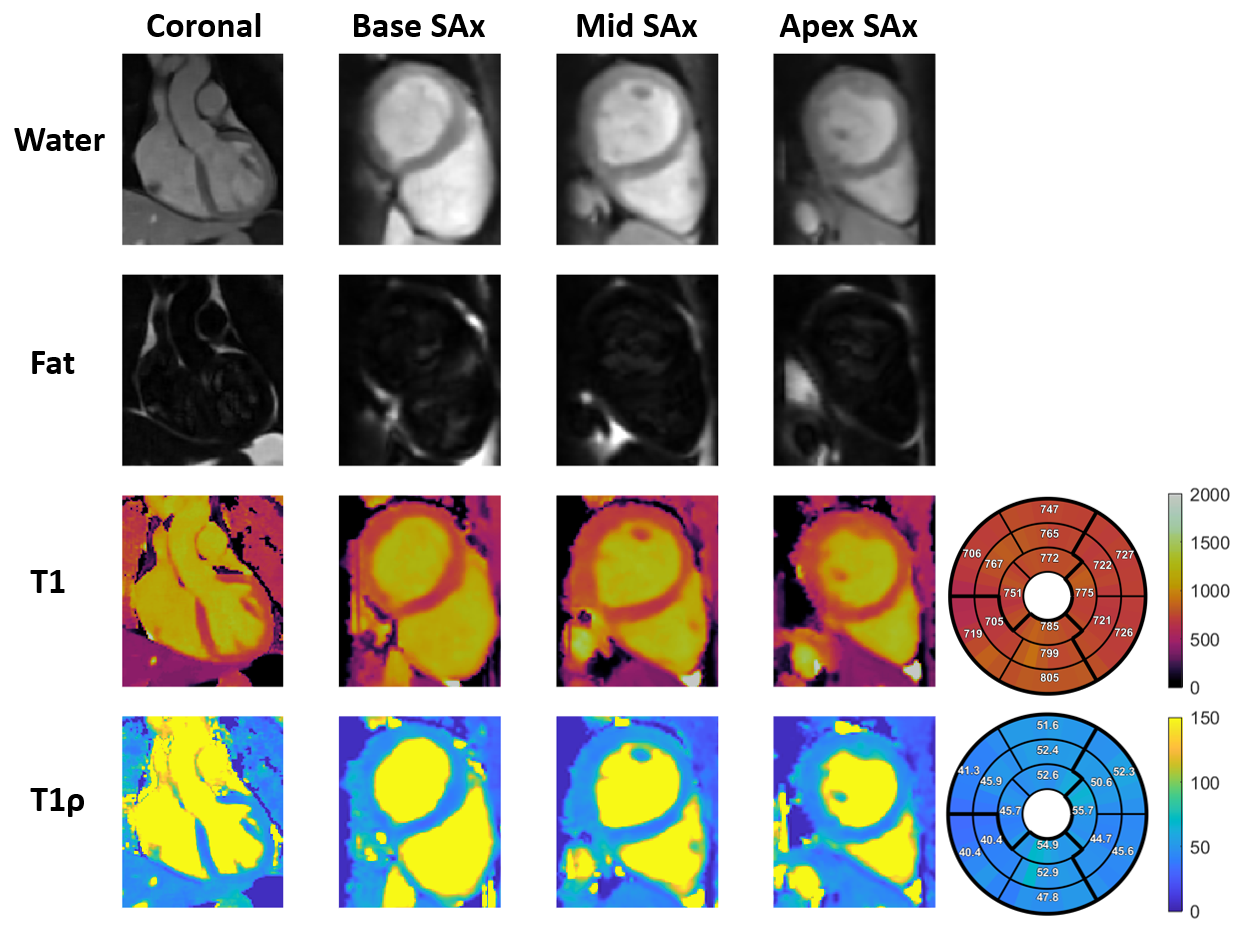
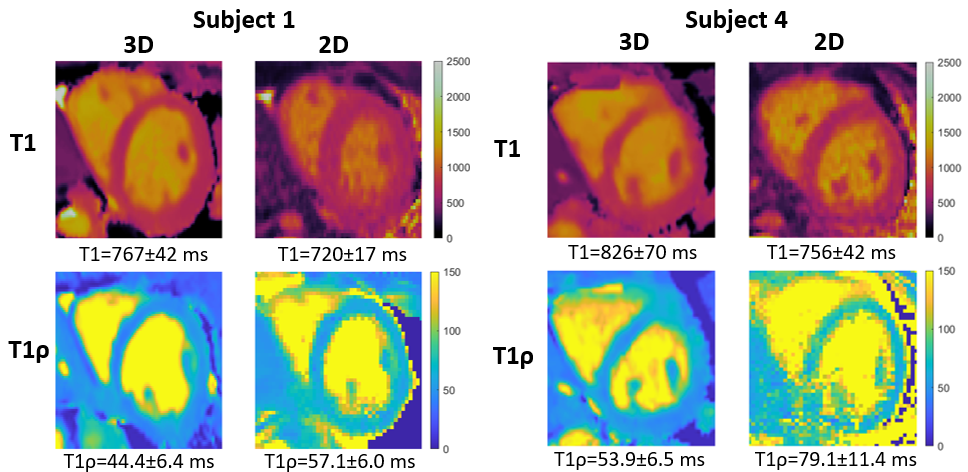
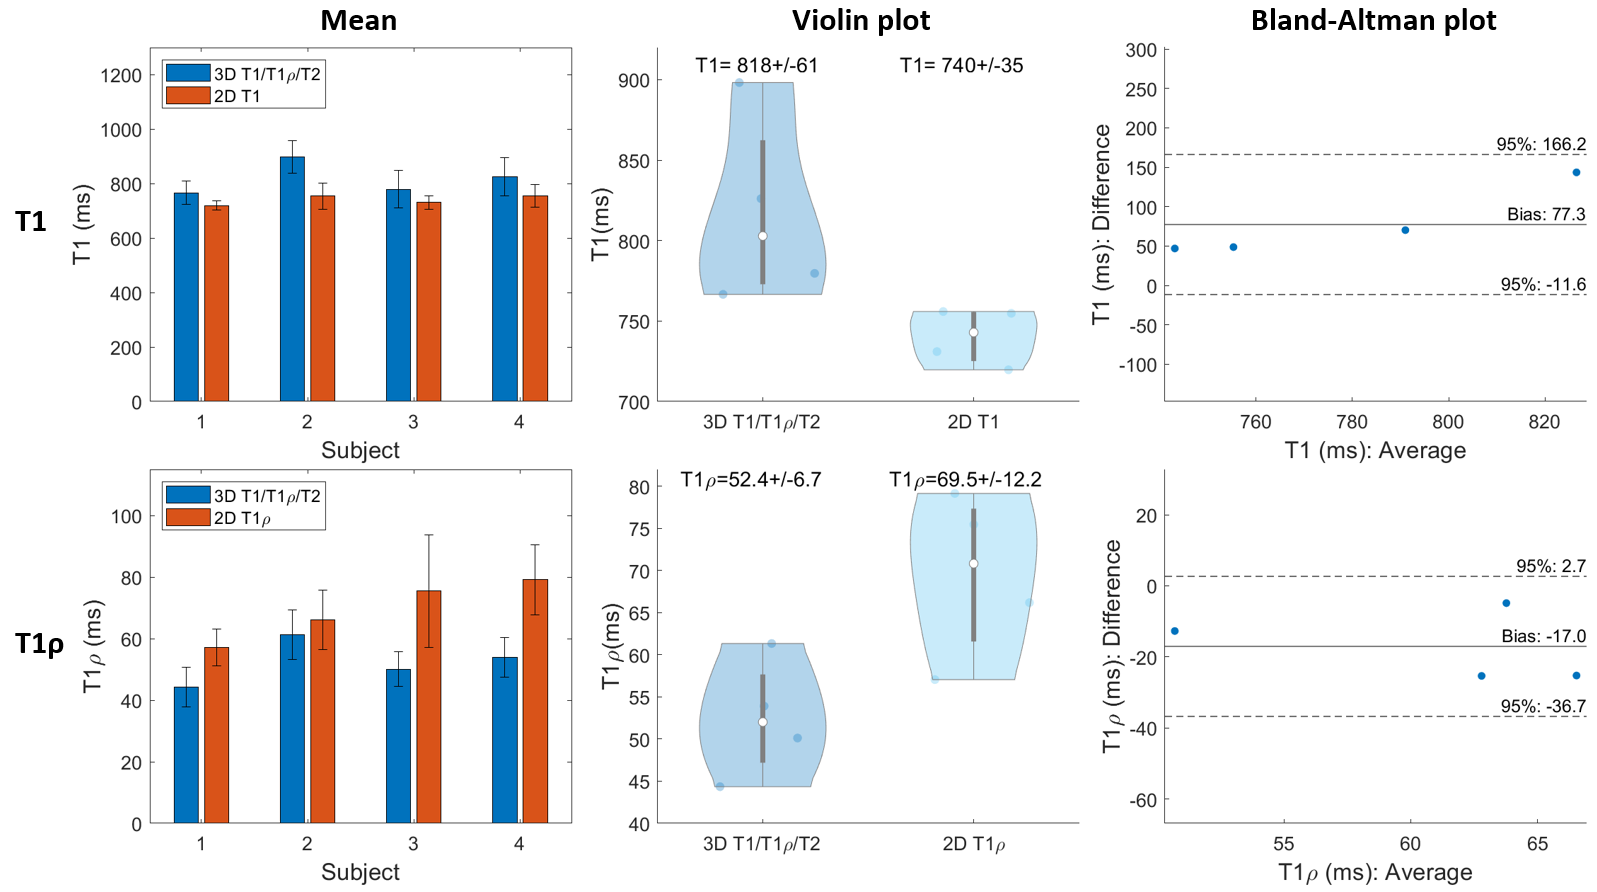
Phantom experiments show good agreement with 2D MOLLI and 2D T1ρ with good precision for both proposed T1 and T1ρ values for high HRs (Fig. 2). In-vivo experiments on 4 healthy subjects (HR = 58±4 bpm), with an acquisition window of ~150 ms at mid-diastole resulted in a total scan-time of ~12.3±1.6 mins. 3D water, fat, T1 and T1ρ maps estimated with the proposed approach for a representative subject are shown in Fig. 3 in both mid-coronal as well as in short-axis (SAx) views through the 3D reconstruction. Mid-ventricular SAx views of the proposed 3D T1/T1ρ maps, 2D MOLLI and 2D T1ρ for 2 subjects are shown in Fig. 4, showing good qualitative agreement with the references. Fig. 5 illustrates a comparison across all 4 healthy subjects. For T1, values (818±61 ms) with the proposed sequence are higher than 2D MOLLI (740±35 ms), and for T1ρ values (52.4±6.7 ms) with the proposed sequence are smaller than 2D T1ρ (69.5±12.2 ms).Conclusions
Preliminary 3D whole-heart joint T1/T1ρ mapping results demonstrate good agreement with 2D MOLLI and 2D T1ρ reference values in phantoms, and promising results in-vivo at 0.55T. Further work will include validation in phantoms using 2D spin-echo reference measurements, and acquisition of a larger cohort of healthy subjects and patients with suspected cardiovascular disease.Acknowledgements
This work was supported by the following grants: (1) EPSRC P/V044087/1; (2) BHF programme grant RG/20/1/34802, (3) Wellcome/EPSRC Centre for Medical Engineering (WT 203148/Z/16/Z), (4) Millennium Institute for Intelligent Healthcare Engineering ICN2021_004, (5) FONDECYT 1210637 and 1210638, (6) IMPACT, Center of Interventional Medicine for Precision and Advanced Cellular Therapy, ANID FB210024.References
1. Witschey W R T, Zsido G A, Koomalsingh K, et al. In vivo chronic myocardial infarction characterization by spin locked cardiovascular magnetic resonance. J Cardiovasc Magn Reson. 2012;14(1):37.
2. Liu X. et al. Native T1 mapping for characterization of acute and chronic myocardial infarction in swine: Comparison with contrast-enhanced MRI. J Magn Reson Imaging. 2018; 47(5):1406-1414
3. Crabb M G, Kunze K P, Velasco C et al. 3D joint T1/T1ρ mapping and water-fat imaging for contrast-agent free myocardial tissue characterisation Proc. ISMRM-ESMRMB & SMRT Annual Meeting, Program No.: 1004, 2022.
4. Simonetti O P, Ahmad R. Low-Field Cardiac Magnetic Resonance Imaging. Circulation: Cardiovascular Imaging 2017;10(6):e005446
5. Marques J P, Simonis F F J, Webb A G. Low-field MRI: An MR physics perspective. J Magn Reson Imaging 2019; 49(6):1528-1542.
6. Prieto C, Doneva M, Usman M, et al. Highly efficient respiratory motion compensated free-breathing coronary MRA using golden-step Cartesian acquisition. J Magn Reson Imaging. 2015;41(3):738–746.
7. Henningsson M, Koken P, Stehning C, et al. Whole-heart coronary MR angiography with 2D self-navigated image reconstruction. Magn Reson Med. 2012;67(2):437–445.
8. Cruz G, Atkinson D, Henningsson M, et al. Highly efficient nonrigid motion-corrected 3D whole-heart coronary vessel wall imaging. Magn Reson Med. 2017;77(5):1894-1908.
9. Bustin A, Cruz G, Jaubert O, et al. High-dimensionality undersampled patch-based reconstruction (HD-PROST) for accelerated multi-contrast MRI. Magn Reson Med. 2019;81(6):3705-3719.
10. Liu J, Peters D C, Drangova M. Method of B0 mapping with magnitude-based correction for bipolar two-point Dixon cardiac MRI. Magn Reson Med. 2016;78(5):1862-1869.
11. Weigel M. Extended phase graphs: Dephasing, RF pulses, and echoes – Pure and simple. J Magn Reson Imaging. 2015;41(2):266-295.
12. Messroghli D R, Radjenovic A, Kozerke A, et al. Modified Look-Locker Inversion Recovery (MOLLI) for High-Resolution T1 Mapping of the Heart. Magn Reson Med. 2004;52(1):141-146.
13. Qi H, Bustin A, Kuestner T, et al. Respiratory motion-compensated high-resolution 3D whole-heart T1ρ mapping. J Cardiovasc Magn Reson. 2020;22:12.
Figures