4005
Rapid multiple-breath-holds myocardial CINE T2-mapping with dynamic multiple trigger delay acquisition
Mana Kato1, Masami Yoneyama2, Michinobu Nagao3, Kazuo Kodaira1, Takumi Ogawa1, Yutaka Hamatani1, Isao Shiina1, Yasuhiro Goto1, and Shuji Sakai3
1Department of Radiological Services, Tokyo Women's Medical University, Tokyo, Japan, 2Philips Japan, Tokyo, Japan, 3Department of Diagnostic imaging & Nuclear Medicine, Tokyo Women's Medical University, Tokyo, Japan
1Department of Radiological Services, Tokyo Women's Medical University, Tokyo, Japan, 2Philips Japan, Tokyo, Japan, 3Department of Diagnostic imaging & Nuclear Medicine, Tokyo Women's Medical University, Tokyo, Japan
Synopsis
Keywords: Heart, Heart
T2-mapping is generally obtained only in diastole. However, because myocardial edema can affect both diastole and systole, acquisition of T2-mapping of different cardiac phases is desirable, but it prolongs examination time and increases patient stress. To overcome this limitation, we report a new T2-mapping technique using dynamic trigger delay which enables quantitative mapping at multiple cardiac phases in one scan. In this study, we demonstrate the feasibility of this approach in healthy volunteer examination.Introduction
Quantitative myocardial T2-mapping is key diagnostic and prognostic biomarkers in clinical cardiovascular magnetic resonance (CMR)[1-3]. T2 relaxation times increases with water content, and in the presence of high troponin levels suggests myocardial inflammation. T2-mapping is typically acquired using black-blood spin-echo based sequences such as TSE, multi-echo spin echo (MESE), multi-echo gradient spin echo (mGraSE). On the other hand, T2-mapping based on T2-prepared segmented balanced sequence has gained more attention recently as an alternative to SE-based T2-mapping. In either case, T2map is obtained during the diastolic phase only. However, it is known that myocardial edema thereafter myocardial infarction (MI) can affect both the diastolic and systolic function[4]. Therefore, acquisition of T2-mapping of different cardiac phases (diastolic and systolic, at least), would be clinically desired to accurately assess diffuse myocardial pathologies. In this study, we proposed a new T2prep-based T2-mapping technique that allows acquisition of various different cardiac phases, including diastolic and systolic, in one single scan. CINE T2-mapping, like myocardial CINE-imaging using dynamic trigger delay scan framework. The purpose of this study is to demonstrate the feasibility of CINE T2mapping with multiple breath-holding within a clinically feasible scan time.Methods
In this study, we attempted to obtain CINE T2-mapping in a 3-slices approach short-axis (SA) stack of the base, mid and apex covering the entire left ventricle, which is widely used to reduce acquisition time[4,5]. 3-slices approach was performed using 2D single-shot T2-prepared segmented balanced turbo field echo (2D-ssh-bTFE) sequence. Recently, a unique T1ρ mapping approach using interleaved spin-lock prepared steady-state free precession pulse sequence has been proposed to achieve single breath-hold T1ρ-Mapping of the heart[6], which employs different spin-lock pulses alternately before each TFE shots. We followed the same concept and replaced the spin-lock pulses by T2prep pulses. In addition, a combination of parallel imaging and compressed sensing technique (Compressed SENSE, C-SENSE) has recently been developed to accelerate the acquisition time without causing additional image artifacts[7,8]. We also applied C-SENSE to this T2-mapping sequence to further shorten the echo train length of single-shot bTFE, which leads to improve the robustness of motion thanks to short shot duration especially for T2mapping of non-systolic/diastolic timings. For generating the T2map, four images with different T2-preparation times (TE = 0, 27, 53 and 80ms) were acquired with interleaved acquisition at the respective heartbeats. The repetition time (TFE shot interval) was set to 2 heartbeats. To obtain different cardiac phase T2maps, Dynamic trigger delay scan framework (DynTD) has been applied in this study (Fig.1). DynTD is combined with the dynamic scan procedure with variable TD among different dynamic scans while maintain the scan parameters (including TR, TE, number of slices, etc.) of each scan exactly. TD is increasing with the number of dynamic scans and the TD increment (ms/dyn) can be determined arbitrarily. Consequently, DynTD can acquire several different time-phase images in one single scan. We set a starting TD as 100ms, the interval TD was set as TD increments to obtain multiple phase maps between systole and diastole. In this study, 6 cardiac phases were acquired with 100ms TD increments. Consequently, T2 maps with TD from 100ms to 600ms were obtained, it is sufficient duration to obtain the T2 maps from systole to diastole. To minimize motion-induced misalignment, the across T2prep-TE images were motion-compensated using fast elastic image registration (FEIR) [9] which can mitigate such variations of in-plane heart shape by registering the source images before creation of the parametric map[10]. The scan parameters were optimized and 6 healthy volunteers (5 males and 1 female; age range: 27~45) and one patient with hypertrophic cardiomyopathy (HCM) were scanned on a clinical 3.0T system (Ingenia, Philips Healthcare). T2 relaxation times were measured and assessed from the obtained T2-mapping using a 16-segment model[11]. Imaging-parameters; 2D-ssh-bTFE with DynTD (2D-CINE-T2-mapping): FOV=300×300mm, voxel-size=2.5×2.5×8.0mm, TR/TE=1.91/0.59ms, flip-angle=20, TFE-factor=48, TFE shot interval=2 heartbeats, C-SENSE factor=3, and acquisition time=14 to 18sec×9 times (depend on the heart rate).Results
Figure 2 shows representative source 2D-CINE-T2-mapping each time-phase image were acquired by DynTD. T2-mapping images of 2D-CINE-T2-mapping are shown in Figure 3. Figure 4 shows the comparison of T2maps of the base of short-axis slice between 2D mGraSE at diastole phase and 2D-CINE-T2-mapping at diastole and systole phases. The measured T2 relaxation times from all the volunteers were comparable to the literature findings[12]. Figure 5 shows clinical case images of HCM (LGE, black-blood-T2WI, native-T1-mapping and 2D-CINE-T2-mapping). In this case, 2D-CINE-T2-mapping could be scanned without artifacts.Discussion & Conclusion
We demonstrated the feasibility of CINE-T2-mapping to simultaneously acquire several different cardiac phases, including diastolic and systolic, in one single scan within clinically acceptable scan time. It could make simultaneous acquisition of diastolic and systolic T2 relaxation time more convenient and may provide more detailed diagnosis of the myocardial effects of myocardial edema. More systematic investigations are needed to study its clinical robustness and quantification precision in comparison to the conventional techniques.Acknowledgements
No acknowledgements found.References
1. Giri S, et al. T2 quantification for improved detection of myocardial edema. J Cardiovasc Magn Reson. 2009 Dec 30;11:56. 2. Sprinkart AM, et al. Gradient Spin Echo (GraSE) imaging for fast myocardial T2 mapping. J Cardiovasc Magn Reson 2015;17:12. 3. Fernández-Jiménez R, et al. Fast T2 gradient-spin-echo (T2-GraSE) mapping for myocardial edema quantification: first in vivo validation in a porcine model of ischemia/reperfusion. J Cardiovasc Magn Reson 2015;17:92. 4. Constantin-Cristian Topriceanu. et al. T2 and T2* mapping and weighted imaging in cardiac MRI. Magn Reson Imaging 2022 Nov 93:15-32 5. Stephen Hamshre, et al. Cardiovascular magnetic resonance imaging of myocardial oedema following acute myocardial infarction: Is whole heart coverage necessary? Journal of Cardiovascular Magnetic Resonance (2016) 18:7 DOI 10.1186/s12968-016-0226-5 6. van Oorschot JW, et al. Single Breath-Hold T1ρ-Mapping of the Heart for Endogenous Assessment of Myocardial Fibrosis. Invest Radiol. 2016 Aug;51(8):505-12. 7. Geerts-Ossevoort L, et al. Compressed SENSE Speed done right. Every time. The Netherlands: Philips Healthcare; 2018 Jan. Report No: 4522 99131821. https://www.philips.de/content/dam/b2bhc/de/resourcecatalog/landingpages/ingeniaelition/White_Paper_Compressed_SENSE-opt.pdf 8. Sartoretti E, et al. Reduction of procedure times in routine clinical practice with Compressed SENSE magnetic resonance imaging technique. PLoS One. 2019 Apr 12;14(4):e0214887. doi: 10.1371/journal.pone.0214887. eCollection 2019. 9. Zhang S, et al. Cardiac magnetic resonance T1 and extracellular volume mapping with motion correction and co-registration based on fast elastic image registration. MAGMA. 2018 Feb;31(1):115-129. 10. Takumi ogawa, et al. Minimizing motion artifacts in myocardial quantitative mapping by combined use of motion-sensitive CINE imaging and FEIR. Proc. ISMRM:2021. 11. Manuel D Cerqueira, et al. Standardized myocardial segmentation and nomenclature for tomographic imaging of the heart. A statement for healthcare professionals from the Cardiac Imaging Committee of the Council on Clinical Cardiology of the American Heart Association. Circulation. 2002 Jan 29;105(4):539-42. doi: 10.1161/hc0402.102975. 12. Florian von Knobelsdorff-Brenkenhoff, et al. Myocardial T1 and T2 mapping at 3 T: reference values, influencing factors and implications. J Cardiovasc Magn Reson 2013;15(1):53.Figures
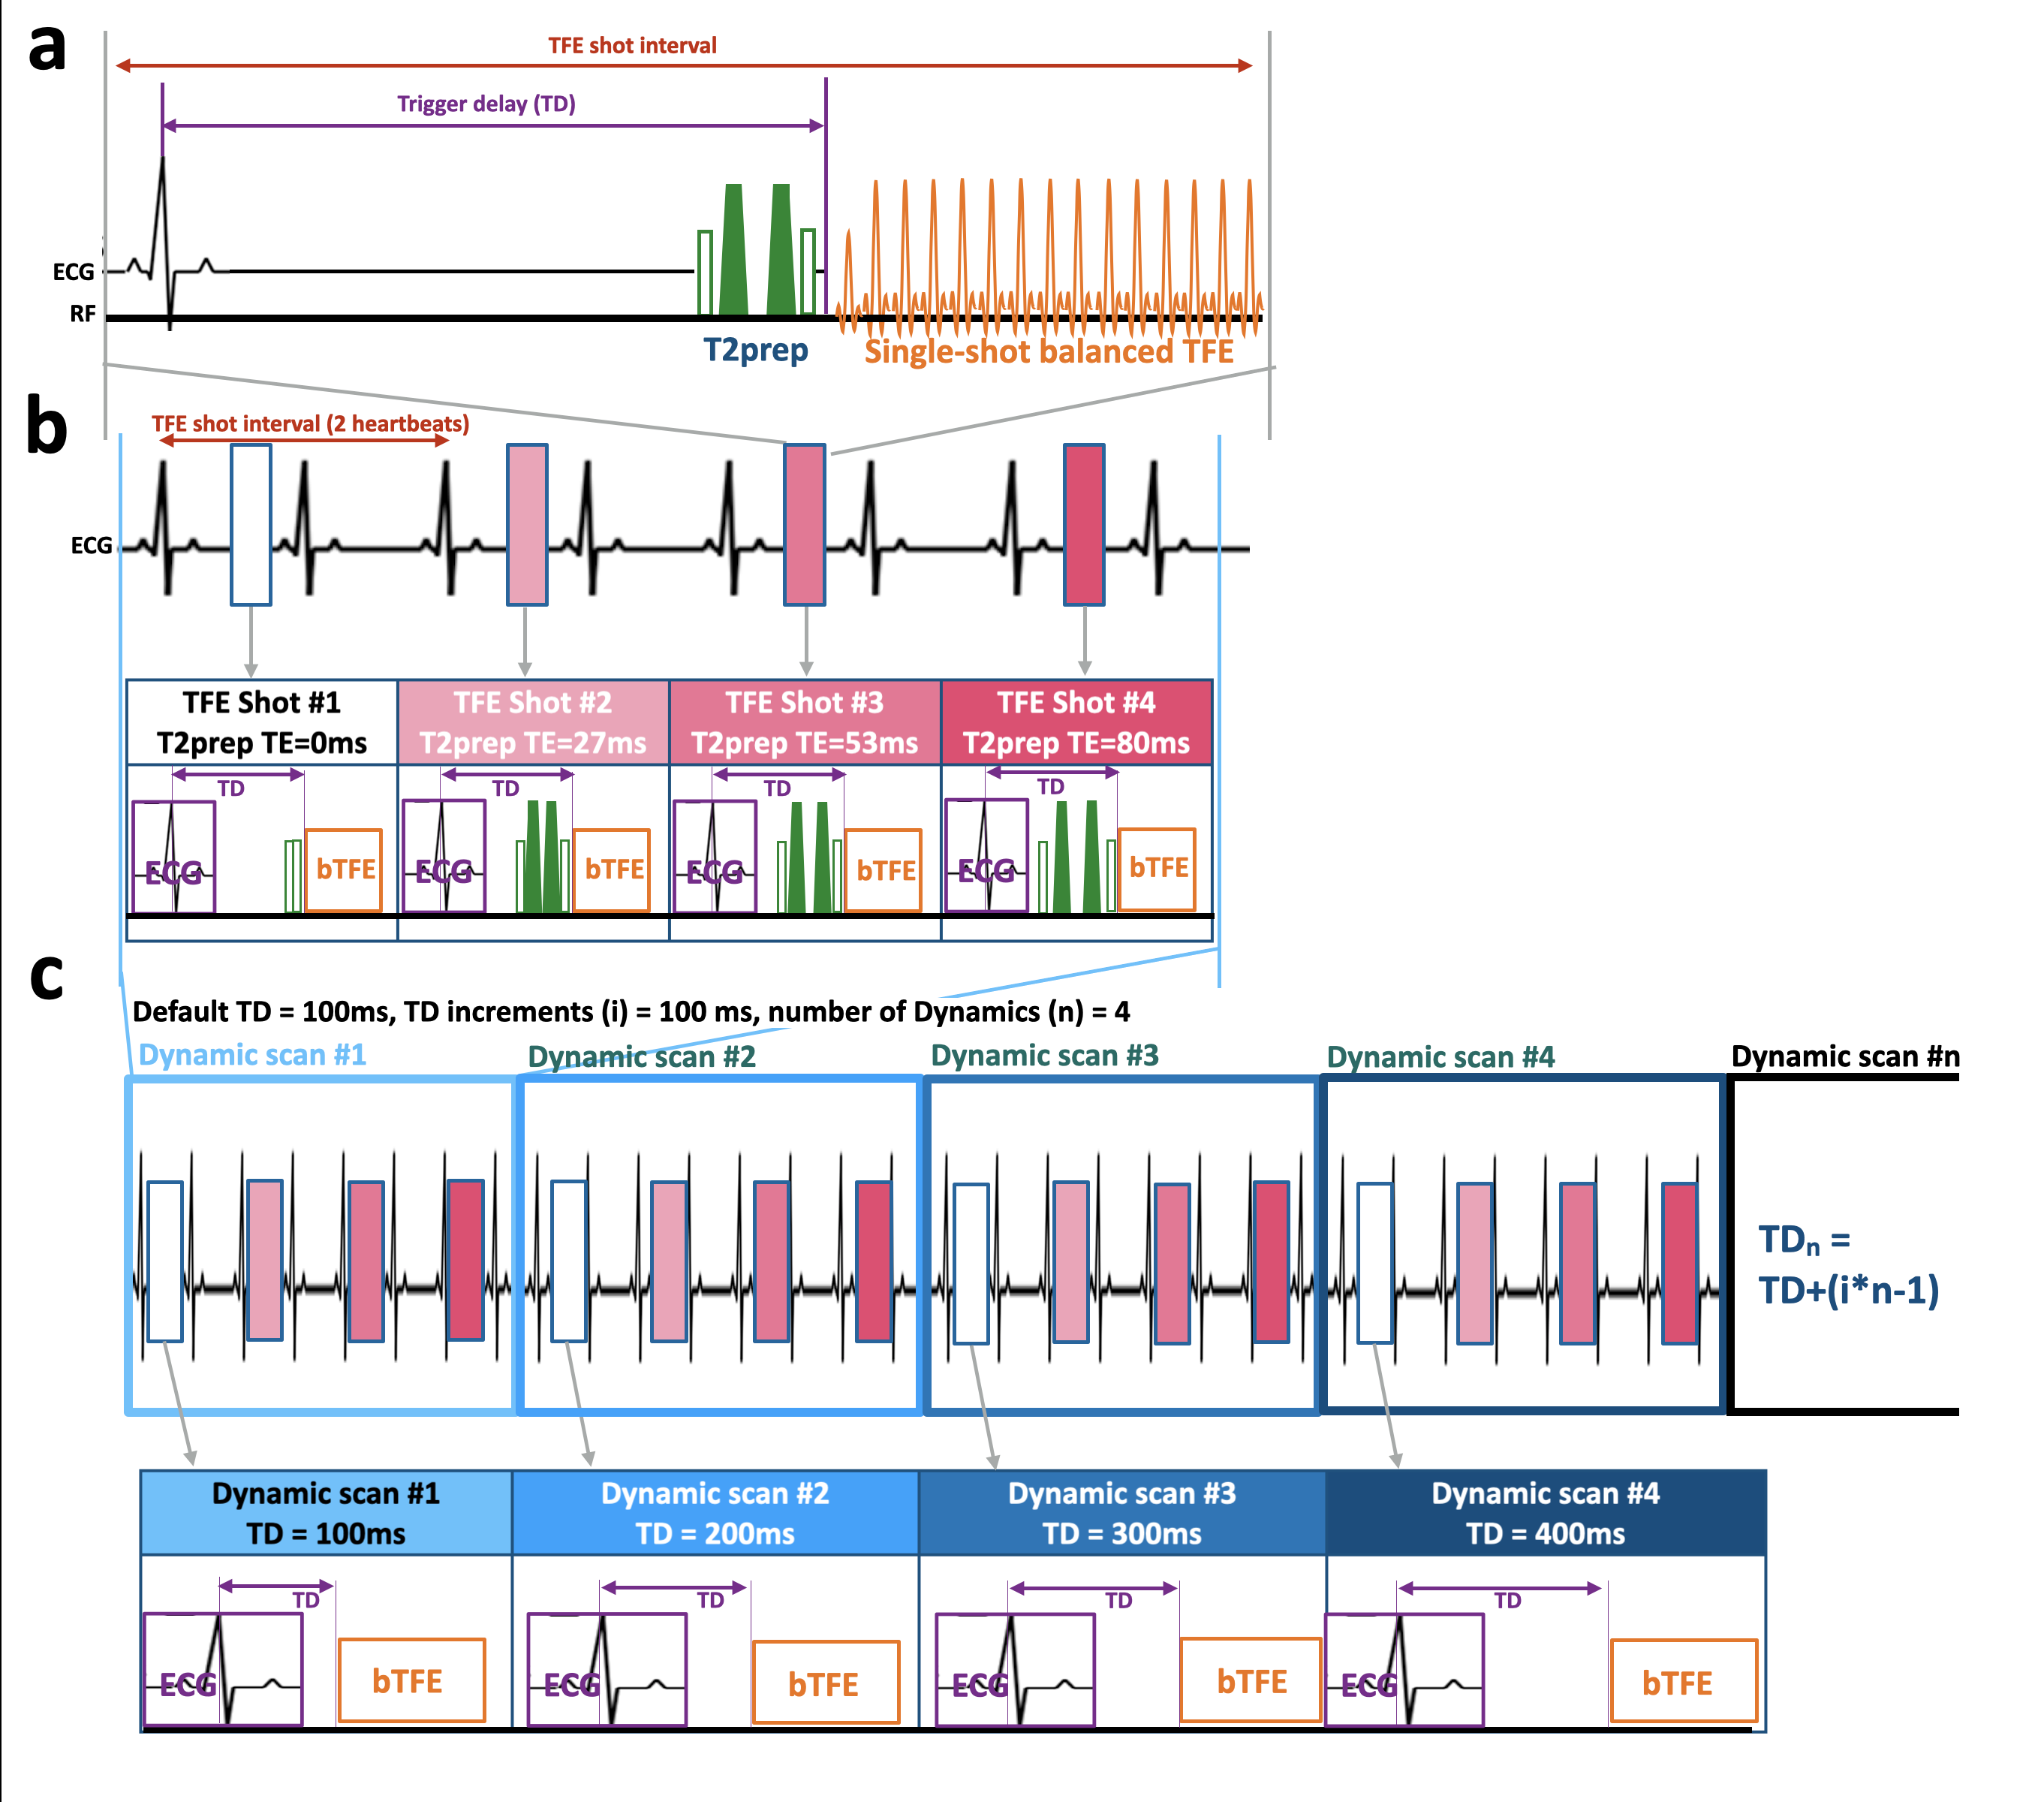
Figure 1: Scheme of the sequence for myocardial CINE-T2-mapping.
T2-mapping was performed using T2-prepared segmented
balanced turbo field echo or gradient echo sequence(a). The numbers
indicate 4 images with different T2-preparation times(b).
Each T2-weighted image was simultaneously obtained systole
and diastole using dynamic trigger
delay combines with dynamic scan procedure.
Dynamic scan were obtained 6 cardiac phases that can be
determined arbitrarily (TD increments: 100ms/dyn)(c).
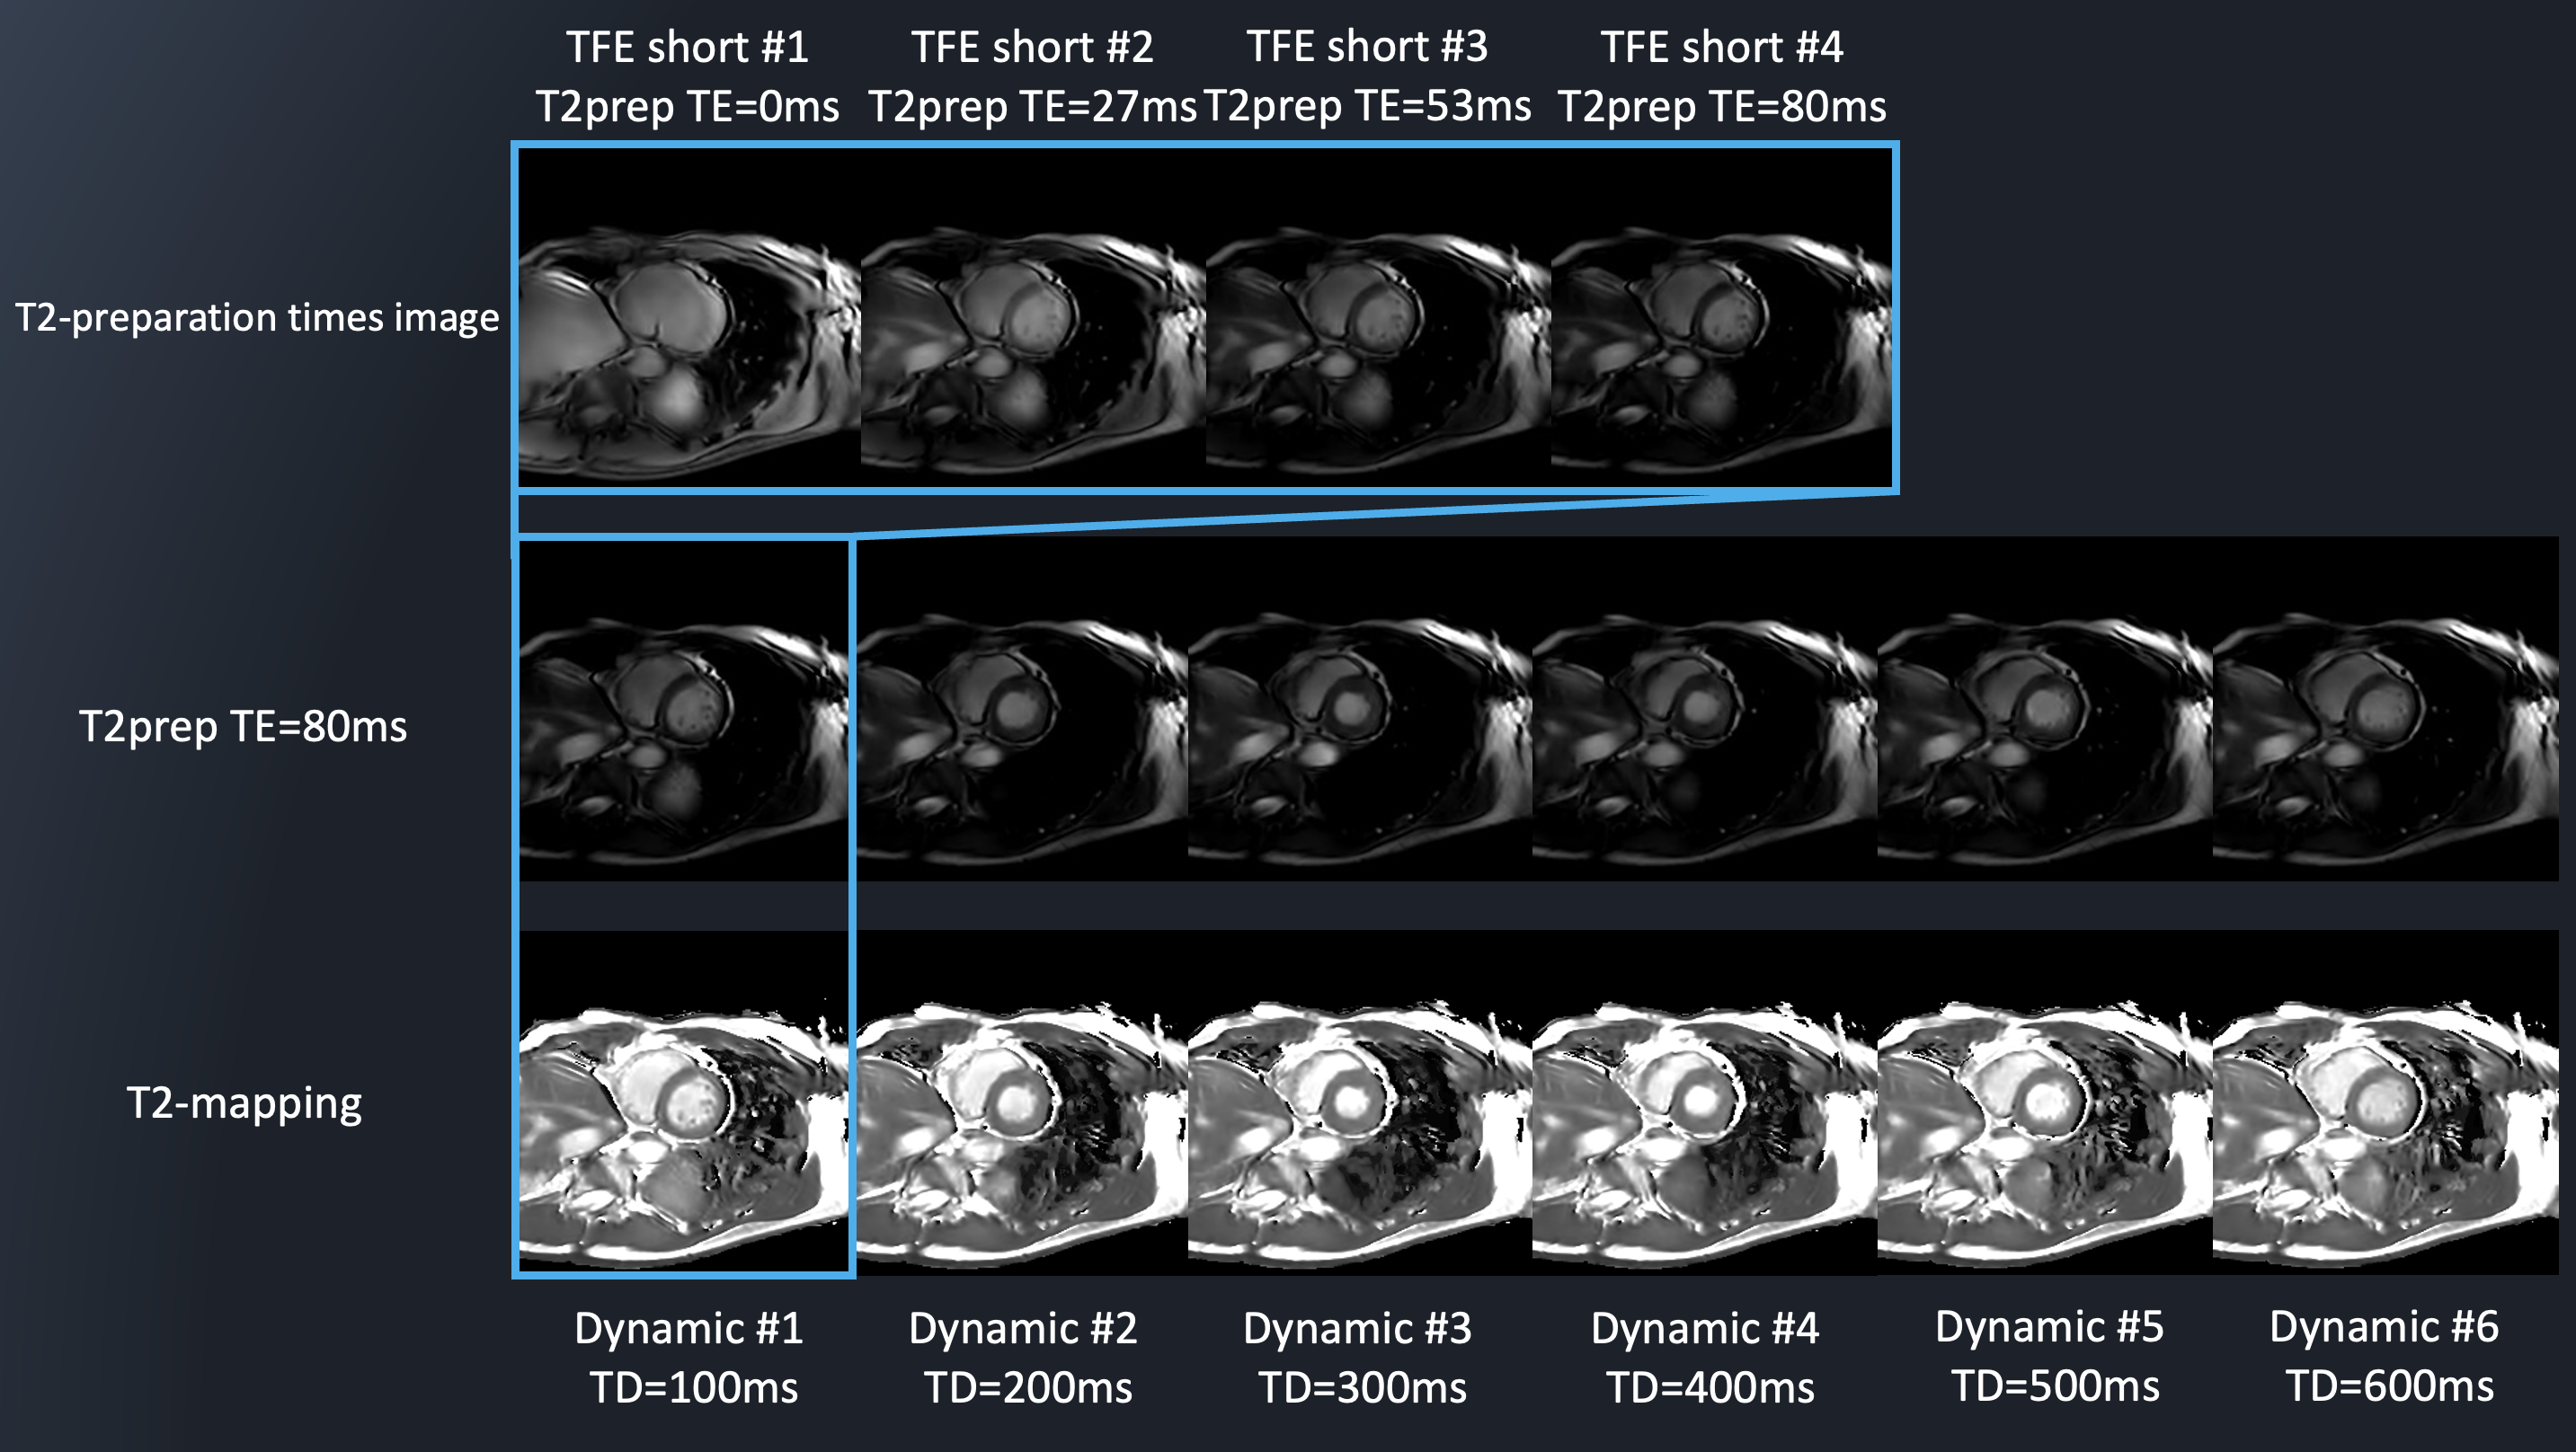
Figure 2: Representative
source images of different T2-preparation times which creates T2-mapping.
T2-preparation time images were acquired each time-phase by
DynTD and generated 2D-CINE-T2-mapping.
Figure 3: Representative source images of myocardial 2D-CINE-T2-mapping in
3-slice approach.
6
cardiac phases (TD increment: 100 ms) were acquired simultaneously in each of
the base (a), mid (b), and apex (c) slices.
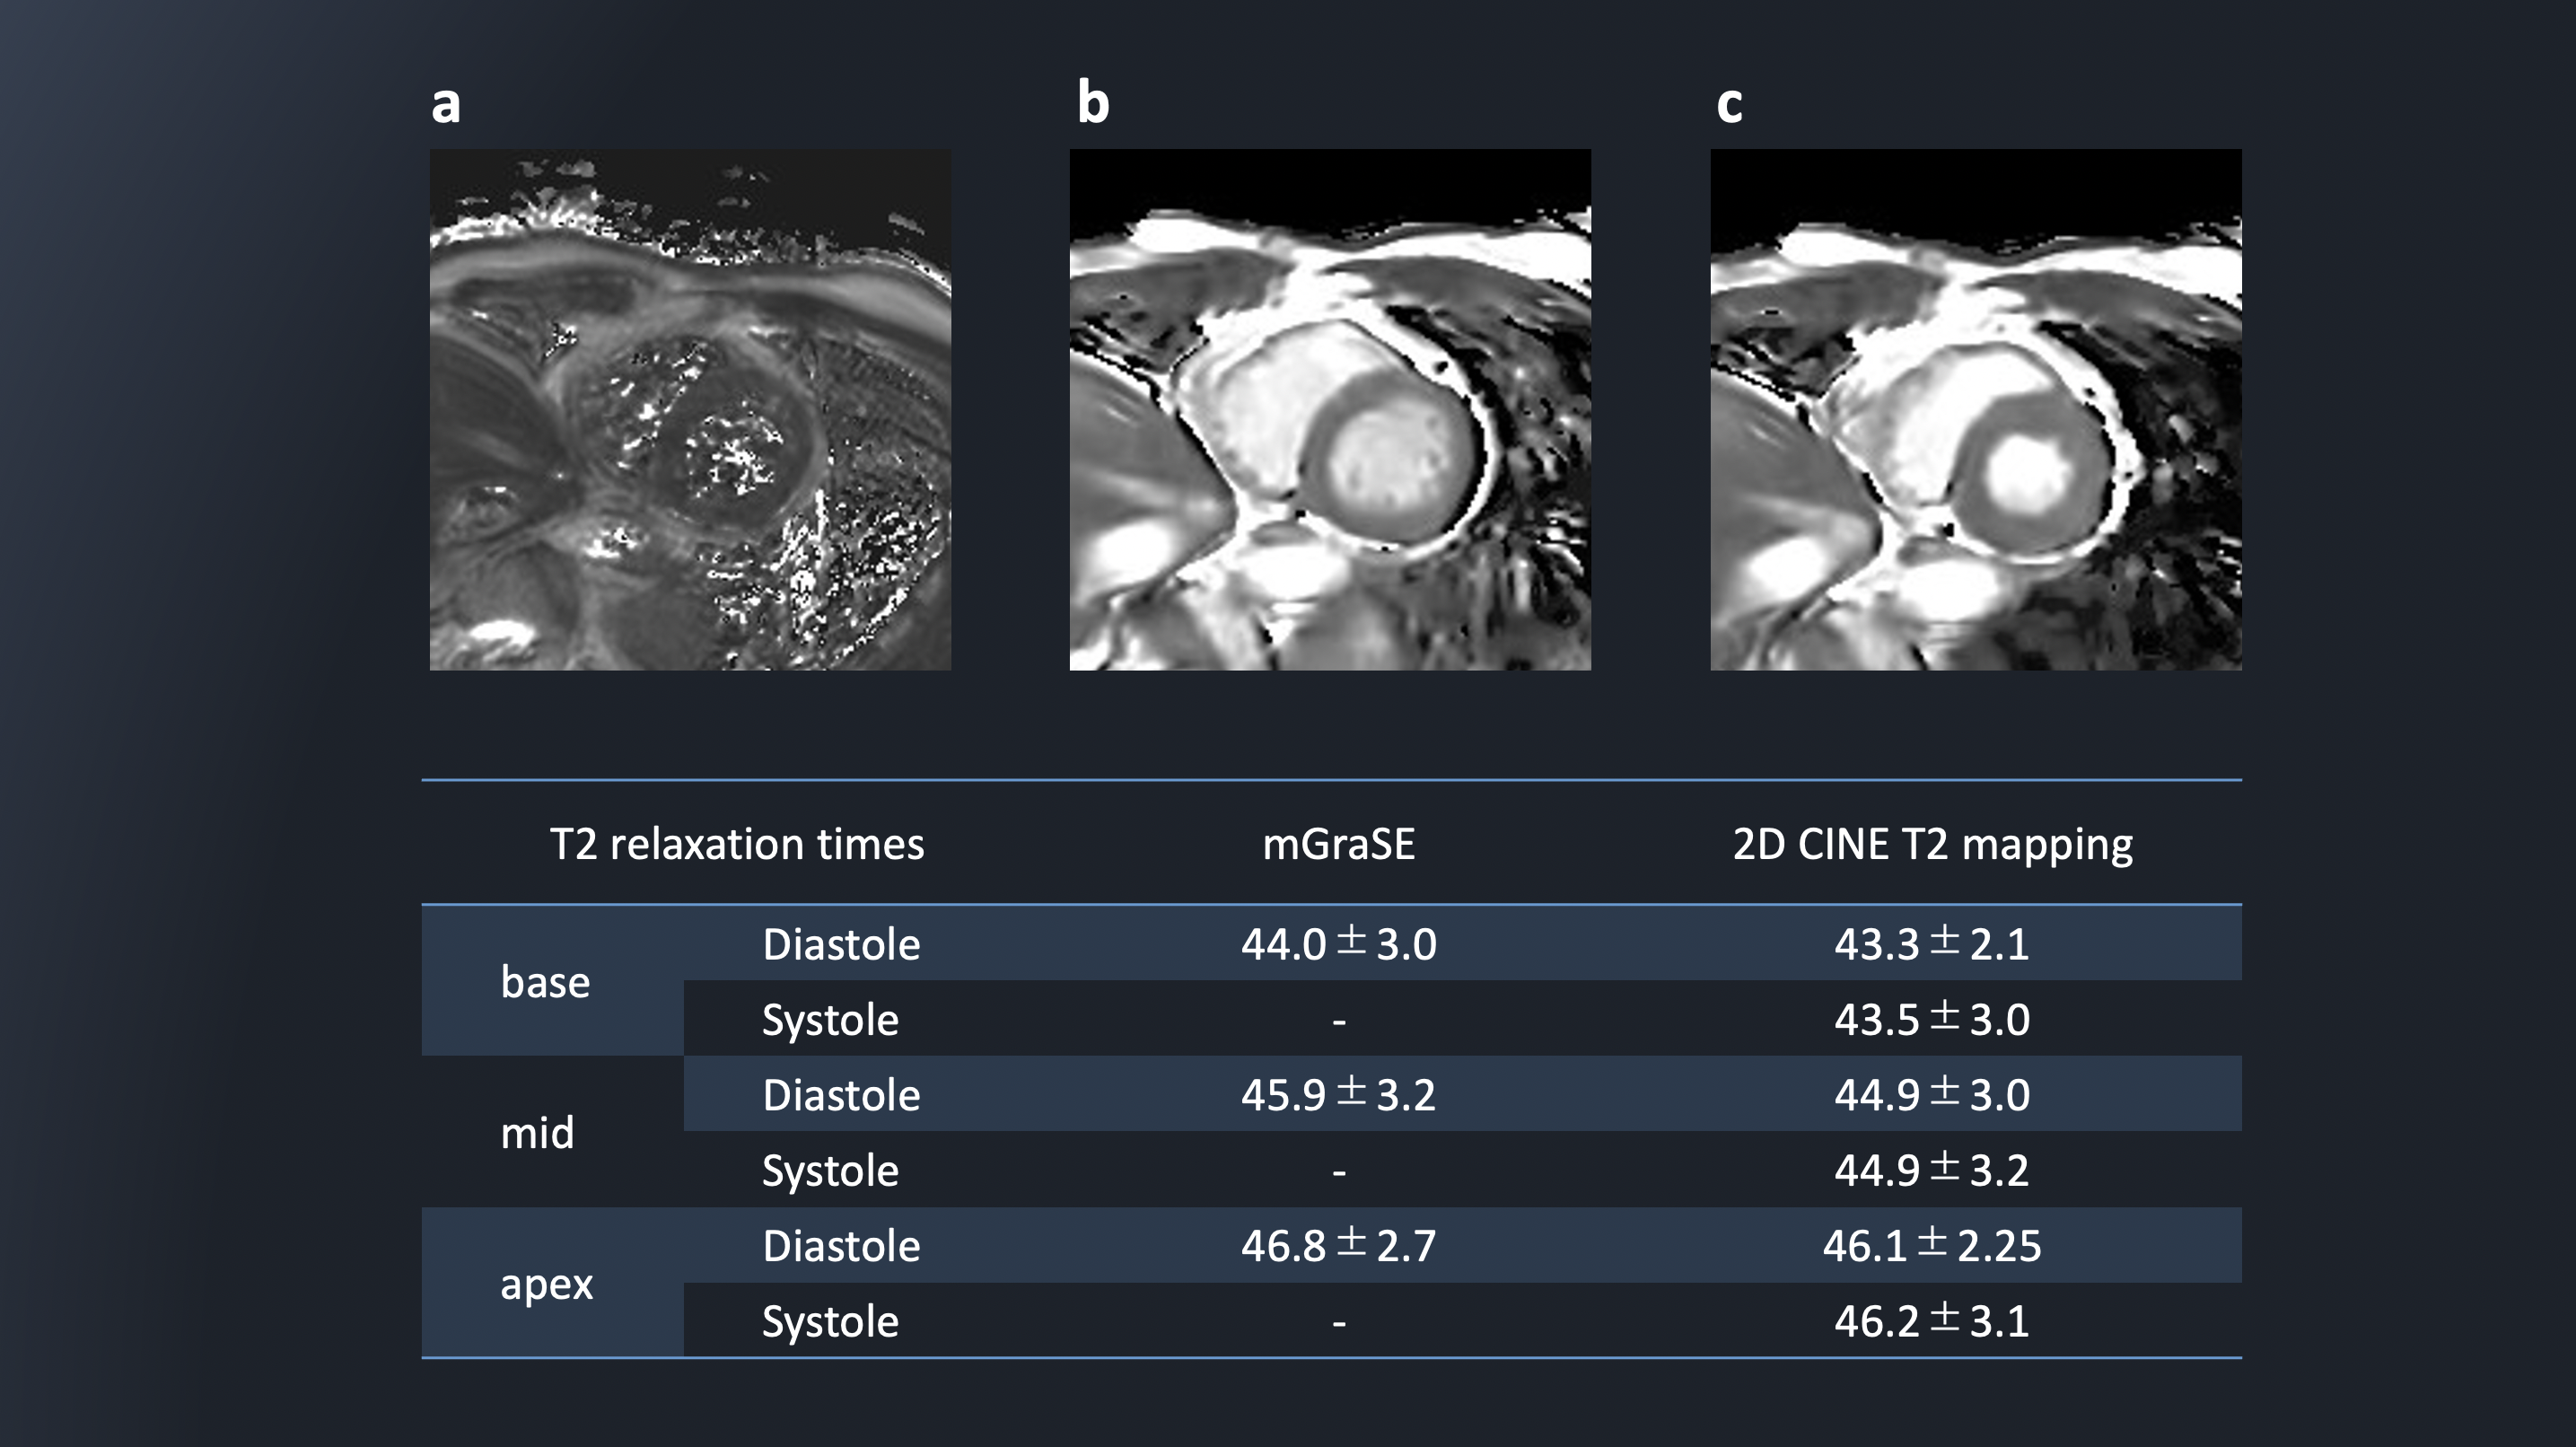
Figure 4:
Comparison
of short-axis (SA) myocardial T2 map with mGraSE at diastole (a) and
2D-CINE-T2-mapping at diastole (b) and systole (c). The table shows the average
T2 relaxation time for all volunteers in each sequence.
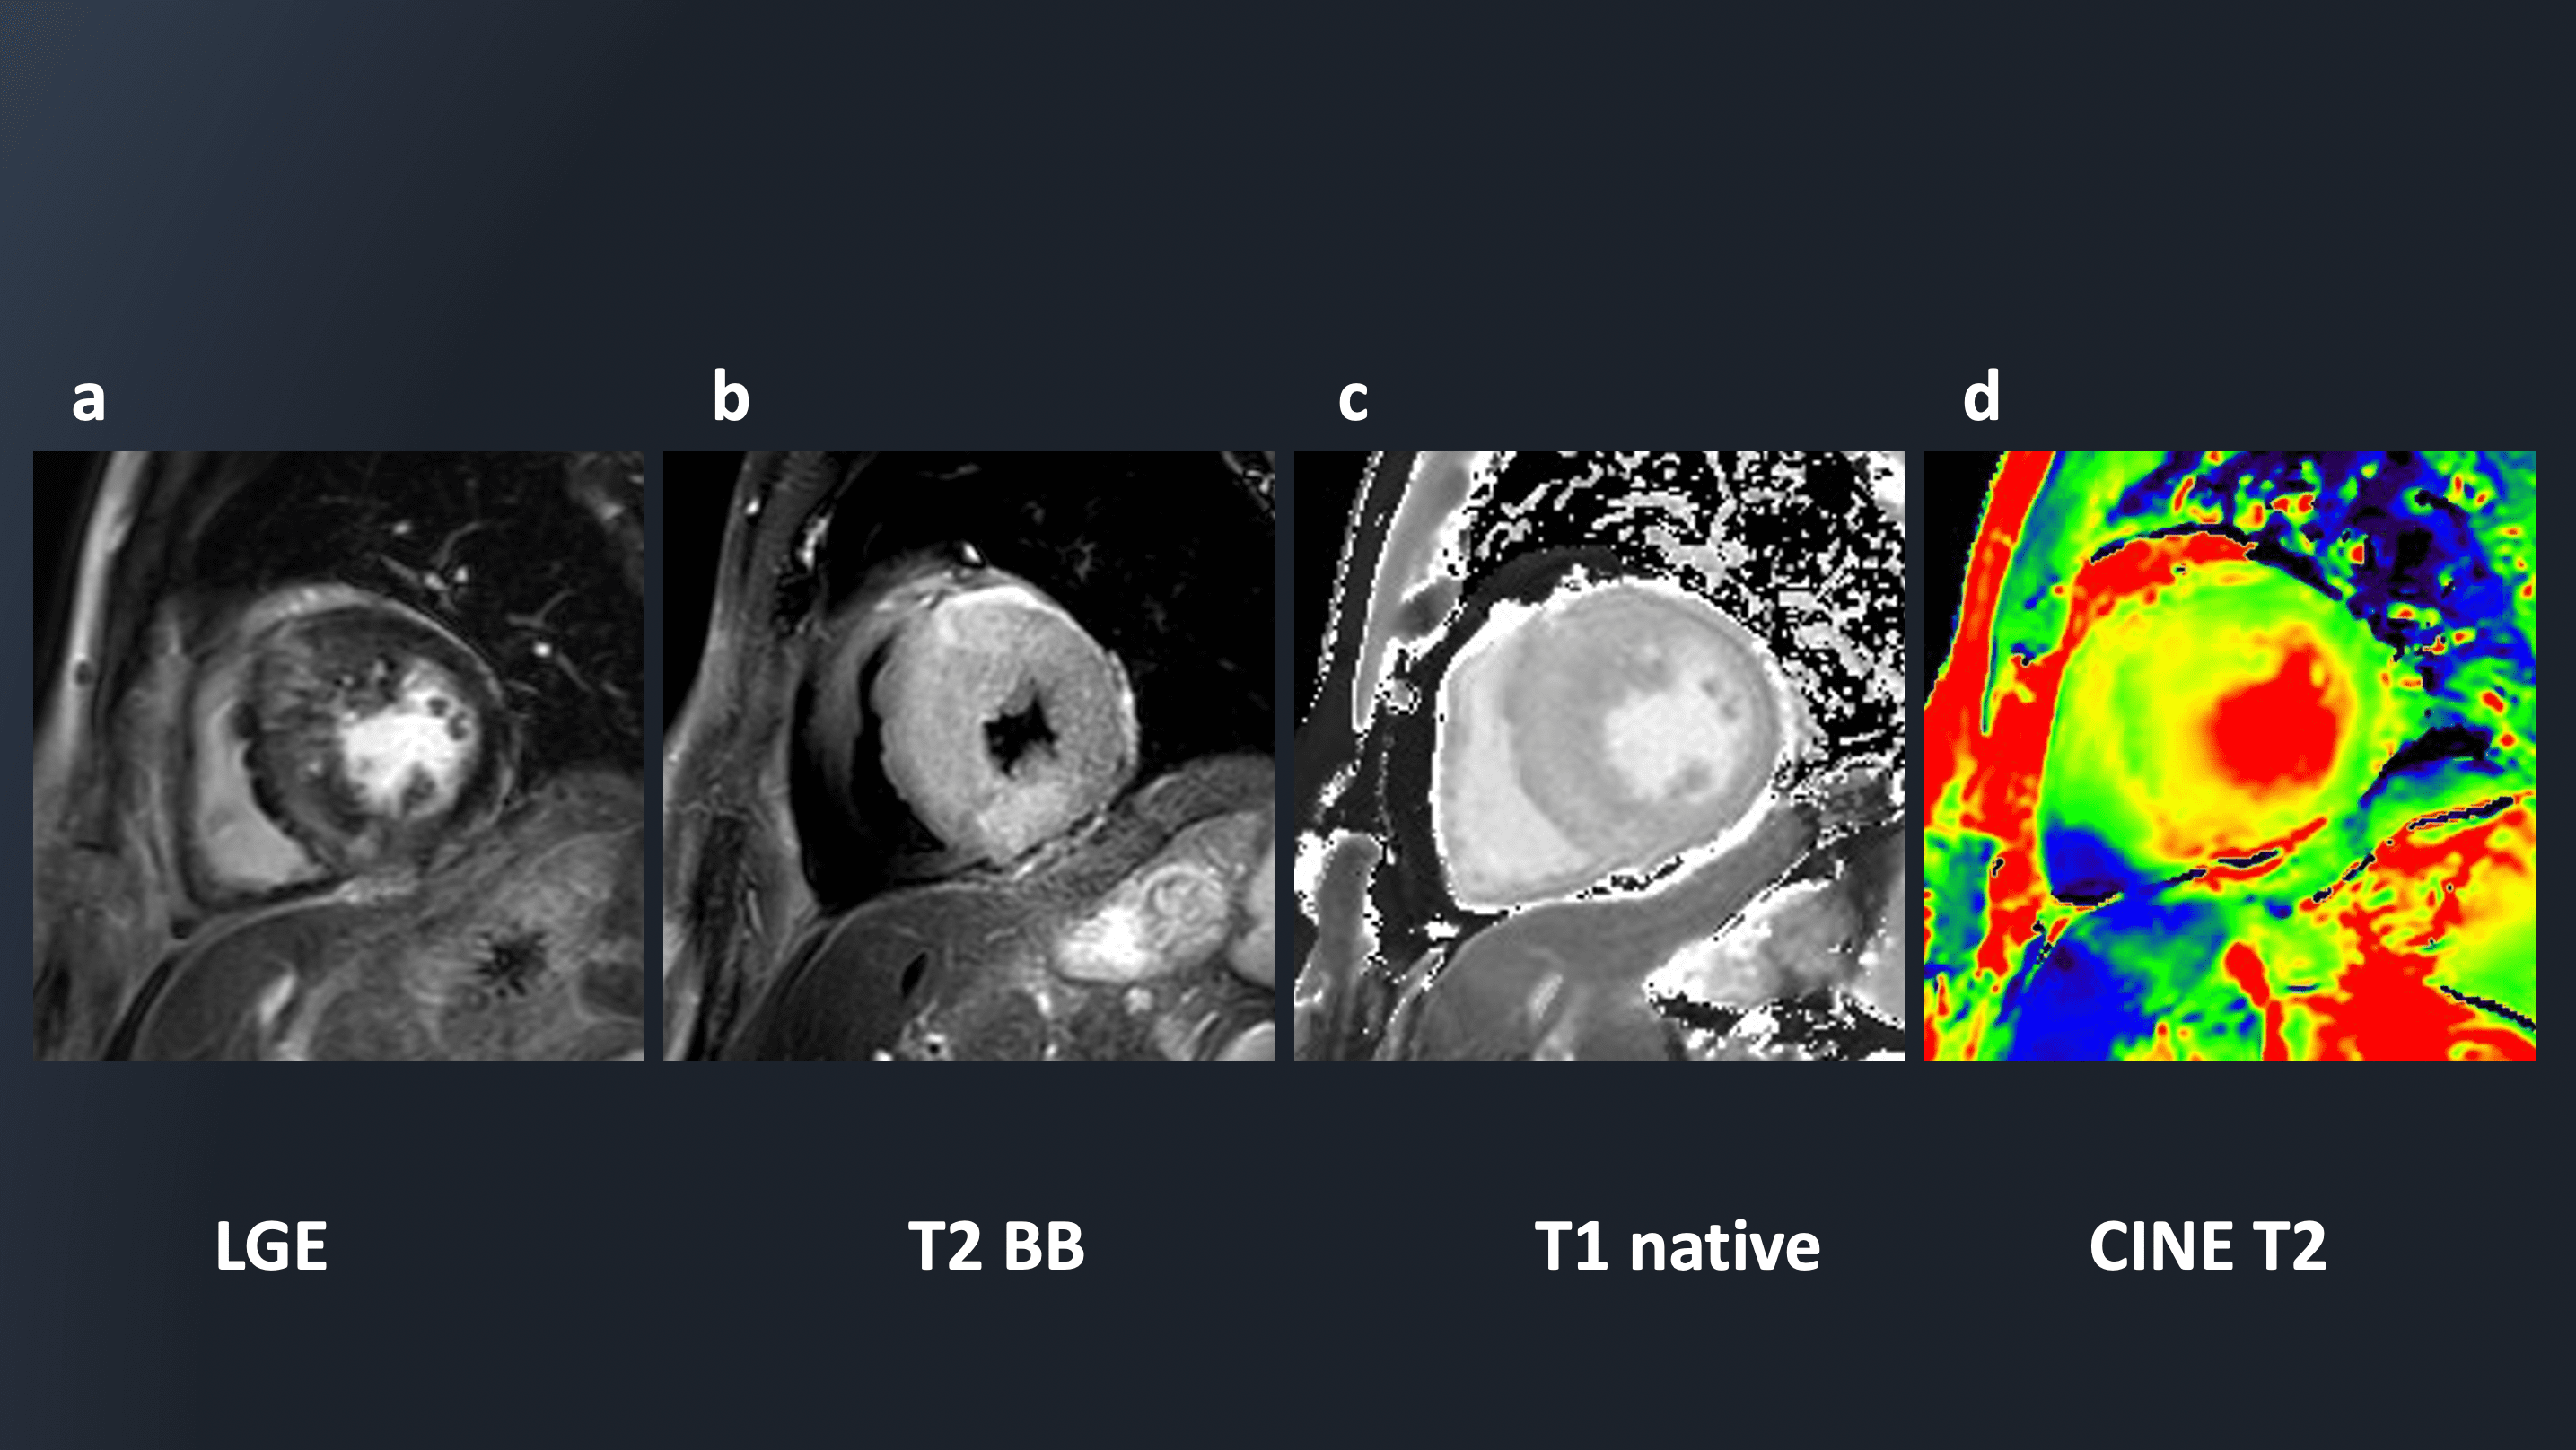
Figure
5: The LGE
(a), black-blood-T2WI (b), native-T1-mapping (c) and 2D-CINE-T2-mapping (d)
clinical case images of HCM.
DOI: https://doi.org/10.58530/2023/4005