4002
Accelerated 3D free-breathing cardiac T2 mapping with tiny golden-angle hybrid trajectory and tyGRASP1Center for Biomedical Imaging, University of Science and Technology of China, Hefei, China, 2Wellcome Centre for Integrative Neuroimaging, FMRIB Division, Nuffield Department of Clinical Neurosciences, University of Oxford, Oxford, United Kingdom, 3GE Healthcare, Shanghai, China
Synopsis
Keywords: Myocardium, Heart
Cardiac diseases are characterized by complex 3D pathological structures, 3D cardiac T2 mapping can be used as a promising tool to describe different pathologies. However, 3D T2 mapping requires a long acquisition time, which makes scanning more sensitive to motion, especially for high spatial resolution imaging. In our study, we aim to develop an accelerated and robust 3D cardiac T2 mapping technique by combining bSSFP-based hybrid radial-cartesian sampling with tiny Golden angle RAdial Sparse Parallel (tyGRASP) MRI at 3 T. The results showed that our method can generate precise T2 values with an average scan time of 6.1±1.0 min.Introduction
Myocardial edema, associated with increased free water in tissue (1), can be easily detected by MRI. T2-hyperintensities are closely related to a variety of pathological conditions, such as myocardial infarction (2), inflammatory cardiomyopathy (3), acute ischemia (4), and heart transplant rejection (5). Over the last decades, cardiac T2-weighted (T2W) imaging (6) has commonly been regarded as the gold standard of edema detection. However, artifacts arising from through-plane motion, slow-moving blood, and coil bias (7) hinder its widespread application in the clinical scenario. Recently, quantitative cardiac T2 mapping (8,9) has been proven to be a promising alternative method. Compared with 2D T2 mapping, 3D imaging can provide a high spatial resolution and a more comprehensive depiction of the myocardial property (10), and therefore is more desirable. However, 3D T2 mapping requires long scan times, potentially increasing the risk of motion artifacts and reducing image quality. Hence, this study aims to develop robust 3D cardiac T2 mapping at 3 T to accelerate scanning and improve the precision of T2 quantification. We combined hybrid radial-cartesian sampling with tiny Golden-Angle radial sparse parallel (tyGRASP) MRI (11) and achieved good image quality with a higher SNR at 5x acceleration when compared with the conventional method (12).Methods
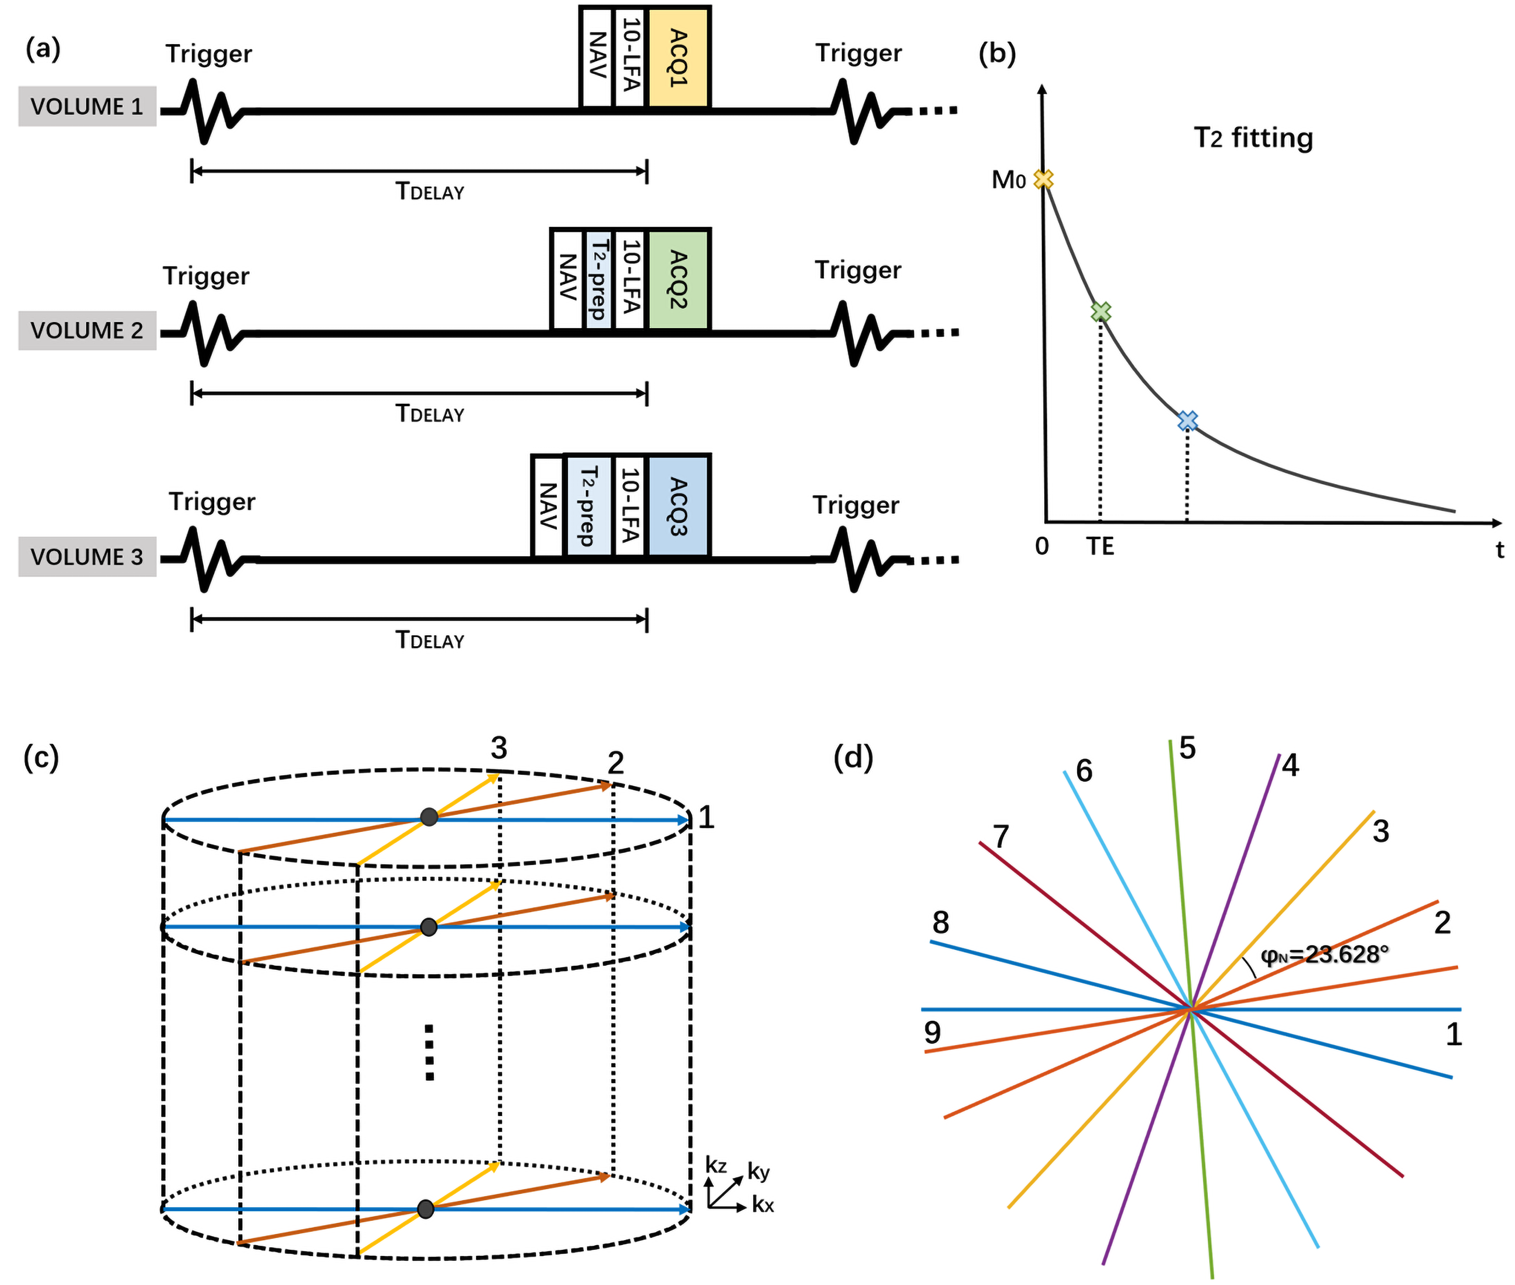
Figure 1a shows the diagram of the proposed sequence where the T2 preparation module (T2prep) has been used to achieve different T2 contrasts. Three volumes with different T2 contrast (corresponding to TET2prep = 0, 24ms, 48ms) were acquired, and T2 mapping was estimated by an empirical fitting equation (10,13):$$M_{xy}(TE_{T2prep})=M_{0}e^{\frac{-TE_{T2prep}}{T2}}+\eta{M_{0}}$$
where M0 refers to the longitudinal magnetization at TET2prep = 0, Mxy is the magnetization at a given TET2prep and η is an empirical offset that accounts for T1 relaxation. Segmented k-space lines (Figure 1b) are required, in that all lines along the kz direction (32 lines) were obtained within each accepted cardiac period and then rotated by a tiny golden angle (i.e., 23.628°) in the kx-ky plane to the next encoding step (full sampling: 201 spokes; undersampling: 40 spokes). In our study, seven healthy subjects (11 males, age 23±2.5 years) with no history of cardiovascular disease were recruited, and all experiments were performed on a GE Discovery MR750 (GE Healthcare, USA) 3T MRI scanner using an 8-channel torso coil.
The tiny golden angle hybrid trajectory inherently satisfies the incoherent condition required by the compressed sensing (CS) technique (14). Based on this property, we can easily incorporate the robust tyGRASP:
$$\arg\min_{\theta}||{F}\cdot{S}\cdot{x}-d||_2^2+\lambda{||{T}\cdot{x}||_{1}}$$
where F is the NUFFT operator defined on the radial pattern, T is the total-variation (TV) operator, and S contains the coil sensitivity maps for all coils. λ is the regularization weight that controls the tradeoff between the l2-norm (enforce data consistency between k-space sampling data and the reconstructed image) and l1-norm (enforce transform sparsity). In our experiment, the bSSFP-based tiny golden angle hybrid trajectory is compared with the GRE-based uniform angle hybrid trajectory, and the parameters include: TR/TE = 3.5 ms/1.5 ms; flip angle = 45° (GRE-based: 15°); FOV = 22-26 cm; slice thickness = 3 mm; voxel size = 1.7 * 1.7 * 3 mm3; acquisition window = 113ms; receive bandwidth = 976 Hz/pixel.
Results
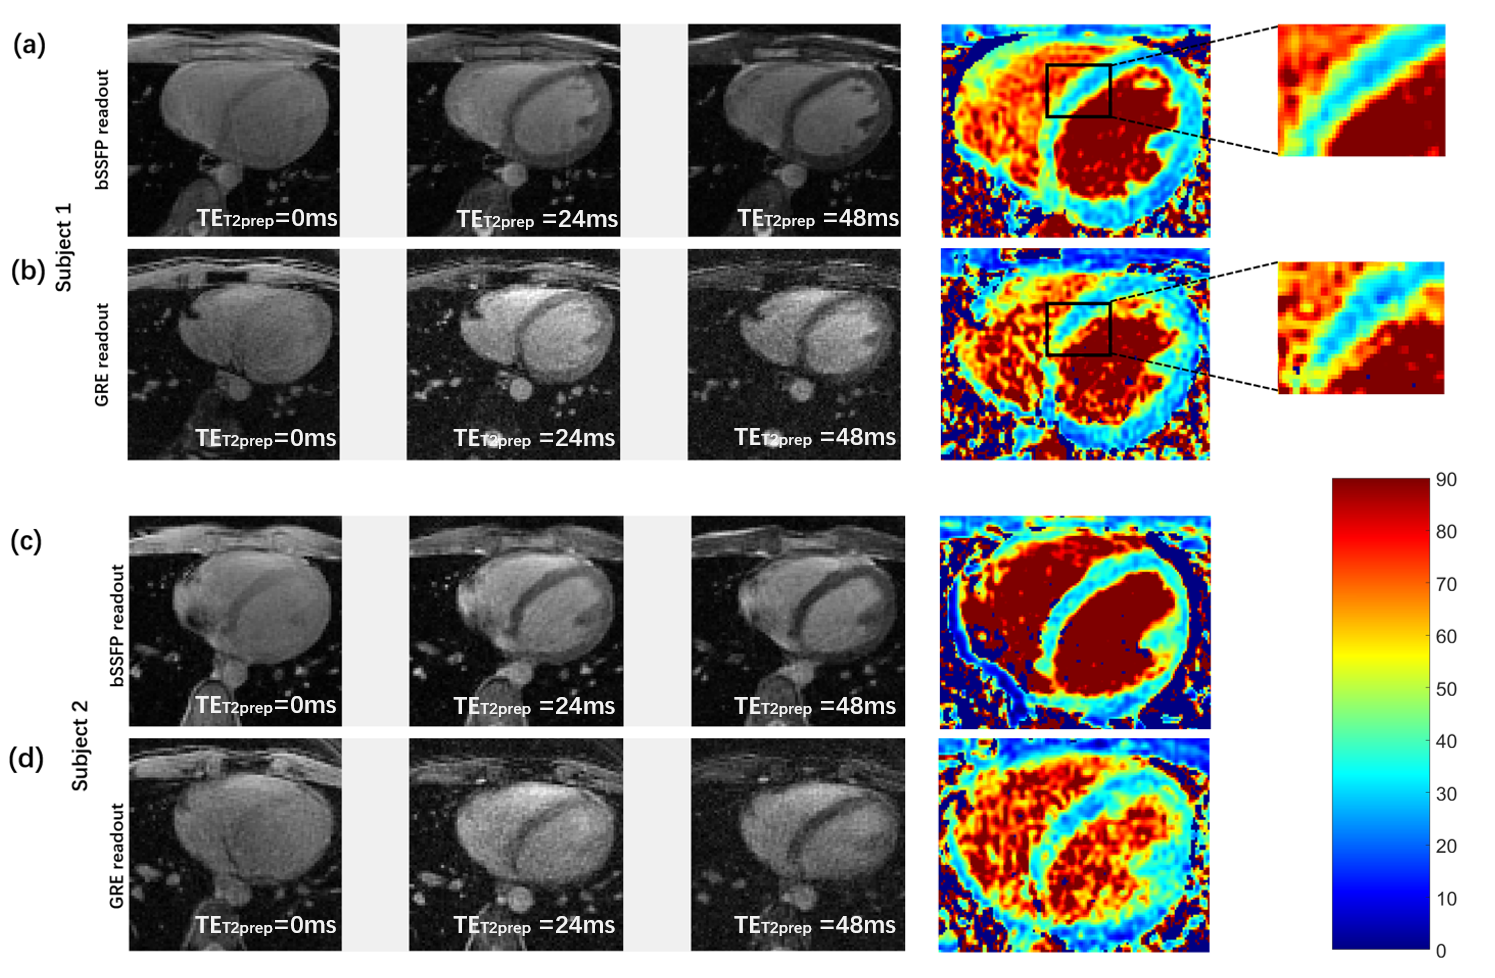
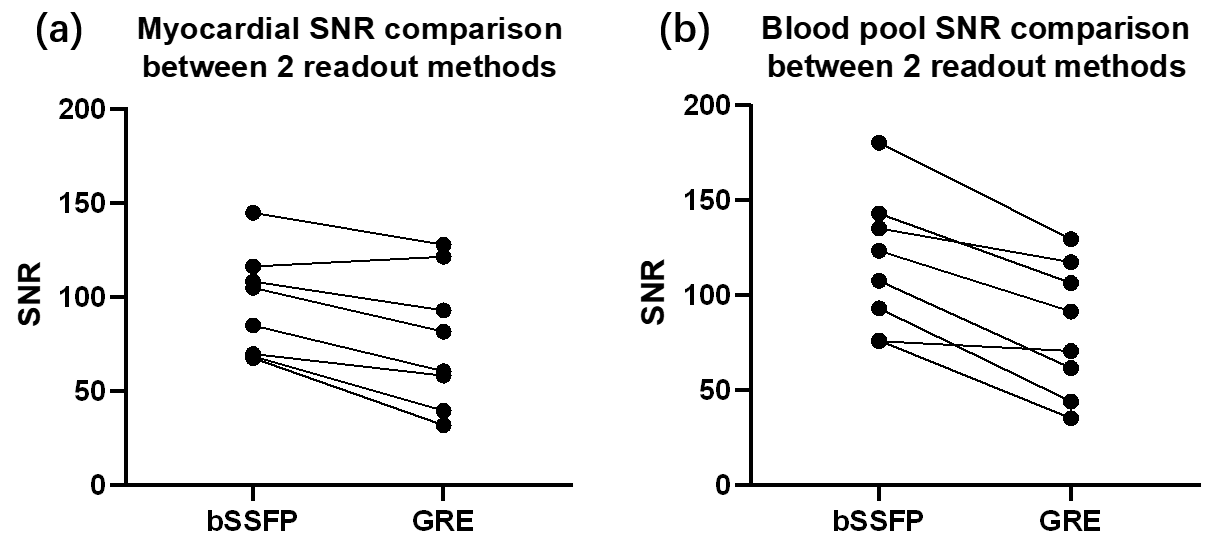
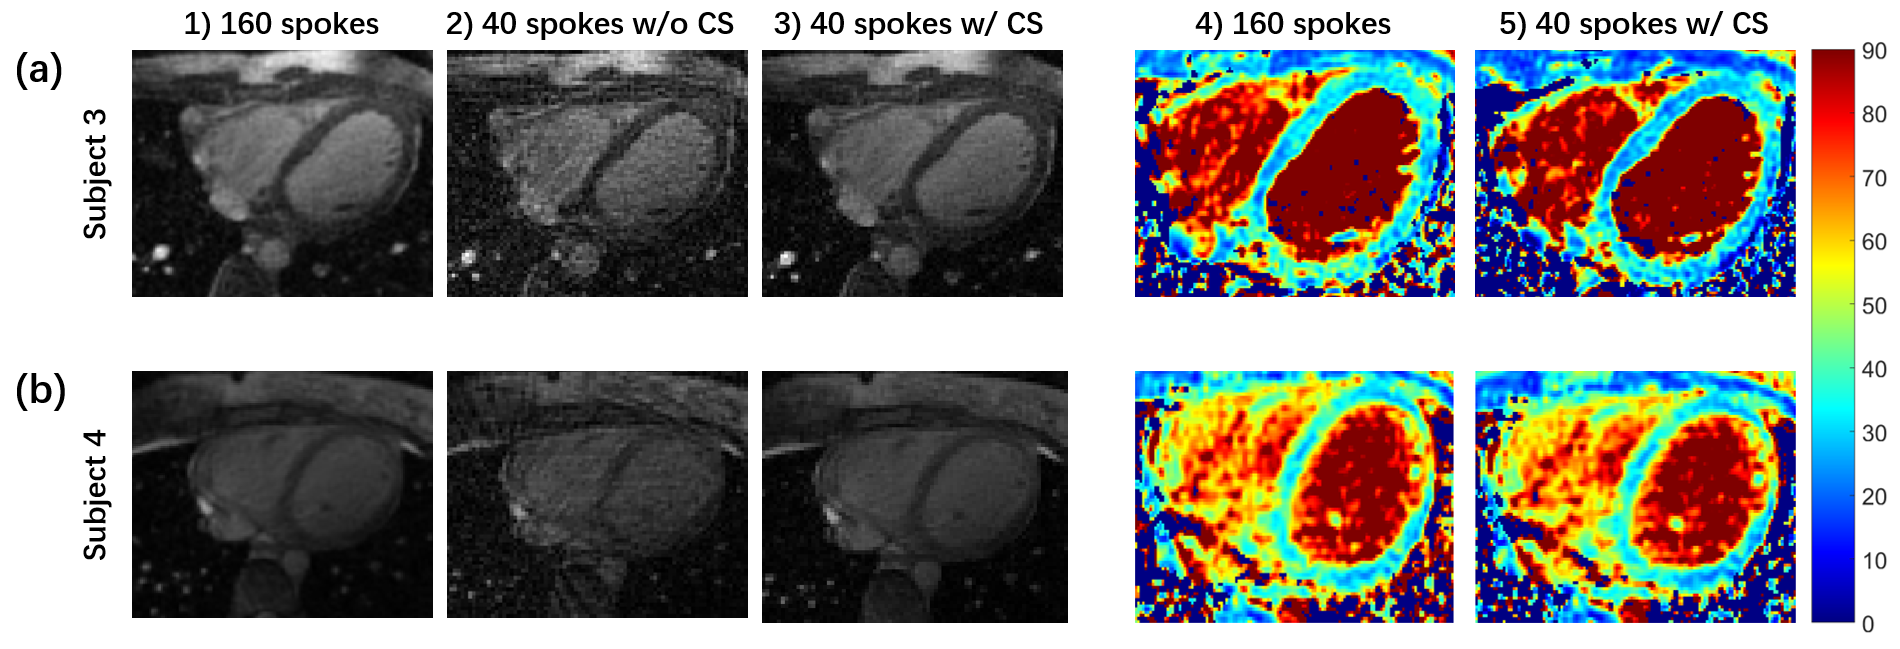
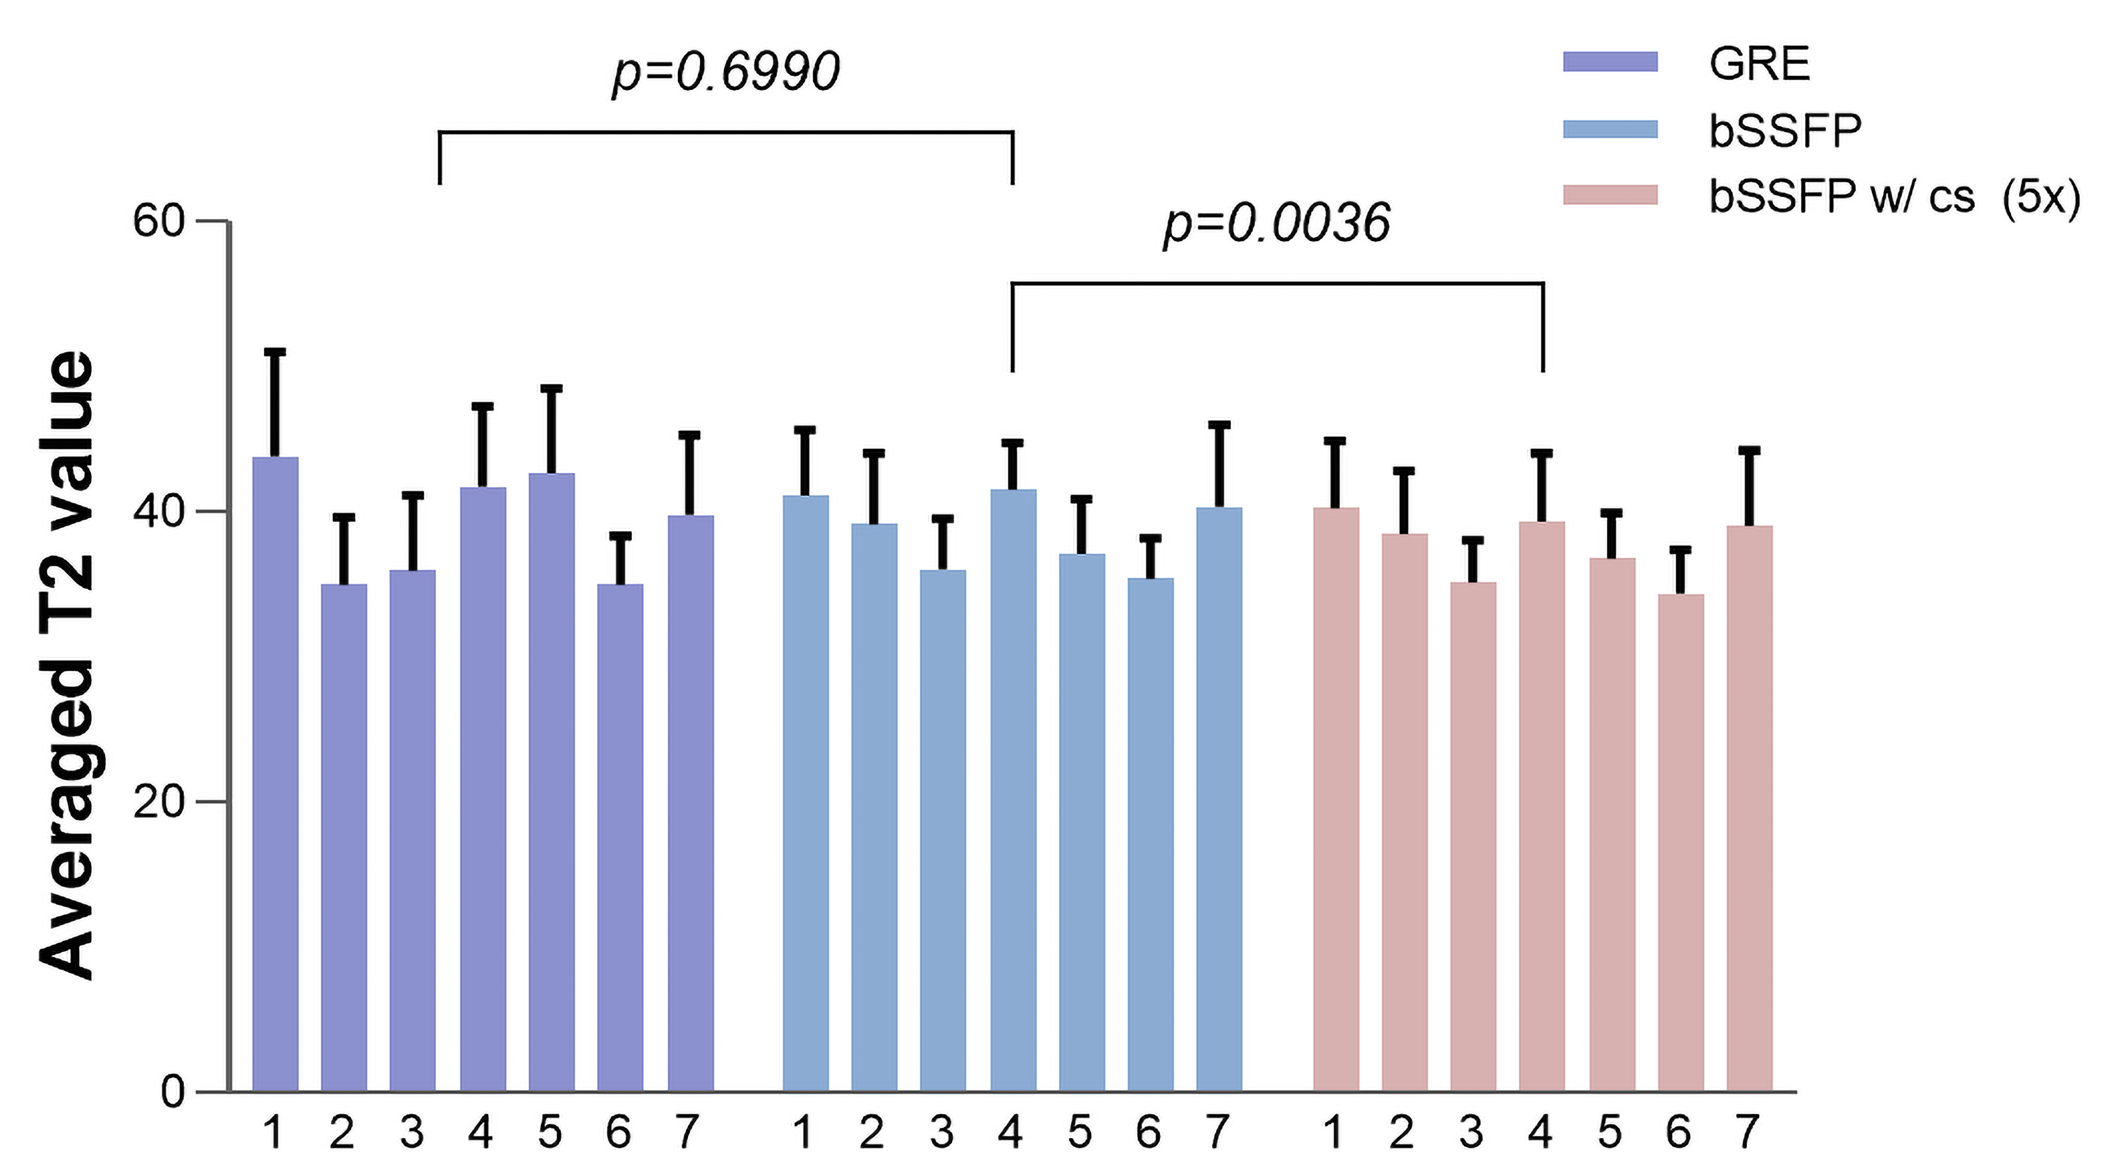
Comparisons between two fully sampled readouts are shown in Figure 2. The bSSFP-based T2 maps demonstrate a higher SNR and display a sharper myocardial wall (Figure 2a and c). The GRE-based method (Figure 2b and d), on the other hand, demonstrates that the images have dramatically increased heterogeneity. The poor homogeneity of myocardial tissue and blood makes it difficult to separate these two structures. Quantitative SNRs are summarized in Figure 3. Statistical significance is achieved for both myocardial (P = 0.0036) and blood pool SNR comparisons (P = 0.0005). Figure 4 gives comparisons between fully sampled bSSFP results and undersampled results with and without CS. As can be seen, with CS, the images are comparable to the fully sampled results and immune to radial artifacts that are shown in the original undersampled images, and the average scan time significantly reduced from over 20 minutes to under 6 minutes. Figure 5 shows T2 values estimated: 39.13 ± 5.31 ms (GRE); 38.73 ± 4.03 ms (bSSFP); 37.59 ± 3.98 ms (CS), and statistical significance was not achieved (P >> 0.05) between the fully sampled GRE and bSSFP T2 values. Although a significant difference between the latter two is reached, the small underestimation of T2 of CS (only 1-2 ms) is still totally acceptable. In addition, all the T2 estimations are consistent with previously reported results (11,15).Discussion and Conclusion
In this study, we developed a novel technique to construct free-breathing 3D cardiac T2 mapping using a bSSFP-based tiny golden-angle hybrid radial-cartesian trajectory within 6 minutes. The proposed approach yields significantly improved SNR and stable image quality in healthy human subjects, and the accuracy and precision of the T2 values can be guaranteed at the same time.Acknowledgements
This study is supported in part by the National Science Foundation of China (Grant numbers: 91859121, 81627806) and the Fundamental Research Funds for the Central Universities (Grant numbers: WK5290000001, WK5290000002).References
1. Higgins CB, Herfkens R, Lipton MJ, et al. Nuclear magnetic resonance imaging of acute myocardial infarction in dogs: alterations in magnetic relaxation times. Am J Cardiol 1983;52(1):184-188.
2. Giri S, Chung YC, Merchant A, et al. T2 quantification for improved detection of myocardial edema. J Cardiovasc Magn Reson 2009;11:56.
3. Thavendiranathan P, Walls M, Giri S, et al. Improved detection of myocardial involvement in acute inflammatory cardiomyopathies using T2 mapping. Circ Cardiovasc Imaging 2012;5(1):102-110.
4. Abdel-Aty H, Cocker M, Meek C, Tyberg JV, Friedrich MG. Edema as a very early marker for acute myocardial ischemia: a cardiovascular magnetic resonance study. J Am Coll Cardiol 2009;53(14):1194-1201.
5. Markl M, Rustogi R, Galizia M, et al. Myocardial T2-mapping and velocity mapping: changes in regional left ventricular structure and function after heart transplantation. Magn Reson Med 2013;70(2):517-526.
6. Simonetti OP, Finn JP, White RD, Laub G, Henry DA. "Black blood" T2-weighted inversion-recovery MR imaging of the heart. Radiology 1996;199(1):49-57.
7. Abdel-Aty H, Simonetti O, Friedrich MG. T2-weighted cardiovascular magnetic resonance imaging. J Magn Reson Imaging 2007;26(3):452-459.
8. Zi R, Zhu D, Qin Q. Quantitative T2 mapping using accelerated 3D stack-of-spiral gradient echo readout. Magn Reson Imaging 2020;73:138-147.
9. Bustin A, Milotta G, Ismail TF, Neji R, Botnar RM, Prieto C. Accelerated free-breathing whole-heart 3D T2 mapping with high isotropic resolution. Magn Reson Med 2020;83(3):988-1002.
10. van Heeswijk RB, Piccini D, Feliciano H, Hullin R, Schwitter J, Stuber M. Self-navigated isotropic three-dimensional cardiac T2 mapping. Magn Reson Med 2015;73(4):1549-1554.
11. Wundrak S, Paul J, Ulrici J, et al. Golden ratio sparse MRI using tiny golden angles. Magn Reson Med 2016;75(6):2372-2378.
12. Yang HJ, Sharif B, Pang J, et al. Free-breathing, motion-corrected, highly efficient whole heart T2 mapping at 3T with hybrid radial-cartesian trajectory. Magn Reson Med 2016;75(1):126-136.
13. van Heeswijk RB, Feliciano H, Bongard C, et al. Free-breathing 3T magnetic resonance T2-mapping of the heart. JACC Cardiovasc Imaging 2012;5(12):1231-1239.
14. Ye JC. Compressed sensing MRI: a review from signal processing perspective. BMC Biomedical Engineering 2019;1(1).
15. Ding H, Fernandez-de-Manuel L, Schar M, et al. Three-dimensional whole-heart T2 mapping at 3T. Magn Reson Med 2015;74(3):803-816.
Figures