4000
Using Quantitative MR and Histology to Characterize Acute and Chronic DVT at 9.4T1School of Engineering Medicine, Texas A&M University, Houston, TX, United States, 2Houston Methodist Research Institute, Houston Methodist Hopsital, Houston, TX, United States, 3Department of Cardiovascular Pathology, Texas Heart Institute, Houston, TX, United States, 4Department of Pathology and Laboratory Medicine, University of Texas, Houston, Houston, TX, United States, 5Weill Cornell Medical College, Houston, TX, United States
Synopsis
Keywords: Vessels, Tissue Characterization, DVT, clot
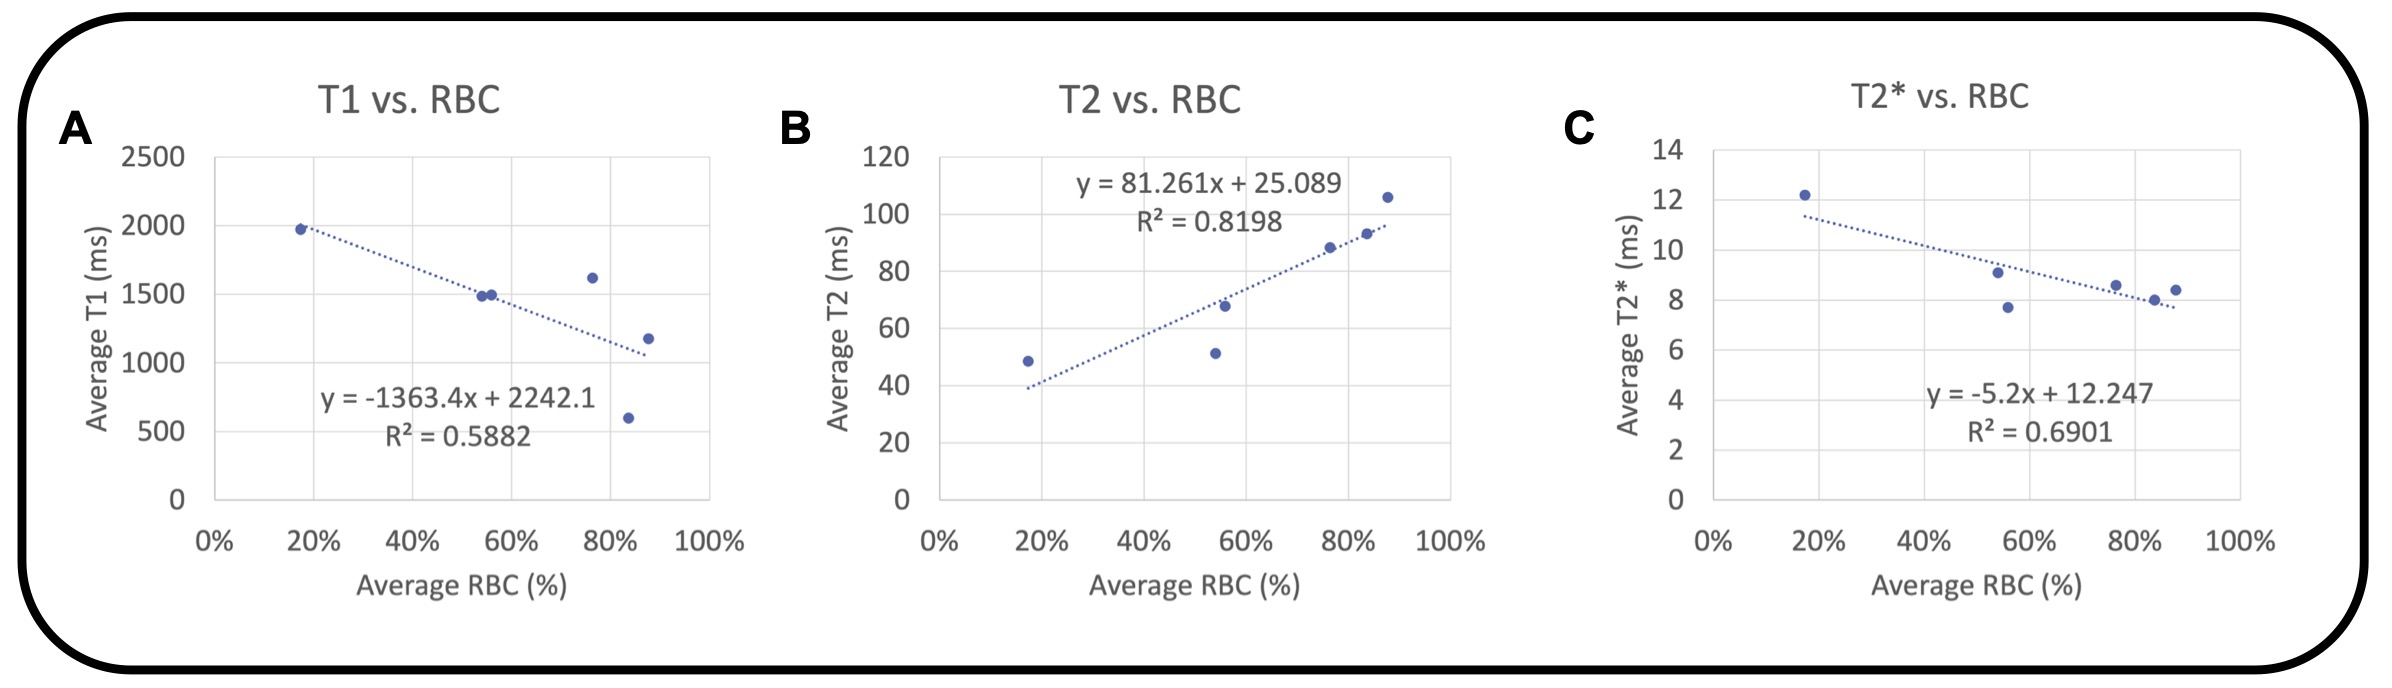
Deep venous thrombosis (DVT) is common. Mechanical thrombectomy may offer advantages compared to medical therapy alone, but it can be challenging to determine the optimal treatment. Six patients underwent thrombectomy, and the ex vivo clot was scanned at 9.4T. We acquired T1, T2, and T2* maps, and histologic content of red blood cells, fibrin, and collagen. R2 between RBC content and each relaxation time was R2 = 0.58 for T1, R2 = 0.82 for T2, and R2 = 0.69 for T2*. T1, T2, and T2* mapping of ex vivo DVT clots at 9.4T may be feasible for determining clot components.INTRODUCTION
Deep venous thrombosis (DVT) is common1 and growing in incidence with the COVID-19 pandemic2. The mainstay of treatment for DVT is medical therapy with anticoagulation. More recently, mechanical thrombectomy, performed under X-ray fluoroscopy guidance, is used in some centers, and resulted in reduced acute symptoms, hospital stay, recurrent VTE and post-thrombolytic syndrome at 6 months, as compared to medical therapy alone3. Not all DVTs are amenable to mechanical thrombectomy and current devices are not effective for chronic DVT clots that have aged and organized with higher collagen content. There is currently no way of knowing the composition of clot in advance to determine if patients are good candidates for thrombectomy. MRI relaxation times, such as T1, T2, and T2*, could provide quantitative metrics, but there has been limited work done in distal extremity DVT, particularly at higher field strength. T1 relaxation times have shown correlation to iron accumulating in venous thrombus as paramagnetic Fe3+, and may predict the thrombus susceptibility to lysis4. T2 relaxation times have shown correlation to spatial collagen structure in other tissues, such as articular cartilage5, which may be useful for DVT. R2* (1/T2*) has shown correlation with aging hematocrit of in vitro thrombus6. In this work, we assess the feasibility of T1 mapping using rapid acquisition with relaxation enhancement (RARE), T2 mapping using multi-slice multi-echo (MSME), and T2* mapping using multi-gradient echo (MGE) sequences on ex vivo DVT clots at 9.4T, and correlate with histologic content.METHODS
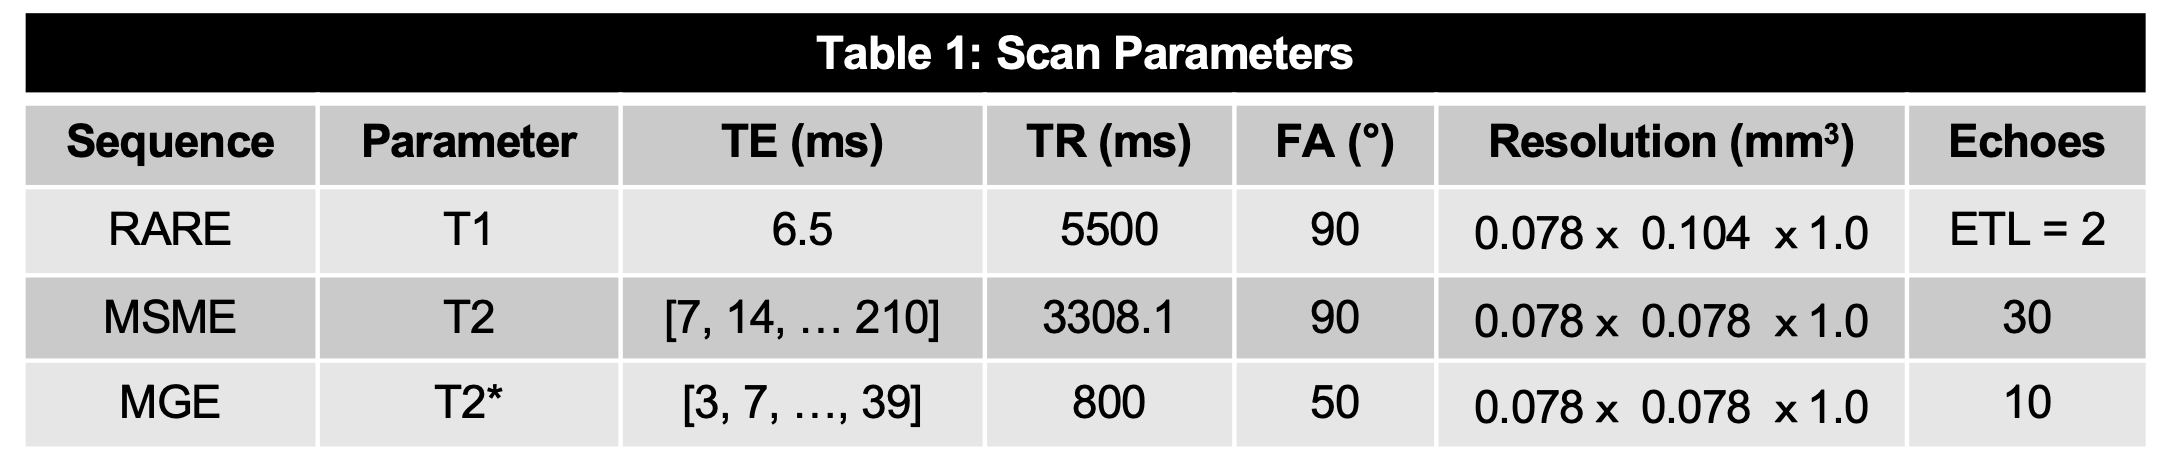
Acquisition: Six patients with DVT (3F/3M, mean age 55.3±18.1 years, mean BMI 29.7±6.2) underwent a thrombectomy and the removed clot was scanned within 24 hours. IRB approval and informed consent were obtained. Images were acquired using a Bruker 9.4T Advance 400 scanner (Bruker Corp., Billerica, MA). One clot was split into two because it was too large.Scan Parameters: T1 maps were acquired using a rapid acquisition with relaxation enhancement (RARE) sequence, and a parametric fit was performed on the scanner using a T1 saturation recovery technique. T2 maps were calculated from the multi-slice multi-echo (MSME), and T2* maps were obtained using a multi-gradient echo (MGE) sequence, both using a mono-exponential fit (Table 1).
Analysis: Data analysis was performed in Matlab (R2022a, Mathworks, Natick, MA). A mask was created by thresholding magnitude images of the first echo of the MGE magnitude images. The mask for the T1 maps was interpolated to fit its lower in-plane resolution, compared to the magnitude. For each map, mean and standard deviation over the entire volume were calculated. A linear correlation was calculated between RBC content and the relaxation times for all clots except #2, as no histology was acquired there.
Histology: Thrombi were fixed in 10% formalin for 24 hours and processed for paraffin embedding. 5 𝞵m-thick paraffin sections were stained with Hematoxylin & Eosin, Masson’s Trichrome, and anti-CD-61 immunohistochemistry. Digitized images of stained sections were analyzed by pixel color thresholding to identify red blood cell, fibrin/platelet or collagen rich regions.
RESULTS
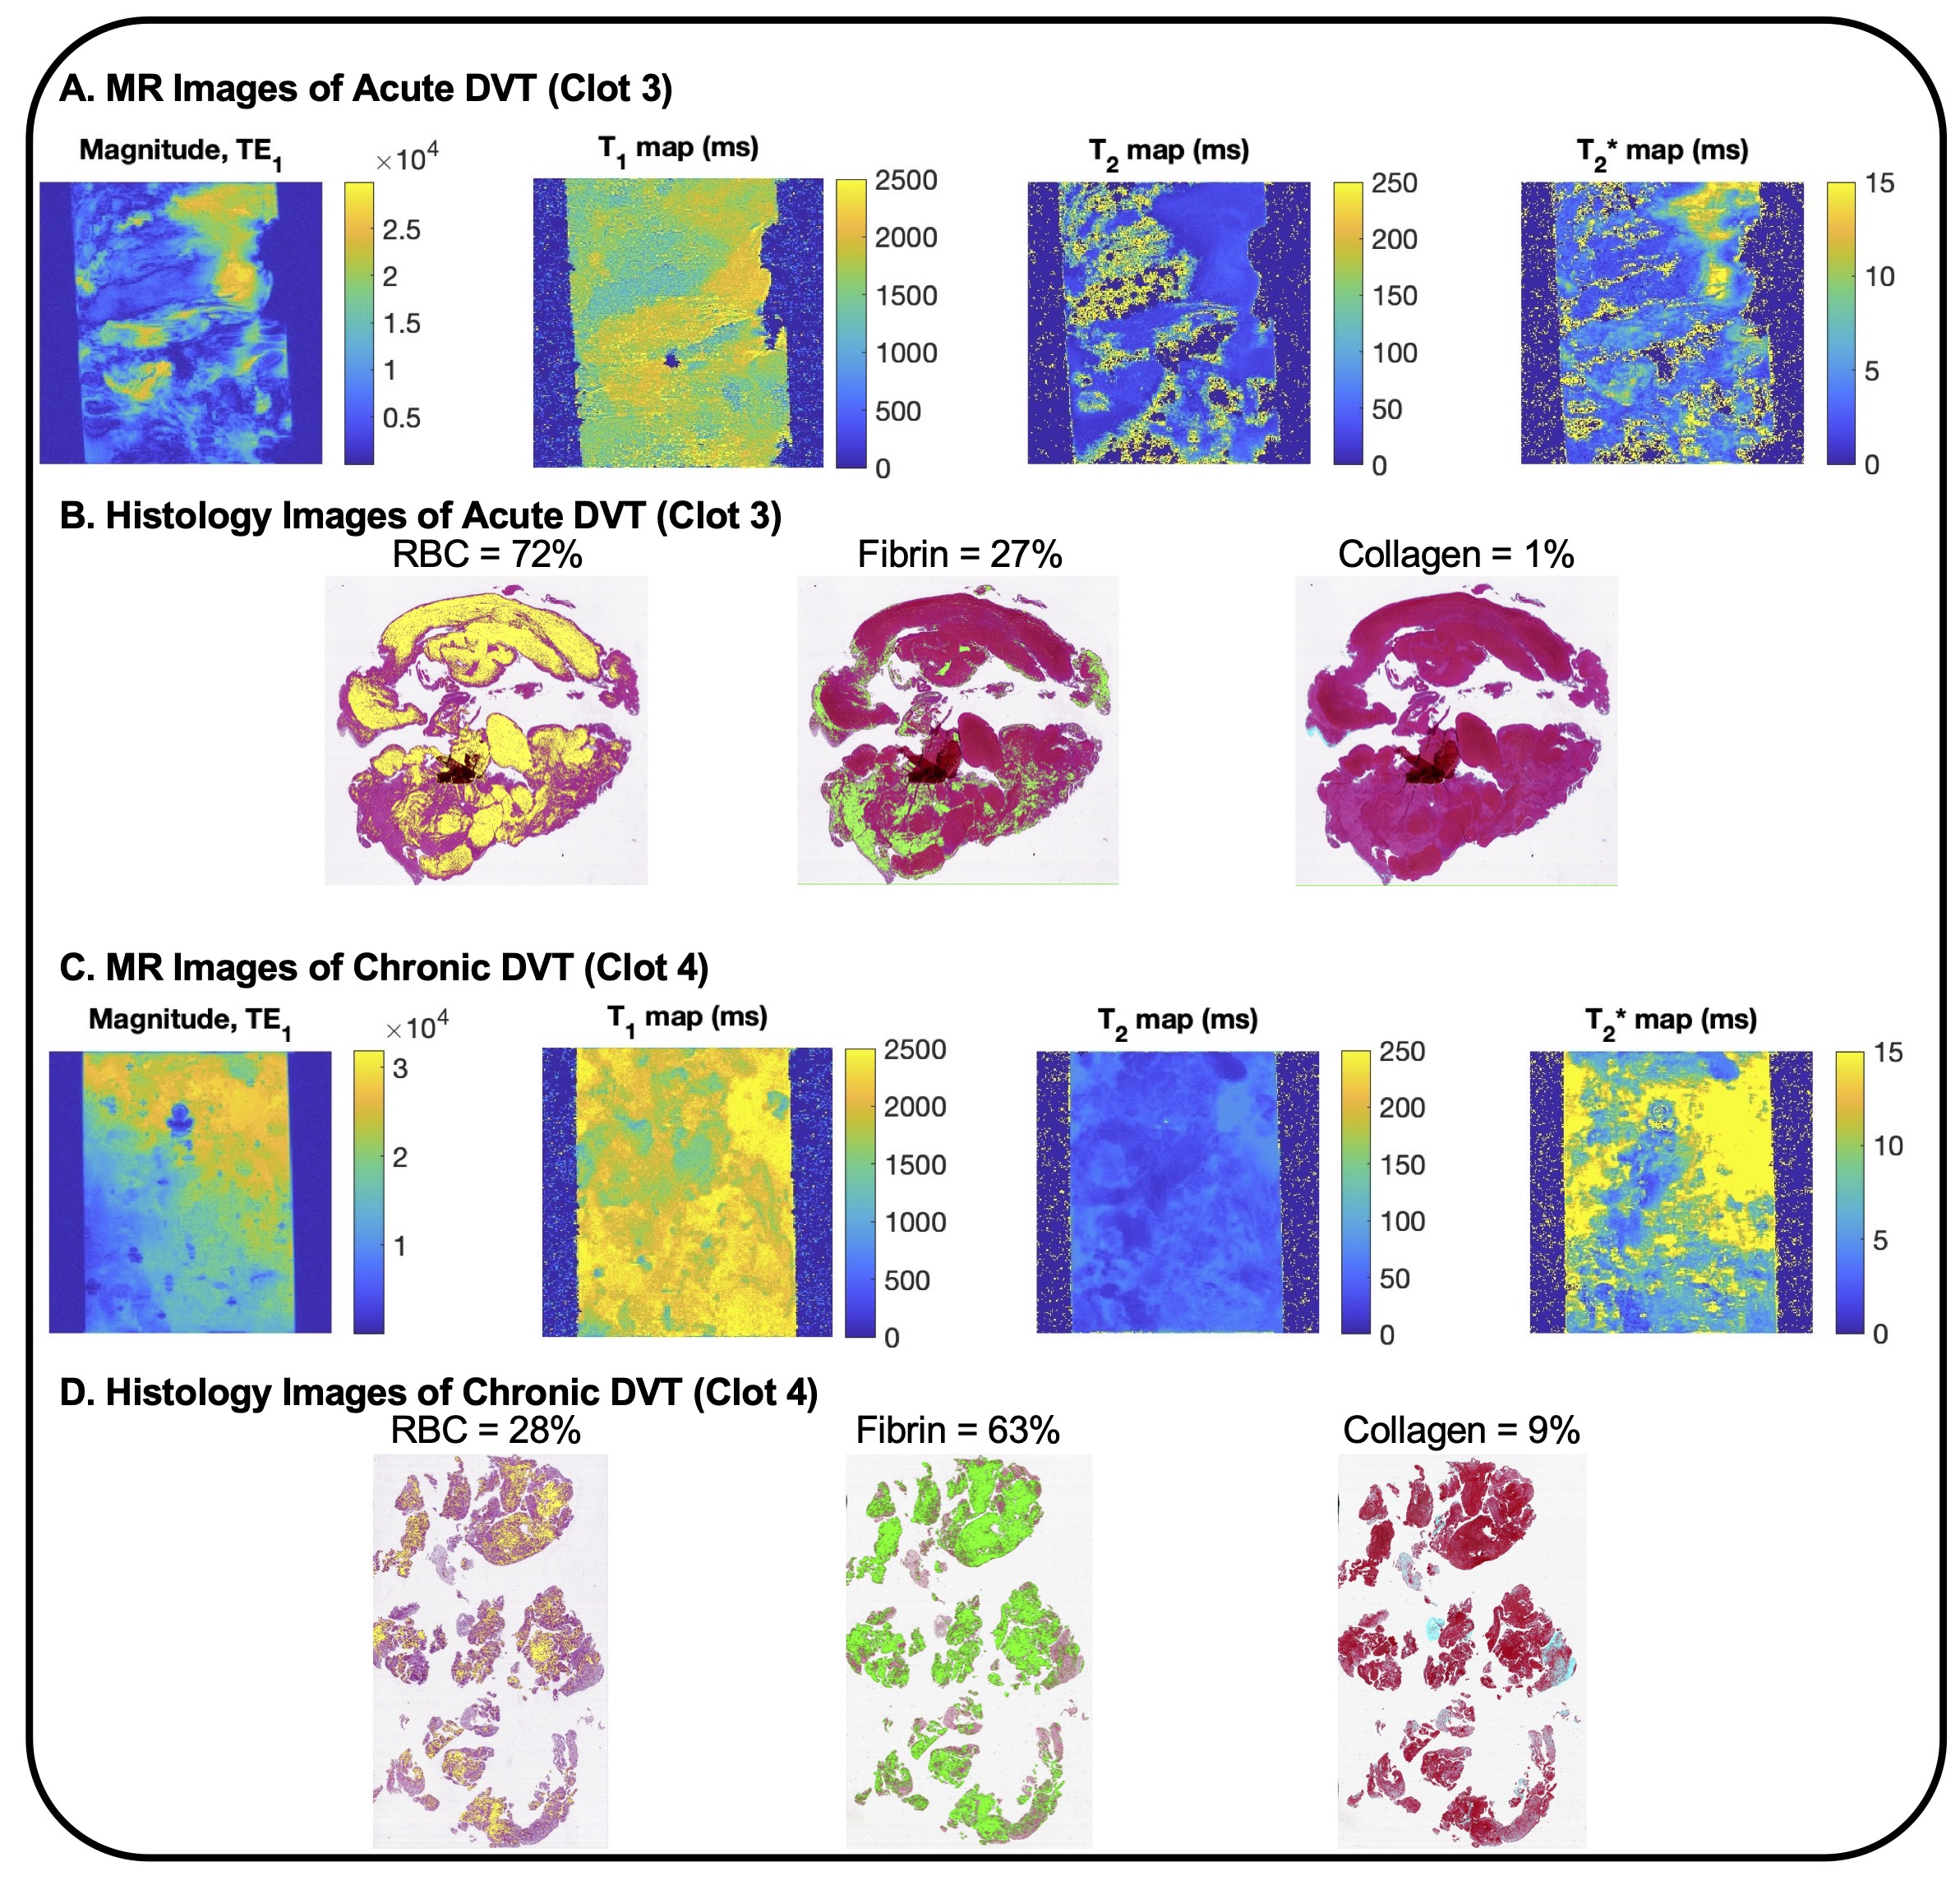
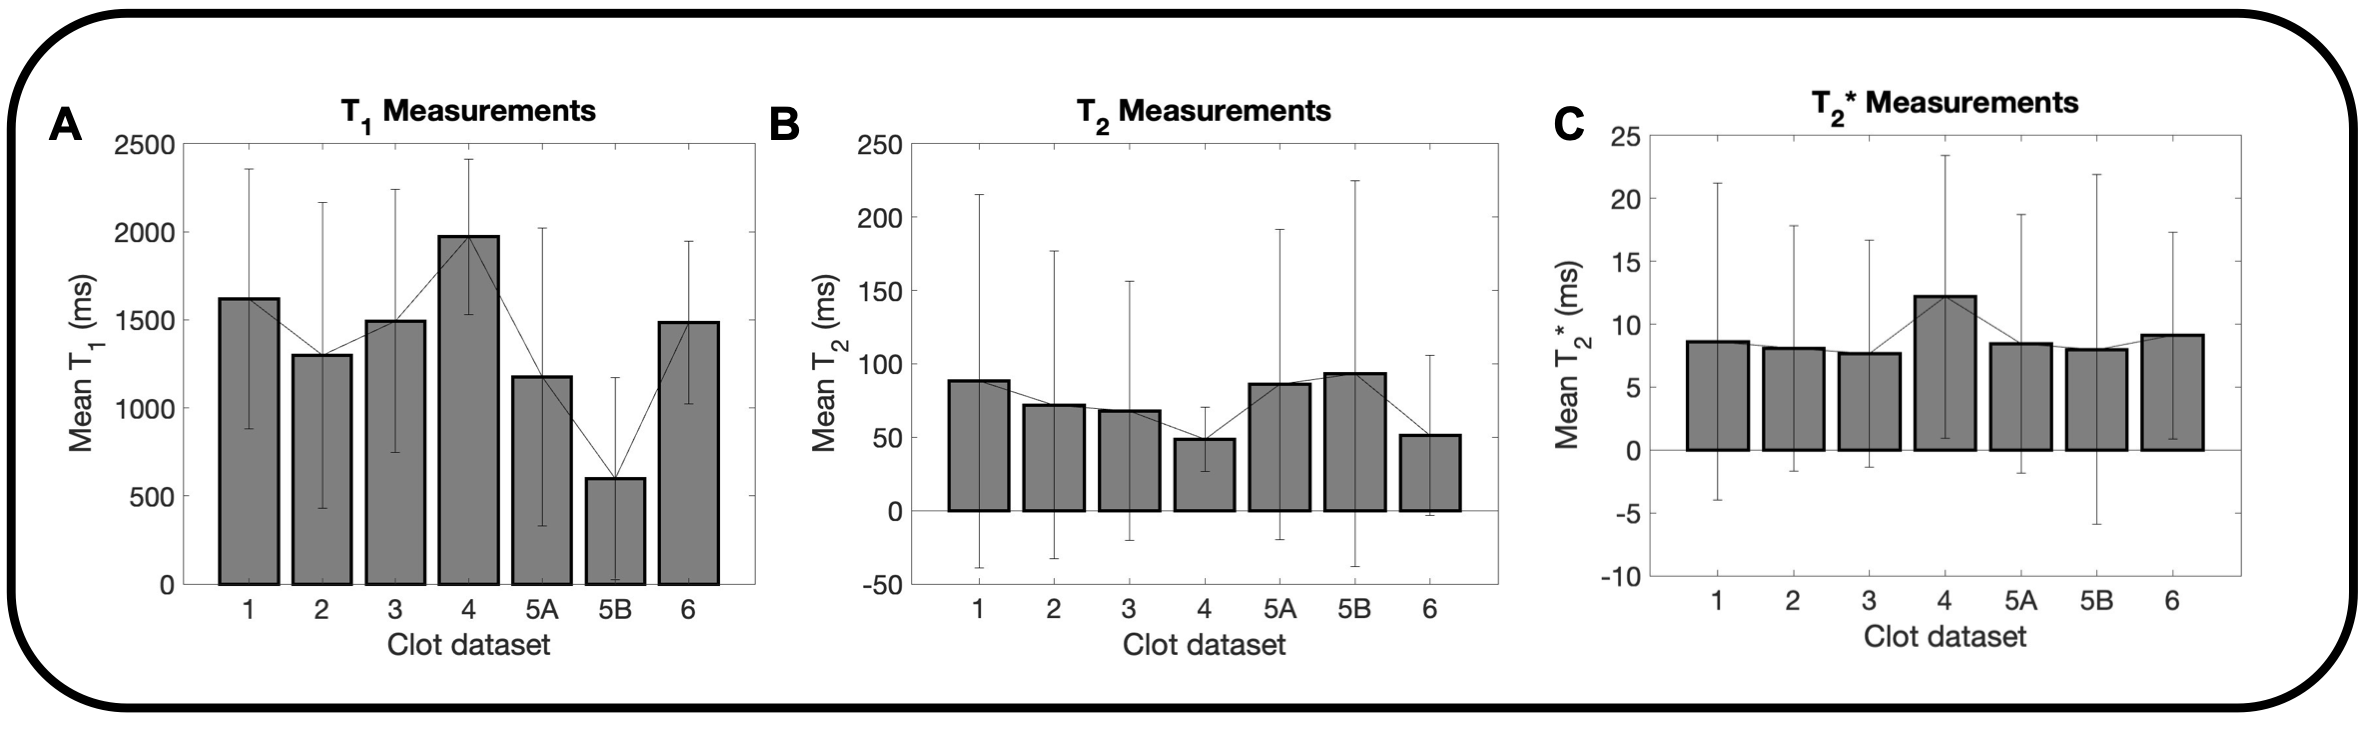
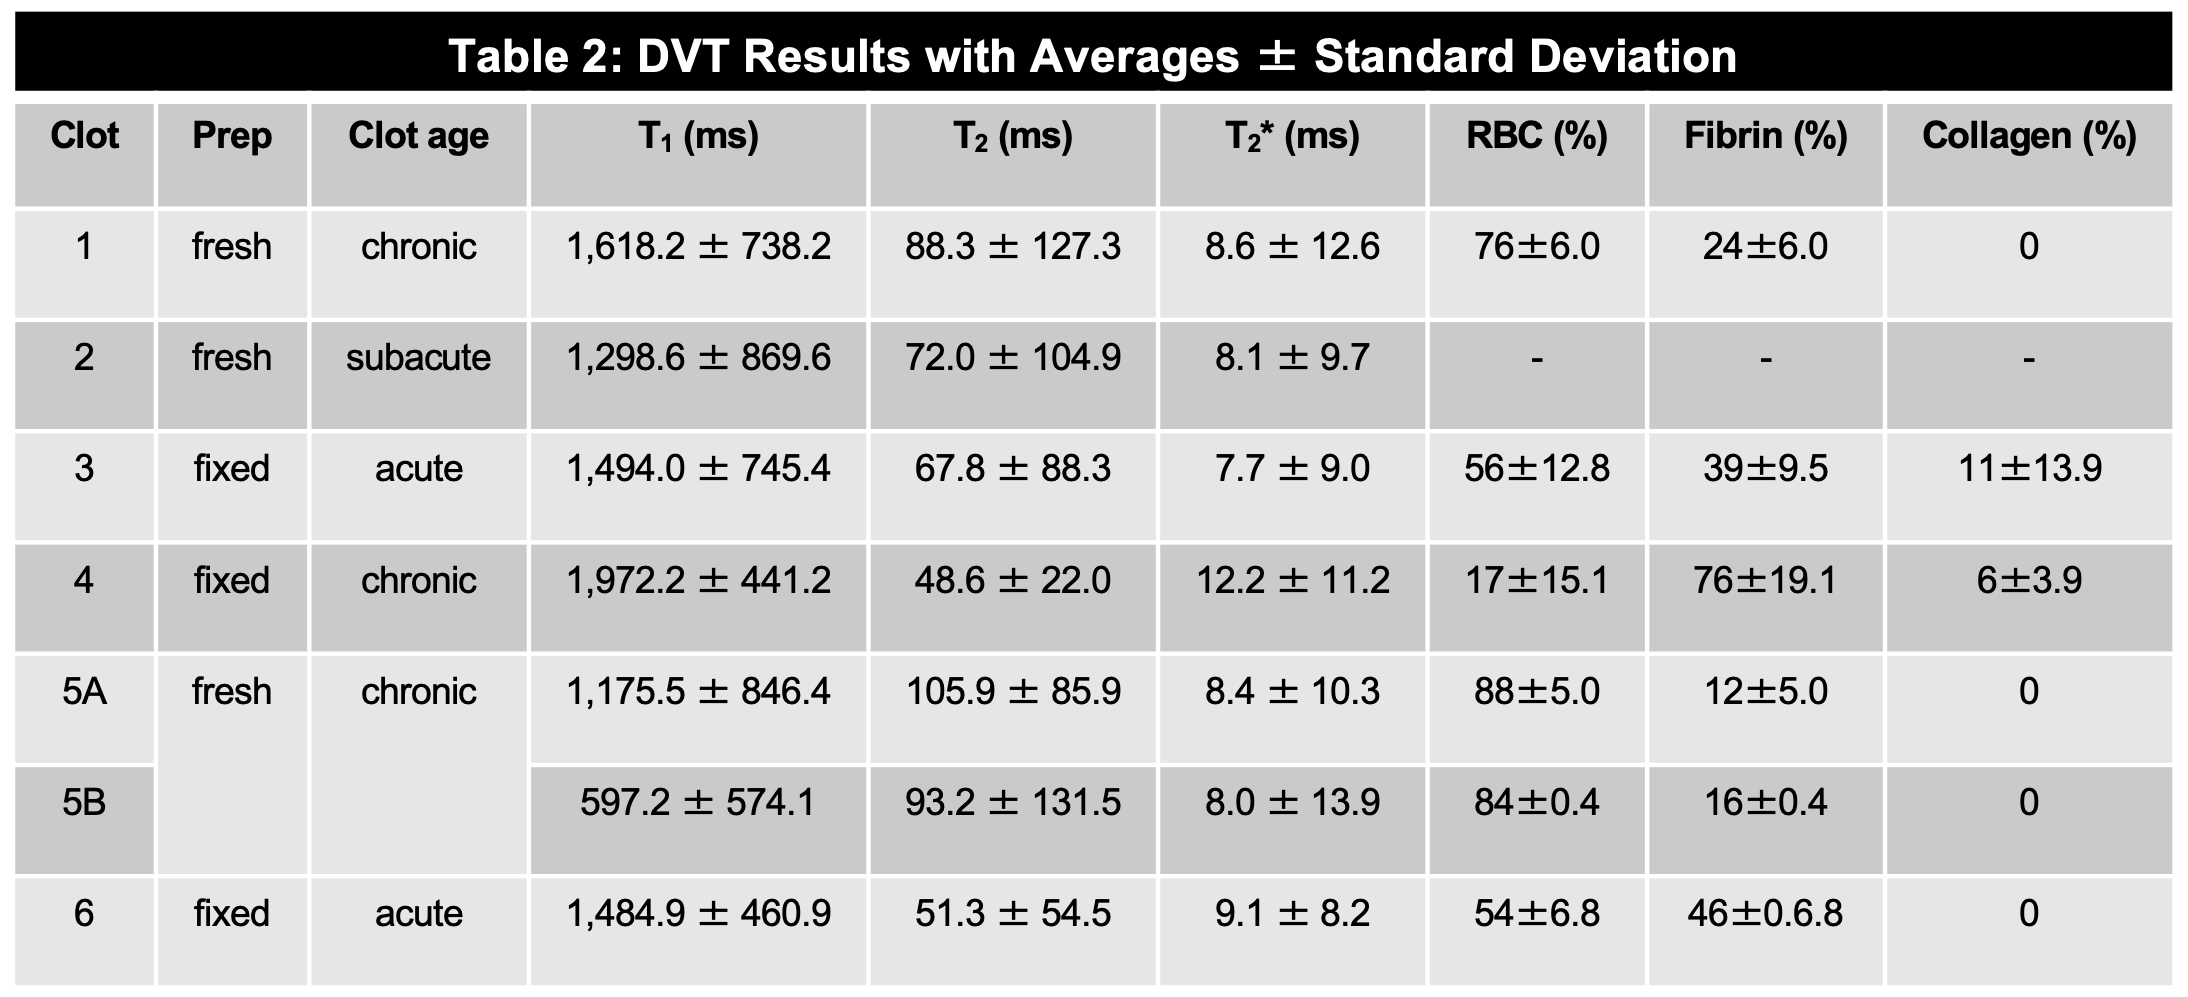
The magnitude, T1, T2, and T2* maps are shown for an acute clot (Fig. 1A), along with an example histology slice (Fig. 1B). Similarly, the magnitude, T1, T2, and T2* maps are shown for a chronic clot (Fig. 1C), along with an example histology slice (Fig. 1D). Amongst the datasets, the mean T1 was 1,425.8 ms for acute, and 1,340.8 ms for chronic clots. The mean T2 was 63.7 ms for acute, and 84.0 ms for chronic clots. The mean T2* was 8.3 ms for acute, and 9.3 ms for chronic clots (Fig. 2, Table 2). The coefficient of determination (R2) between RBC content and each relaxation time was R2 = 0.58 for T1, R2 = 0.82 for T2, and R2 = 0.69 for T2* (Fig. 3).DISCUSSION
A prior study at 1.5T found an average of T1 = 843 ms in vivo for patients with an acute DVT, and T1 = 1,317 ms after 6 months7, which may be consistent with our ex vivo results at 9.4T, since T1 is expected to increase with higher field strengths, and the different environment8. A prior study found R2* was 5–20 s-1 for acute, and 5–100 s-1 for chronic clot in vitro at 3T, corresponding to T2* of 5–200 ms6, which may also be consistent with our results, since T2* is expected to shorten at higher field strengths. A recent study found an inverse correlation between thrombus T2* and red blood cell content, with a correlation coefficient of -0.419. Another recent study also found in vitro thrombus T2* relaxation time decreased from 126 ms to 37 ms at 3T as the RBC/fibrin ratio content increased from fibrin-rich with 95% plasma / 5% RBCs to RBC-rich with 5% plasma / 95% RBCs10. This dataset is very preliminary, since there are only six patients; however, this is an ongoing study.CONCLUSION
These initial results suggest that quantitative MRI of ex vivo DVT clots at high field strength is feasible, and may provide good correlation with histologic content, and may provide a reference for distinguishing acute and chronic clot characteristics in future DVT research.Acknowledgements
The authors gratefully acknowledge the HMH MRI Technologists and the Jerold B. Katz Academy of Translational Research Investigator funding.
References
1. Bates, S. M. et al. Diagnosis of DVT: Antithrombotic therapy and prevention of thrombosis, 9th ed: American College of Chest Physicians evidence-based clinical practice guidelines. Chest 141, e351S-e418S (2012).
2. Avruscio, G. et al. COVID-19 and Venous Thromboembolism in Intensive Care or Medical Ward. Clin. Transl. Sci. 13, 1108–1114 (2020).
3. Sharifi, M., Mehdipour, M., Bay, C., Smith, G. & Sharifi, J. Endovenous therapy for deep venous thrombosis: The TORPEDO trial. Catheter. Cardiovasc. Interv. 76, 316–325 (2010).
4. Saha, P. et al. Magnetic resonance T1 relaxation time of venous thrombus is determined by iron processing and predicts susceptibility to lysis. Circulation 128, 729–736 (2013).
5. Nieminen, M. T. et al. T2 relaxation reveals spatial collagen architecture in articular cartilage: A comparative quantitative MRI and polarized light microscopic study. Magn. Reson. Med. 46, 487–493 (2001).
6. Christiansen, S. D., Liu, J., Boffa, M. B. & Drangova, M. Simultaneous R2∗ and quantitative susceptibility mapping measurement enables differentiation of thrombus hematocrit and age: An in vitro study at 3T. J. Neurointerv. Surg. 11, 1155–1161 (2019).
7. Blume, U. et al. 3D T 1-mapping for the characterization of deep vein thrombosis. Magn. Reson. Mater. Physics, Biol. Med. 22, 375–383 (2009).
8. Bottomley, P. A., Foster, T. H., Argersinger, R. E. & Pfeifer, L. M. A review of normal tissue hydrogen NMR relaxation times and relaxation mechanisms from 1-100 MHz: dependence on tissue type, NMR frequency, temperature, species, excision, and age. Med. Phys. 11, 425–48 (1984).
9. Gilbert, A. et al. Magnetic resonance imaging quantitative T2* mapping to predict the red blood cell content of in vivo thrombi retrieved from patients with large vessel occlusions in acute ischemic stroke. Interv. Neuroradiol. 1–8 (2021). doi:10.1177/15910199211042473
10. Ding, Y. et al. In Vitro Study of Blood Clot Identification and Composition Assessment by Different Magnetic Resonance Sequences. Cureus 13, 1–7 (2021).
Figures