3997
Multiparametric 3D cardiac MR for simultaneous bright- and black-blood imaging and joint T1/T2 myocardial tissue mapping1Department of Diagnostic and Interventional Radiology, Klinikum rechts der Isar, Technische Universität München, Munich, Germany, 2School of Biomedical Engineering and Imaging Sciences, King's College London, London, United Kingdom, 3Institute for Advanced Study, Technische Universität München, Garching, Germany, 4MR Research Collaborations, Siemens Healthcare Limited, Frimley, United Kingdom, 5Millennium Institute for Intelligent Healthcare Engineering, Santiago, Chile, 6Escuela de Ingeniería, Pontificia Universidad Católica de Chile, Santiago, Chile, 7Instituto de Ingeniería Biológica y Médica, Pontificia Universidad Católica de Chile, Santiago, Chile
Synopsis
Keywords: Heart, Data Acquisition
Accurate diagnosis of cardiac disease requires imaging with high spatial resolution and whole-heart coverage. Current clinical protocols acquire contrasts sequentially, in different 2D orientations during several breath-holds leading to long examination times and misregistration artifacts. To address these limitations, we present a novel free-breathing four-heartbeat sequence for simultaneous 3D whole-heart Assessment of Cardiovascular anaTomy via bright- and black-blood Imaging and T1/T2 myocardial tissue quantificatiON (ACTION). Sequence parameters are optimized with Bloch simulations to enhance the mapping sensitivity and to improve the quality of anatomical images. Primarily results in a standardized phantom and in-vivo show potential for comprehensive heart disease detection.Introduction
Cardiovascular MR is the clinical reference standard for assessment of cardiac anatomy and tissue characterization1,2 and has shown potential for coronary stenosis and plaque detection. Current clinical protocols acquire the images sequentially, in different orientations and usually during several breath-holds, thereby resulting in long scan times, limited spatial resolution and coverage. To address these limitations, a motion-compensated two-heartbeat (HB) sequence for visualization of aortic and coronary vessel walls was proposed3,4. Moreover, the acquisition of joint T1/T2 maps for myocardial tissue characterization with whole-heart coverage was demonstrated5,6. In this work, we sought to combine both approaches and to develop a novel free-breathing sequence providing simultaneous 3D whole-heart Assessment of Cardiovascular anaTomy via bright- and black-blood Imaging and T1/T2 myocardial tissue quantificatiON (ACTION).Methods
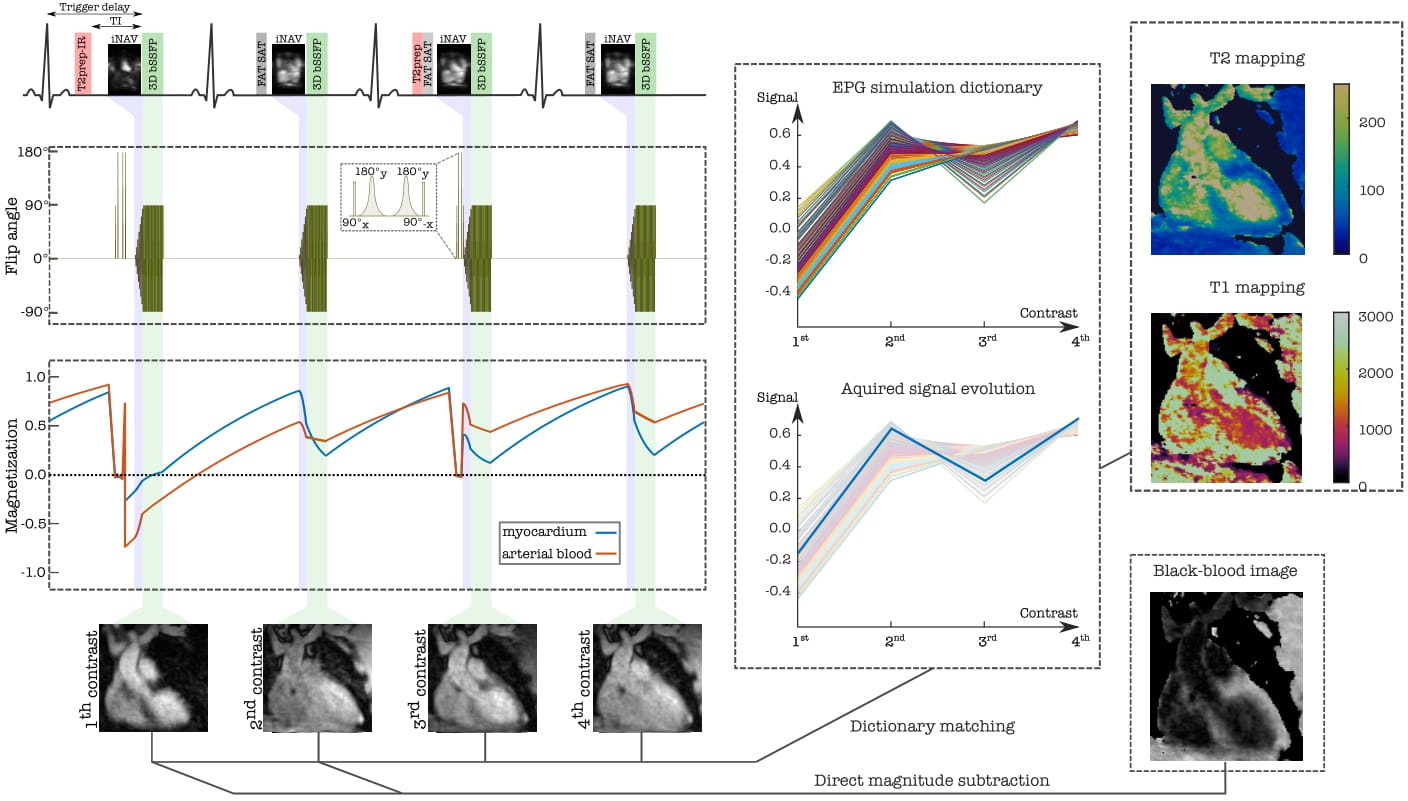
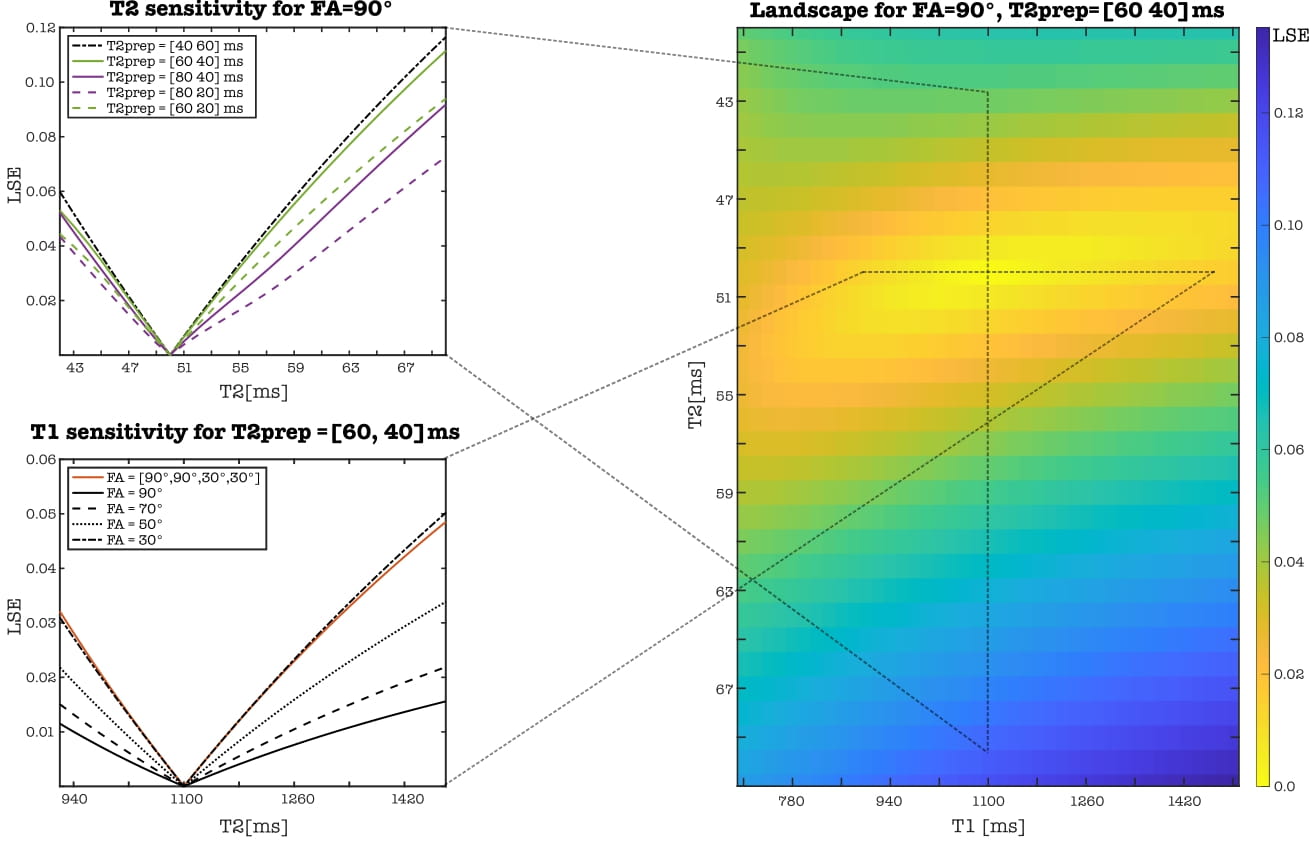
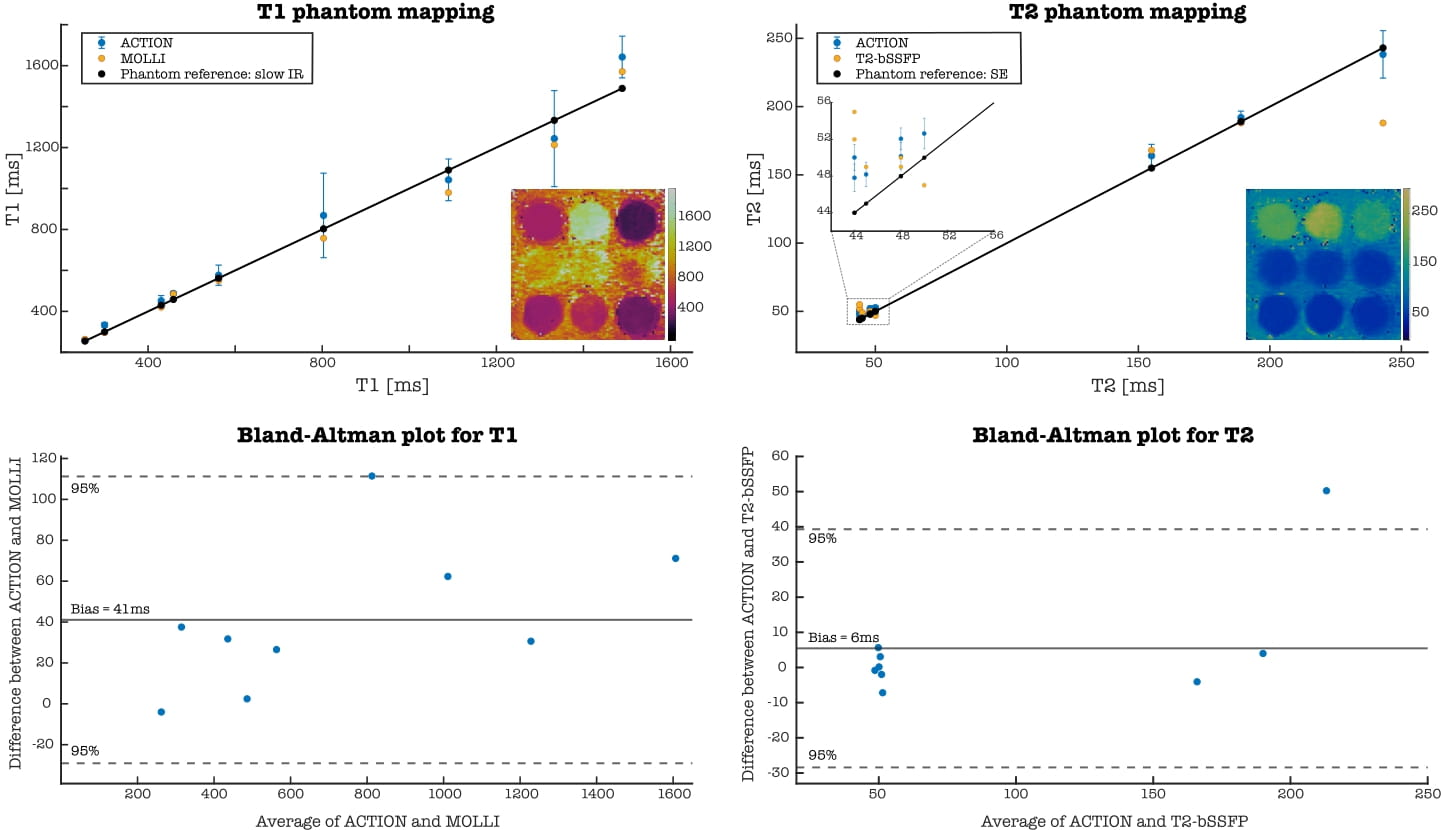
ACTION consists of a repeating set of different preparation pulses performed over four interleaved contrasts: T2prep-IR, no-prep, T2prep, no-prep (Figure 1). A T2prep-IR with short inversion time (TI) of 110 ms is employed in the 1stHB for a bright-blood volume with good myocardium to blood contrast and intrinsic epicardial fat suppression, while no preparation is applied in the 2ndHB to generate a black-blood volume by direct magnitude subtraction of the first from the second image. An additional T2prep pulse is performed in the 3rdHB to enhance T2 encoding sensitivity while the 4thHB is untouched to allow for magnetization recovery to enhance T1 sensitivity. Joint T1/ T2 values are obtained by simulating the signal evolution using extended phase graph (EPG)7 approach and by voxel-wise matching of the generated dictionary (40% of the inner k-space circle) to the measured data by minimizing the least square error (LSE). Imaging is performed with a 3D bSSFP8 sequence in coronal orientation and 33 k-space lines acquired per HB, corresponding to a data acquisition duration of 120ms at mid-diastole. Imaging parameters include TR/TE=3.6/1.5ms, FOV=320x320x90-115mm3 and isotropic spatial resolution=1.4mm. 2D low-resolution image-based navigators (iNAVs) estimating the respiratory induced heart motion are acquired prior to each acquisition by spatially encoding the 14 ramp-up pulses of the bSSFP sequence and are used to correct for beat-to-beat translational right-left and foot-head respiratory motion9. For imaging acceleration, a variable-density 3D cartesian trajectory with spiral profile order (VD-CASPR)10 and golden angle step is employed to acquire 4-fold undersampled data providing 100% respiratory scan efficiency and predictable scan time. Highly accelerated data is reconstructed with iterative SENSE11 combined with high‐dimensionality patch‐based low-rank regularization (HD‐PROST)12. Different combinations of FA and T2prep length were investigated using Bloch simulations to optimize contrast-to-noise ratio values for bright- and black-blood images as well as accuracy and precision of T1/T2 mapping. Landscape graphs were used to estimate T1/T2 sensitivity and represent the LSE variation between reference myocardium and selected dictionary T1/T2 pair. The steepness of the LSE gradient was used as a measure of mapping sensitivity. To validate the optimal sequence parameters, a standardized phantom13, covering clinically relevant ranges of T1 and T2 in blood and myocardium, was scanned at a 1.5T MR scanner (MAGNETON Aera, Siemens Healthincare, Erlangen, Germany). The experiment was performed by varying the FA 60°-90° and T2prep duration 40-120ms in 1stHB with fixed T2prep of 40 ms in the 3rdHB, simulated heart rate was of 60 bpm. For the optimal parameters, ACTION was compared with MOLLI13 and T2-bSSFP mapping sequences.Results and discussion
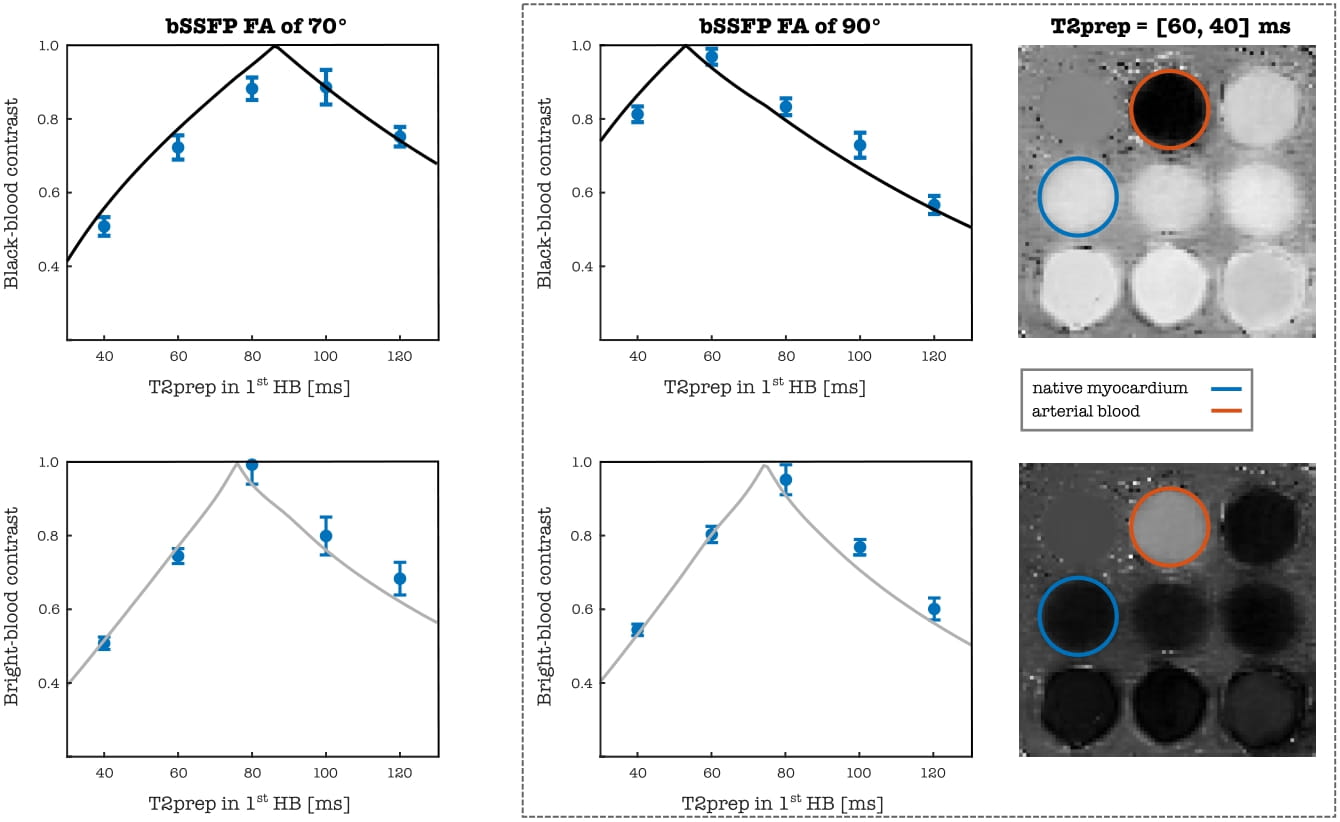
Simulations: The best T2 encoding for myocardium was estimated for values close to and above the duration of each of the T2prep modules (Figure 2, top left). Although changing the order of T2prep modules has almost no influence on the T2 sensitivity, it affects the appearance of the anatomical images in 1stHB1 and 2ndHB and thus a longer T2prep was chosen for the phantom experiment in 1stHB (Figure 3). Sensitivity for long T1 values was improved for lower FAs, since the magnetization is less influenced by the read-out (Figure 2, bottom left). FA=90° combined with T2prep of 60ms and 40ms was considered as the optimal choice providing good contrast in the anatomical bright- and black-blood images and the acceptable T1/T2 sensitivity according to the optimization process (Figure 2,3).Phantom and in-vivo experiments: Signal evolution in acquired bright- and black blood images were in good agreement with simulated data from EPG. For each FA, the length of T2prep is selected based on the best image contrast between the vials corresponding to native myocardium and blood of the phantom. T1/T2 values estimated with optimized parameters of ACTION were in good agreement with reference values and showed less bias than conventional sequences (Figure 4). Bright- and black-blood images and joint T1/T2 maps in a healthy subject show proof-of-concept of obtaining 3D whole-heart anatomical images and parameters maps in a scan time of 13 minutes at a 1.5T MR scanner (MAGNETOM Avanto Fit, Siemens Healthineers) (Figure 1).
Conclusions and future work
We demonstrate that ACTION simultaneous bright- and black-blood imaging and joint T1/T2 mapping shows good agreement with reference values in the phantom and promising results in first in-vivo experiment. In future studies, a reduction of the FAs in 3rd/4thHB will be considered to further enhance sensitivity to T1. Additionally, non-rigid motion correction15 will be implemented to improve image quality and future validation in patients will be performed with suspected cardiovascular disease.Acknowledgements
This work was funded by the Technical University of Munich, Institute for Advanced Study, and supported by the following grants: (1) EPSRC P/V044087/1; (2) BHF programme grant RG/20/1/34802, (3) Wellcome/EPSRC Centre for Medical Engineering (WT 203148/Z/16/Z), (4) Millennium Institute for Intelligent Healthcare Engineering ICN2021_004, (5) FONDECYT 1210637 and 1210638, (6) IMPACT, Center of Interventional Medicine for Precision and Advanced Cellular Therapy, ANID FB210024.References
1. Pan Kim et al. “Myocardial T1 and T2 Mapping: Techniques and Clinical Applications”. In: KoreanJournal of Radiology 18 (Jan. 2017), p. 113. doi: 10.3348/kjr.2017.18.1.113.
2. Sophie Mavrogeni et al. “T1 and T2 Mapping in Cardiology: “Mapping the Obscure Object of Desire””.In: Cardiology 138 (Dec. 2017), pp. 207–217. doi: 10.1159/000478901.
3. Giulia Ginami et al. “Simultaneous bright- and black-blood whole-heart MRI for noncontrast enhancedcoronary lumen and thrombus visualization: Simultaneous Whole-Heart Bright- and Black-Blood Coronary MRI”. In: Magnetic Resonance in Medicine 79 (July 2017). doi: 10.1002/mrm.26815.
4. Giorgia Milotta et al. “Simultaneous 3D whole-heart bright-blood and black blood imaging for cardiovascular anatomy and wall assessment with interleaved T2prep-IR”. In: Magnetic Resonance inMedicine 82 (Mar. 2019). doi: 10.1002/mrm.27734.
5. Giorgia Milotta et al. “3D Whole-heart free-breathing qBOOST-T2 mapping”. In: Magnetic Resonance in Medicine 83.5 (2020), pp. 1673–1687. doi: https://doi.org/10.1002/mrm.28039.
6. Giorgia Milotta et al. “3D whole-heart isotropic-resolution motion-compensated joint T1/T2 mapping and water/fat imaging”. In: Magnetic Resonance in Medicine 84.6 (2020), pp. 3009–3026. doi: https://doi.org/10.1002/mrm.28330.
7. Matthias Weigel. “Extended phase graphs: Dephasing, RF pulses, and echoes - pure and simple”. In:Journal of Magnetic Resonance Imaging 41.2 (2015), pp. 266–295. doi: https://doi.org/10.1002/jmri.24619.
8. Oliver Bieri and Klaus Scheffler. “Fundamentals of balanced steady state free precession MRI”. In:Journal of Magnetic Resonance Imaging 38.1 (2013), pp. 2–11. doi: https://doi.org/10.1002/jmri.24163.
9. Markus Henningsson et al. “Whole-heart coronary MR angiography with 2D self-navigated imagereconstruction”. In: Magnetic Resonance in Medicine 67.2 (2012), pp. 437–445. doi: https://doi.org/10.1002/mrm.23027.
10. Claudia Prieto et al. “Highly efficient respiratory motion compensated free-breathing coronary mra using golden-step Cartesian acquisition”. In: Journal of Magnetic Resonance Imaging 41.3 (2015), pp. 738–746. doi: https://doi.org/10.1002/jmri.24602.
11. Klaas Paul Pruessmann et al. “SENSE: Sensitivity encoding for fast MRI”. In: Magnetic Resonance in Medicine 42 (1999).
12. Aurelien Bustin et al. “High-dimensionality undersampled patch-based reconstruction (HD-PROST) for accelerated multi-contrast MRI”. In: Magnetic Resonance in Medicine 81.6 (2019), pp. 3705–3719.doi:https://doi.org/10.1002/mrm.27694.
13. Gabriella Captur et al. “A medical device-grade T1 and ECV phantom for global T1 mapping qualityassurance—the T1 Mapping and ECV Standardization in cardiovascular magnetic resonance (T1MES)program”. In: Journal of Cardiovascular Magnetic Resonance 18 (Sept. 2016). doi: 10.1186/s12968-016-0280-z.
14. Daniel R. Messroghli et al. “Modified Look-Locker inversion recovery (MOLLI) for high-resolution T1mapping of the heart”. In: Magnetic Resonance in Medicine 52.1 (2004), pp. 141–146. doi: https://doi.org/10.1002/mrm.20110.
15. Aurelien Bustin et al. “3D whole-heart isotropic sub-millimeter resolution coronary magnetic resonanceangiography with non-rigid motion-compensated PROST”. In: Journal of Cardiovascular Magnetic Resonance 22 (Apr. 2020). doi: 10.1186/s12968-020-00611-5.
Figures