3996
Rapid Myocardial T1 Stress/Rest Reactivity Mapping in Ferumoxytol-enhanced Cardiac MRI: Initial Results1Krannert Cardiovascular Research Center, Indiana University School of Medicine, Indianapolis, IN, United States, 2Siemens Medical Solutions, Inc., Los Angeles, CA, United States, 3Department of Radiology and Imaging Sciences, Indiana University, Indianapolis, IN, United States, 4Cardiovascular Medicine, IU Health/IU School of Medicine, Indianapolis, IN, United States, 5Indiana University Health, Indianapolis, IN, United States
Synopsis
Keywords: Myocardium, Ischemia, dobutamine
Myocardial T1 reactivity, defined as the relative T1 change from rest to stress, has been proposed as a marker for detection of ischemic heart disease. SASHA-based T1 mapping provides higher accuracy than MOLLI, but the scan time can be prohibitive under stress. In this work, we investigated the feasibility of accelerated SASHA T1 mapping for ferumoxytol-enhanced dobutamine-stress T1 reactivity studies at 3T in a preclinical setting. We showed that a 2-fold accelerated SASHA T1 mapping can provide sufficiently accurate results compared to conventional SASHA.Background
Myocardial T1 reactivity, defined as the relative T1 change from rest to stress, has been proposed as a marker for detection and quantification of ischemic heart disease. Among most commonly used myocardial T1 mapping techniques, SASHA-based T1 mapping provides higher accuracy than MOLLI, due to its robustness to heart rate, T2 relaxation, and magnetization transfer (MT) effects.1-3 However, for T1 reactivity studies under exercise or dobutamine stress, the scan time needed for SASHA can be prohibitive. To mitigate this issue, recent work has shown the feasibility of accelerating SASHA by using a reduced number of T1-weighted (T1w) images when the SNR is boosted using denoising.4 An alternative to such approach can be to boost the signal by using low-dose ferumoxytol-enhanced (FE) protocols given the desirable properties of ferumoxytol for T1 reactivity studies.5 In this work, we investigated the feasibility of accelerated SASHA T1 mapping for FE dobutamine-stress T1 reactivity studies at 3T in a preclinical setting.Methods
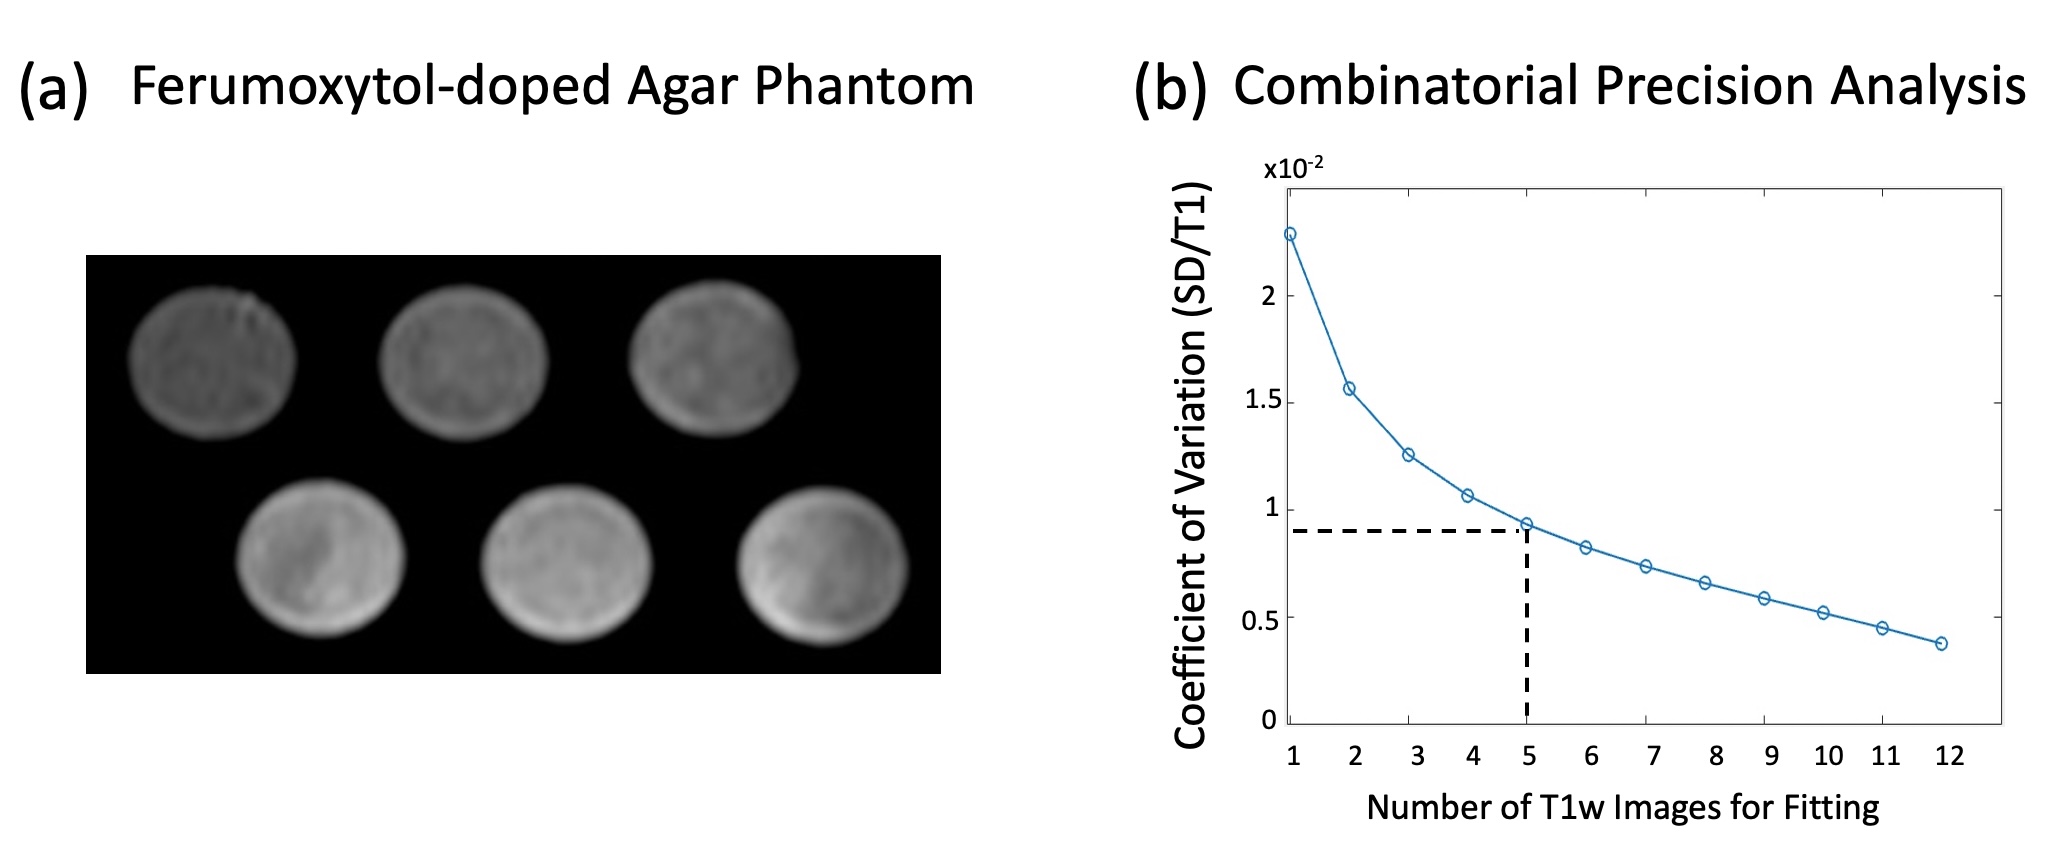
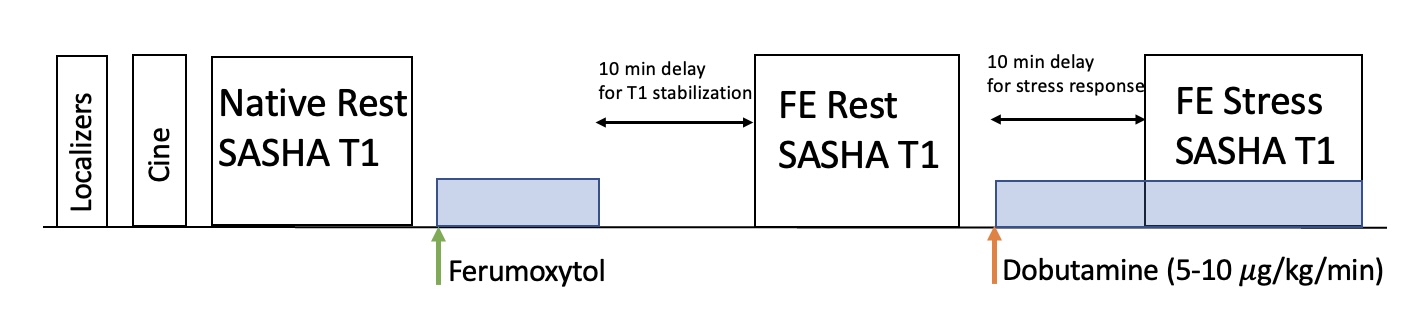
Based on prior work by Kellman et al.,6 we used a SASHA pulse sequence with optimized sampling scheme, i.e. fixed saturation recovery time, with 2-parameter fitting. We conducted phantom studies with ferumoxytol-doped agar (Fig 1a) with 6 vials with T1 range of 900 ms-1700 ms to determine the optimum number, N, of T1w images to use for accelerated SASHA mapping with acceptable precision. We compared the precision of accelerated SASHA T1 maps for all feasible choices of N (i.e., all possible combinations that use N T1-weighted images for T1 mapping). We used the coefficient of variation (CoV) defined as “standard deviation over mean T1” as a measure of precision6 and determined the lowest N (i.e., highest acceleration) that can achieve CoV < 1%. After that, we conducted stress/rest FE studies in 6 healthy pigs under a wide range of dobutamine-induced stress heart rates (to mimic exercise stress) and performed T1 reactivity analysis (2 myocardial ROIs per animal) for conventional SASHA and our proposed accelerated approach (with retrospective subsampling of SASHA-acquired T1w images). We used the initial N T1w images for accelerated SASHA T1 mapping. The ferumoxytol dose in each animal study was adjusted such that the blood pool T1 was between 250-500 ms.Results
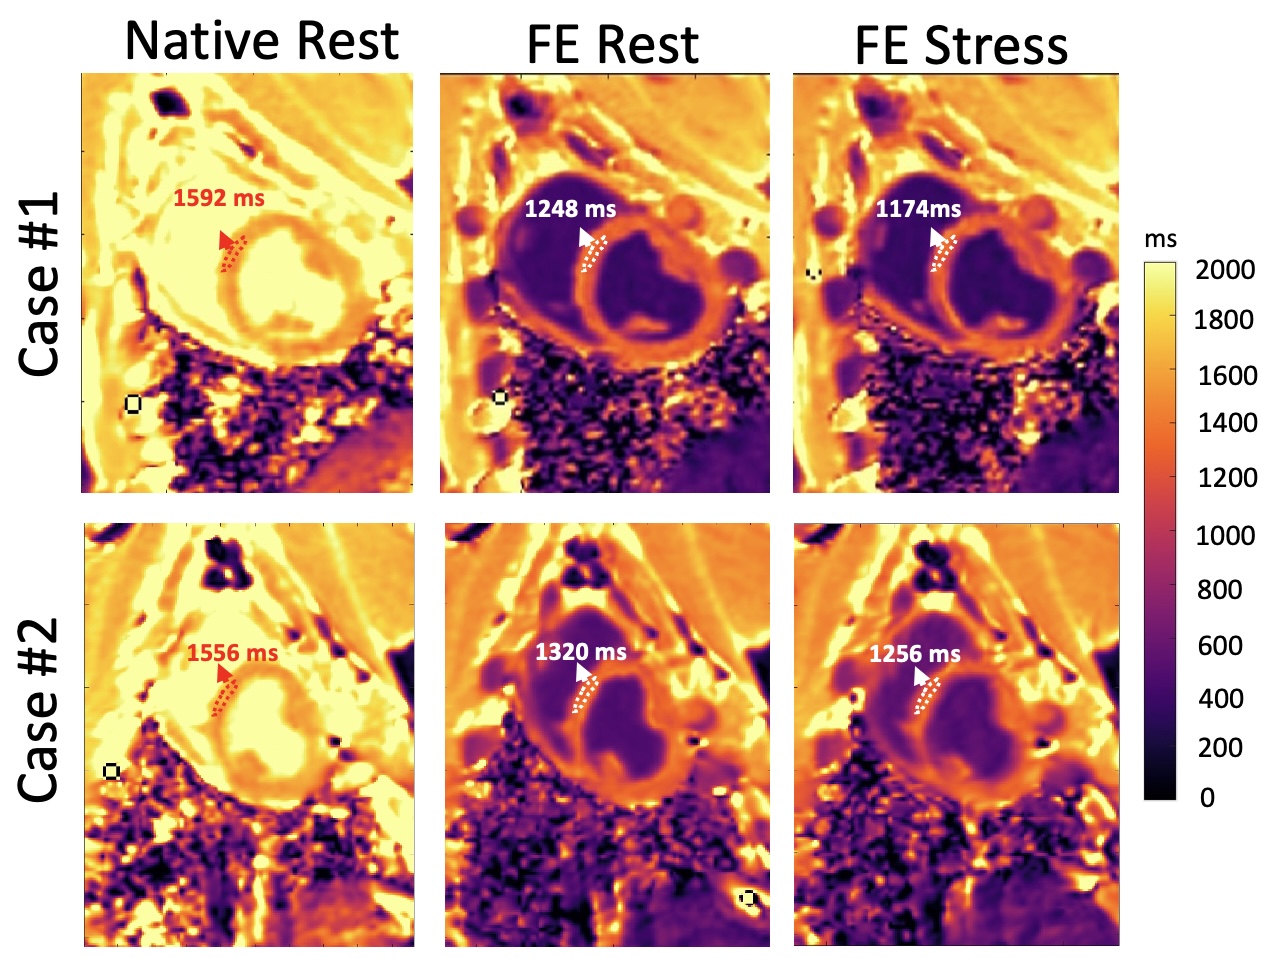
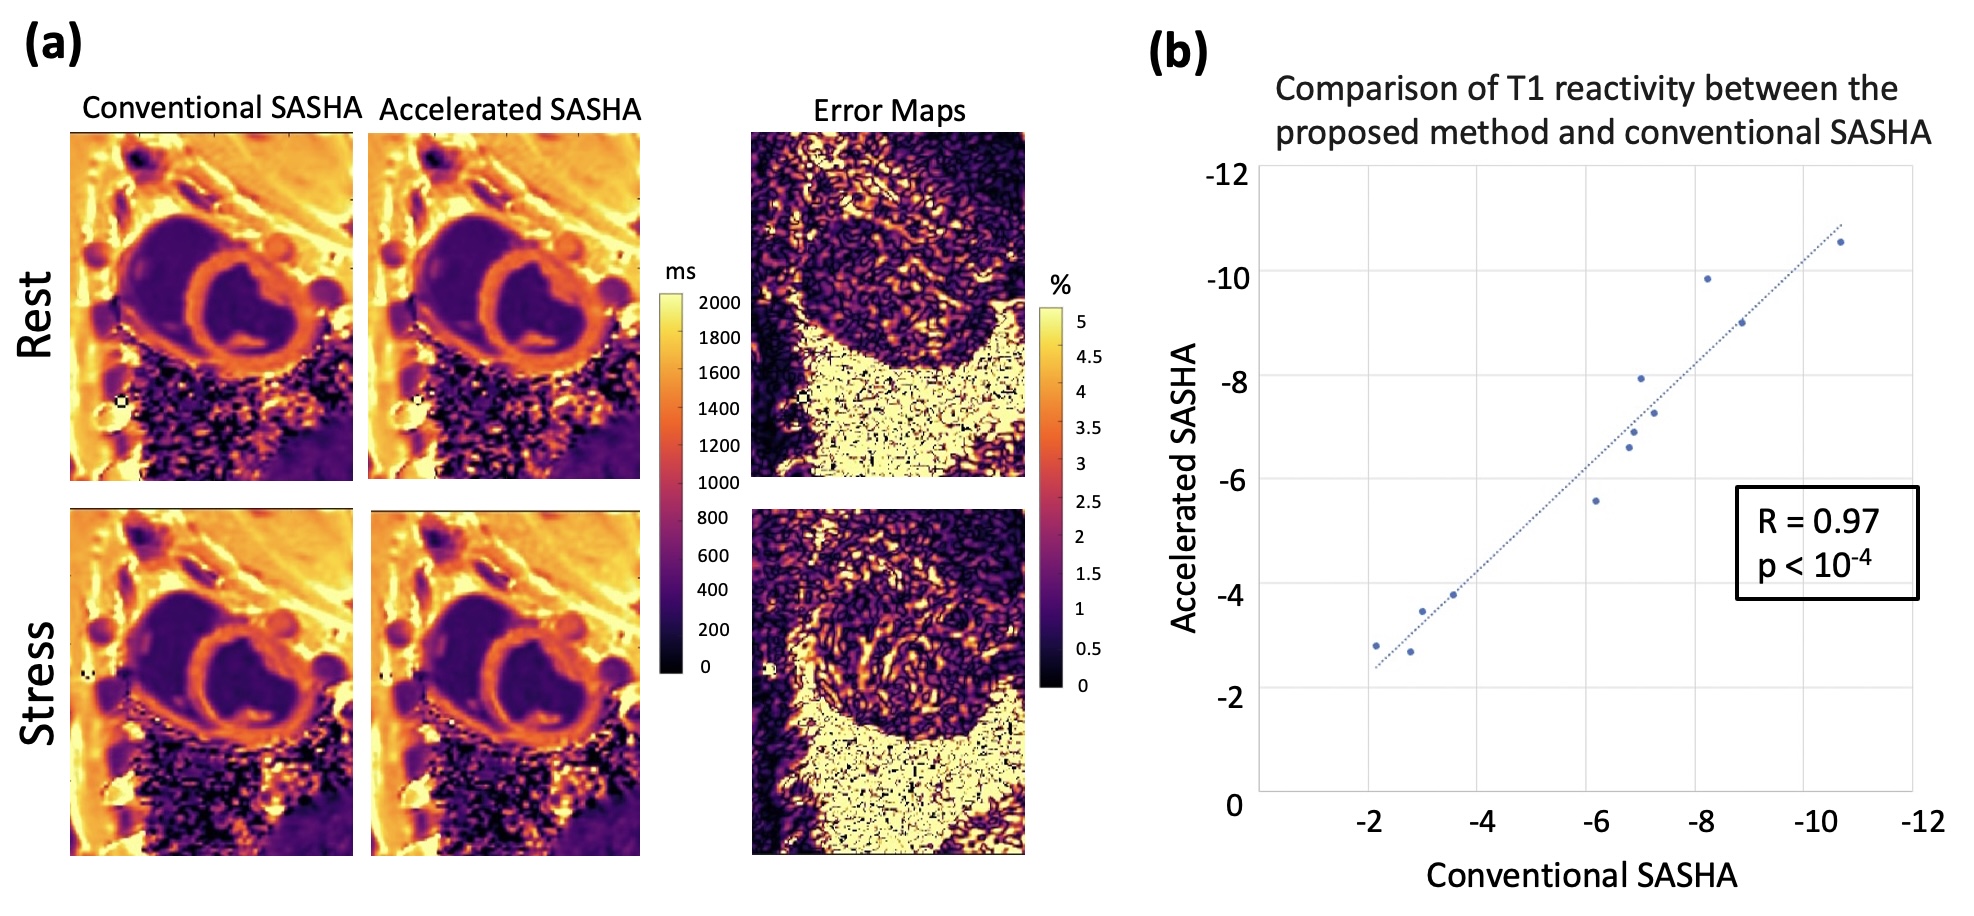
The FE phantom experiments showed that, to achieve CoV < 1%, we need a minimum of N=5 (Fig 1b), implying a 2-fold acceleration compared to conventional SASHA (which uses N=10). Fig 2 shows example SASHA T1 maps for native rest and FE rest/stress scans in 2 representative animals. As highlighted with arrows, FE stress T1 values are lower than FE rest indicating increased intravascular space (higher myocardial blood volume) during dobutamine stress. Fig 3 compares the 2-fold accelerated SASHA maps vs. conventional SASHA in terms of rest/stress T1 maps in (a) and T1 reactivities in (b). Both the error maps in Fig 3(a) and the correlation plot in Fig 3(b) show excellent agreement: Average T1 reactivities for 2-fold accelerated SASHA vs. conventional SASHA were -6.13% 2.57% vs. -6.34% 2.61% with no significant difference and the correlation coefficient was R = 0.97 with p < 10^-4.Discussion
The phantom studies demonstrated that the number of T1-weighted images needed for an accurate SASHA T1 mapping can be reduced significantly by keeping the CoV within 1%. Although the accelerated SASHA T1 maps under stress had higher error especially in bloodpool borders (up to 5%), the resulting T1 reactivity agreement between conventional SASHA and accelerated SASHA were less affected by this because of averaging pixel-wise T1 reactivities inside myocardial ROIs. In addition, note that the T1 reactivities had a wide range of values for both conventional SASHA and accelerated SASHA techniques (Fig 3b). Although the diagnostic accuracy of accelerated SASHA T1 reactivity was beyond the scope of this work, future studies may better analyze the effect of variation in T1 reactivity.Conclusion
In this work, we showed the feasibility of accelerating SASHA T1 mapping in FE rest/stress T1 reactivity studies under dobutamine stress. Our initial results suggest that, in FE stress studies, the scan time can be accelerated without a noticeable deterioration in the accuracy of derived T1 maps or T1 reactivity values when compared to conventional SASHA. A 2-fold acceleration has the potential to improve the feasibility of SASHA-based T1 reactivity studies under dobutamine/exercise stress in a clinical setting.Acknowledgements
No acknowledgement found.References
1. Chow K, Flewitt JA, Green JD, Pagano JJ, Friedrich MG, Thompson RB. Saturation recovery single-shot acquisition (SASHA) for myocardial T(1) mapping. Magn Reson Med 2014;71:2082-2095. doi: 10.1002/mrm.24878
2. Messroghli DR, Radjenovic A, Kozerke S, Higgins DM, Sivananthan MU, Ridgway JP. Modified Look-Locker inversion recovery (MOLLI) for high-resolution T1 mapping of the heart. Magn Reson Med 2004;52:141-146. doi: 10.1002/mrm.20110
3. Xanthis CG, Bidhult S, Greiser A, Chow K, Thompson RB, Arheden H, Aletras AH. Simulation-based quantification of native T1 and T2 of the myocardium using a modified MOLLI scheme and the importance of Magnetization Transfer. Magn Reson Imaging. 2018;48:96-106. doi: 10.1016/j.mri.2017.12.020
4. Nordio G, Bustin A, Odille F, Schneider T, Henningsson M, Prieto C, Botnar RM. Faster 3D saturation-recovery based myocardial T1 mapping using a reduced number of saturation points and denoising. PLoS One 2020;15:e0221071. doi: 10.1371/journal.pone.0221071
5. Colbert CM, Le AH, Shao J, Currier JW, Ajijola OA, Hu P, Nguyen KL. Ferumoxytol-enhanced magnetic resonance T1 reactivity for depiction of myocardial hypoperfusion. NMR Biomed 2021;34:e4518. doi: 10.1002/nbm.4518
6. Kellman P, Xue H, Chow K, Spottiswoode BS, Arai AE, Thompson RB. Optimized saturation recovery protocols for T1-mapping in the heart: influence of sampling strategies on precision. JCMR 2014;16:55. doi: 10.1186/s12968-014-0055-3
Figures