3995
T2*BOLD for evaluating coronary arteries with hemodynamic changes in stable multivessel coronary artery disease1Renji Hospital, Shanghai, China, 2Philips Healthcare, Shanghai, China
Synopsis
Keywords: Vessels, Cardiovascular, T2*-mapping
This study used T2*BOLD and QFR to evaluate coronary arteries with hemodynamic changes in coronary artery disease. Fifty patients with at least 1 significant coronary artery stenosis (diameter stenosis >50%) and 21 healthy control subjects underwent coronary angiography combined with QFR measurements and CMR. The CMR protocol consisted of T2* mapping and resting perfusion, contrasted with QFR. QFR≤0.80 was considered to indicate the presence of hemodynamic obstruction. Our study revealed that T2* BOLD and QFR have good agreement in detecting hemodynamic changes of stenotic coronary arteries. T2* BOLD is superior to semiquantitative perfusion imaging in analyzing myocardial perfusion without stress.Introduction
Coronary artery disease (CAD) is the main cause of disability and death worldwide1. Despite important advances in developing tools to decrease CAD mortality rates, including percutaneous coronary intervention (PCI) 2and coronary artery bypass grafting (CABG), CAD remains the most common cause of death in the United States and the European Union.Quantitative flow ratio (QFR) is a new tool for assessing coronary blood flow based on invasive coronary angiography (ICA)3,4. At the same time, the diagnostic accuracy of QFR is also high compared with those of other indices of invasive functional assessment in coronary artery stenosis5, indicating that QFR is a good diagnostic index in the clinical guidance of CAD. QFR can guide revascularization in patients with CAD. The incidence of MACE is significantly lower after QFR-guided revascularization compared with angiography-guided revascularization6,7.
CMR is a good non-invasive method that is particularly prominent in the evaluation of myocardial ischemia in CAD8,9, which includes full quantitative perfusion, semiquantitative perfusion, and blood oxygen level-dependent (BOLD) sequence10.Full quantitative perfusion and semiquantitative perfusion work well for assessing myocardial ischemia, but many studies were based on adenosine stress11,12. In the clinical assessment of CAD, one of the ideal goals is to identify functionally obvious angiographic stenosis without relying on physical or pharmacological stress, which is currently unaddressed13. The BOLD sequence is based on deoxyhemoglobin content in the myocardium to reflect the state of myocardial oxygenation. T2*mapping and T2*-weighted imaging have been used as the BOLD technology to assess myocardial oxygenation14,15, which could assist in diagnosing CAD without adenosine16,17.
We hypothesized that T2*BOLD without adenosine stress could improve the detection of coronary arteries with hemodynamic change (QFR≤0.8) and increase the diagnostic accuracy of CMR in multivessel coronary artery disease (MVCAD).
Methods
Fifty patients with multivessel CAD with at least 1 significant coronary artery stenosis (diameter stenosis >50%) and 21 healthy control subjects underwent coronary angiography combined with QFR measurements and CMR. The CMR protocol consisted of cine imaging, late gadolinium enhancement, T1 mapping, T2* mapping, and resting perfusion, contrasted with QFR. QFR≤0.80 was considered to indicate the presence of hemodynamic obstruction.Results
Totally 60 (54%) obstructive vessels had hemodynamic lesions. Between the obstructive coronary arteries (QFR≤0.8) and normal vessels, T2*BOLD showed AUCs of 0.97, 0.69, and 0.91 for left anterior descending (LAD), left circumflex (LCX) and right coronary (RCA) arteries, respectively, and PI displayed AUCs of 0.89, 0.77 and 0.90 (all p>0.05, except for LAD). The AUCs of T2*BOLD between the stenotic coronary arteries (QFR>0.8) and normal vessels were 0.86, 0.72, and 0.85 for LAD, LCX and RCA, respectively, and PI showed AUCs of 0.93, 0.86, and 0.88 for LAD, LCX and RCA (p>0.05). Moreover, T2*BOLD displayed AUCs of 0.96, 0.74, and 0.91 for coronary arteries as before between coronary arteries with stenosis (QFR≤0.8 and>0.8), but the mean PI of LAD, LCX, and RCA showed no significant differences between the vessels.Discussion
FFR is currently the gold standard for assessing hemodynamic changes in coronary arteries2. It is worth noting that current researches about QFR are very hot, especially for pre-PCI diagnosis and postoperative evaluation of QFR, which could accurately reflect the prognosis stratification of patients21,22,23. Other studies pointed out that QFR and FFR have a high degree of agreement in diagnosing coronary stenosis (sensitivity, 90%; specificity, 82%; diagnostic accuracy, 85%)5, 24. Therefore, we chose QFR as the diagnostic criterion to assess potential changes of hemodynamics in stenotic coronary arteries and to evaluate the diagnostic performance of T2* BOLD.Some studies have pointed out that fully quantitative perfusion and semi-quantitative perfusion CMR are in good agreement with FFR for the diagnosis of non-culprit lesions in STEMI10, 25. Meanwhile, it was reported that under adenosine stress, stress MBF measured by full quantitative perfusion and semi-quantitative perfusion is better than stress BOLD, resting BOLD, and resting MBF, and the diagnostic performance of stress BOLD is equivalent with resting BOLD26, 27; in addition, the diagnostic performance of BOLD was superior to that of MBF without the use of adenosine for stress28. The evaluation performance of T2* BOLD on ischemic myocardium is 2.5 times that of T2-BOLD29, 30. Therefore, we chose T2* BOLD and QFR to evaluate coronary stenosis in patients with stable CAD.
According to our findings, T2* BOLD and QFR have obvious consistency in diagnosing stenotic coronary arteries with hemodynamic changes, except for the myocardial area of LCX. This may be related to artifacts generated during image acquisition. In CMR images acquired with the longest echo time, artifacts are likely to appear in the inferolateral segment of the myocardium, which is mainly interfered with by the heart-lung interface and cardiac veins16. For the poor agreement between T2* BOLD and semi-quantitative analysis of myocardial perfusion with hemodynamic changes, we considered that the images acquired only included the resting condition, and semiquantitative PI cannot fully reflect myocardial perfusion.
Conclusion
T2* BOLD and QFR have good agreement in detecting hemodynamic changes of stenotic coronary arteries in patients with stable multivessel CAD. T2* BOLD is superior to semiquantitative perfusion imaging in analyzing myocardial perfusion without stress.Acknowledgements
No acknowledgement found.References
1. Nichols, M., et al., Cardiovascular disease in Europe: epidemiological update. European heart journal, 2013. 34(39): p. 3028-34.
2. Neumann, F., et al., 2018 ESC/EACTS Guidelines on myocardial revascularization. EuroIntervention : journal of EuroPCR in collaboration with the Working Group on Interventional Cardiology of the European Society of Cardiology, 2019. 14(14): p. 1435-1534.
3. Westra, J., et al., Evaluation of Coronary Artery Stenosis by Quantitative Flow Ratio During Invasive Coronary Angiography: The WIFI II Study (Wire-Free Functional Imaging II). Circ Cardiovasc Imaging, 2018. 11(3): p. e007107.
4. Kirigaya, H., et al., Diagnostic performance and limitation of quantitative flow ratio for functional assessment of intermediate coronary stenosis. Journal of cardiology, 2021. 77(5): p. 492-499.
5. Tanigaki, T., et al., QFR Versus FFR Derived From Computed Tomography for Functional Assessment of Coronary Artery Stenosis. JACC. Cardiovascular interventions, 2019. 12(20): p. 2050-2059.
6. Song L, X.B., Tu S, Guan C, Jin Z, Yu B, Fu G, Zhou Y, Wang J'aJ’a, Chen Y,Pu J, Chen L, Qu X, Yang J, Liu X, Guo L, Shen C, Zhang Y, Zhang Q, Pan H, Zhang R, Liu J, Zhao Y, Wang Y, Dou K, Kirtane AJ, Wu Y, Wijns W, Yang W, Leon MB, Qiao S, Stone GW, Angiographic Quantitative Flow Ratio-Guided Coronary Intervention: Two-Year Outcomes of the FAVOR III China Trial, Journal of the American College of Cardiology. JACC Journals, 2022.
7. Xu, B., et al., Angiographic quantitative flow ratio-guided coronary intervention (FAVOR III China): a multicentre, randomised, sham-controlled trial. Lancet (London, England), 2021. 398(10317): p. 2149-2159.
8. Foley, J.R., S. Plein, and J.P. Greenwood, Assessment of stable coronary artery disease by cardiovascular magnetic resonance imaging: Current and emerging techniques. World J Cardiol, 2017. 9(2): p. 92-108.
9. Bazoukis, G., et al., Contemporary Role of Cardiac Magnetic Resonance in the Management of Patients with Suspected or Known Coronary Artery Disease. Medicina (Kaunas), 2021. 57(7).
10. Everaars, H., et al., Cardiac Magnetic Resonance for Evaluating Nonculprit Lesions After Myocardial Infarction: Comparison With Fractional Flow Reserve. JACC. Cardiovascular imaging, 2020. 13(3): p. 715-728.
11. Sharrack, N., et al., How to do quantitative myocardial perfusion cardiovascular magnetic resonance. Eur Heart J Cardiovasc Imaging, 2022. 23(3): p. 315-318.
12. Franks, R., S. Plein, and A. Chiribiri, Clinical Application of Dynamic Contrast Enhanced Perfusion Imaging by Cardiovascular Magnetic Resonance. Front Cardiovasc Med, 2021. 8: p. 768563.
13. J. Ranjit Arnold, M.J.-H., Theodoros D. Karamitsos, Jane M. Francis, Paul Bhamra-Ariza, Rizwan Sarwar, Robin Choudhury, Joseph B. Selvanayagam, Stefan Neubauer, Detection of Coronary Stenosis at Rest Using BOLD-CMR. JACC: Cardiovascular Imaging, 2017. 10(5): p. 600-601.
14. van den Boomen, M., et al., Blood Oxygen Level-Dependent MRI of the Myocardium with Multiecho Gradient-Echo Spin-Echo Imaging. Radiology, 2020. 294(3): p. 538-545.
15. Yang, H.J., et al., Heart Rate-Independent 3D Myocardial Blood Oxygen Level-Dependent MRI at 3.0 T with Simultaneous (13)N-Ammonia PET Validation. Radiology, 2020. 295(1): p. 82-93.
16. Chen, B., et al., BOLD cardiac MRI for differentiating reversible and irreversible myocardial damage in ST segment elevation myocardial infarction. European radiology, 2019. 29(2): p. 951-962.
17. Triadyaksa, P., M. Oudkerk, and P.E. Sijens, Cardiac T2 * mapping: Techniques and clinical applications. J Magn Reson Imaging, 2020. 52(5): p. 1340-1351.
18. Huelnhagen, T., et al., Myocardial effective transverse relaxation time T2* Correlates with left ventricular wall thickness: A 7.0 T MRI study. Magnetic resonance in medicine, 2017. 77(6): p. 2381-2389.
19. Donato, P., et al., Correspondence between left ventricular 17 myocardial segments and coronary anatomy obtained by multi-detector computed tomography: an ex vivo contribution. Surg Radiol Anat, 2012. 34(9): p. 805-10.
20. Ortiz-Perez, J.T., et al., Correspondence between the 17-segment model and coronary arterial anatomy using contrast-enhanced cardiac magnetic resonance imaging. JACC Cardiovasc Imaging, 2008. 1(3): p. 282-93.
21. Dai, N., et al., Prognostic Implications of Quantitative Flow Ratio-Derived Physiological 2-Dimensional Residual Disease Patterns After Stenting. JACC. Cardiovascular interventions, 2022. 15(16): p. 1624-1634.
22. Dettori, R., et al., Quantitative Flow Ratio Is Associated with Extent and Severity of Ischemia in Non-Culprit Lesions of Patients with Myocardial Infarction. J Clin Med, 2021. 10(19).
23. Milzi, A., et al., Quantitative flow ratio (QFR) identifies functional relevance of non-culprit lesions in coronary angiographies of patients with acute myocardial infarction. Clin Res Cardiol, 2021. 110(10): p. 1659-1667.
24. Sejr-Hansen, M., et al., Comparison of quantitative flow ratio and fractional flow reserve with myocardial perfusion scintigraphy and cardiovascular magnetic resonance as reference standard. A Dan-NICAD substudy. Int J Cardiovasc Imaging, 2020. 36(3): p. 395-402.
25. Danad, I., et al., Diagnostic performance of cardiac imaging methods to diagnose ischaemia-causing coronary artery disease when directly compared with fractional flow reserve as a reference standard: a meta-analysis. European heart journal, 2017. 38(13): p. 991-998.
26. Seraphim, A., et al., Quantitative Myocardial Perfusion Predicts Outcomes in Patients With Prior Surgical Revascularization. J Am Coll Cardiol, 2022. 79(12): p. 1141-1151.
27. Brown, L.A.E., et al., Fully automated, inline quantification of myocardial blood flow with cardiovascular magnetic resonance: repeatability of measurements in healthy subjects. J Cardiovasc Magn Reson, 2018. 20(1): p. 48.
28. Arnold, J., et al., Detection of Coronary Stenosis at Rest Using BOLD-CMR. JACC. Cardiovascular imaging, 2017. 10(5): p. 600-601.
29. Friedrich, M. and T. Karamitsos, Oxygenation-sensitive cardiovascular magnetic resonance. Journal of cardiovascular magnetic resonance : official journal of the Society for Cardiovascular Magnetic Resonance, 2013. 15: p. 43.
30. Walcher, T., et al., Myocardial perfusion reserve assessed by T2-prepared steady-state free precession blood oxygen level-dependent magnetic resonance imaging in comparison to fractional flow reserve. Circulation. Cardiovascular imaging, 2012. 5(5): p. 580-6.
Figures
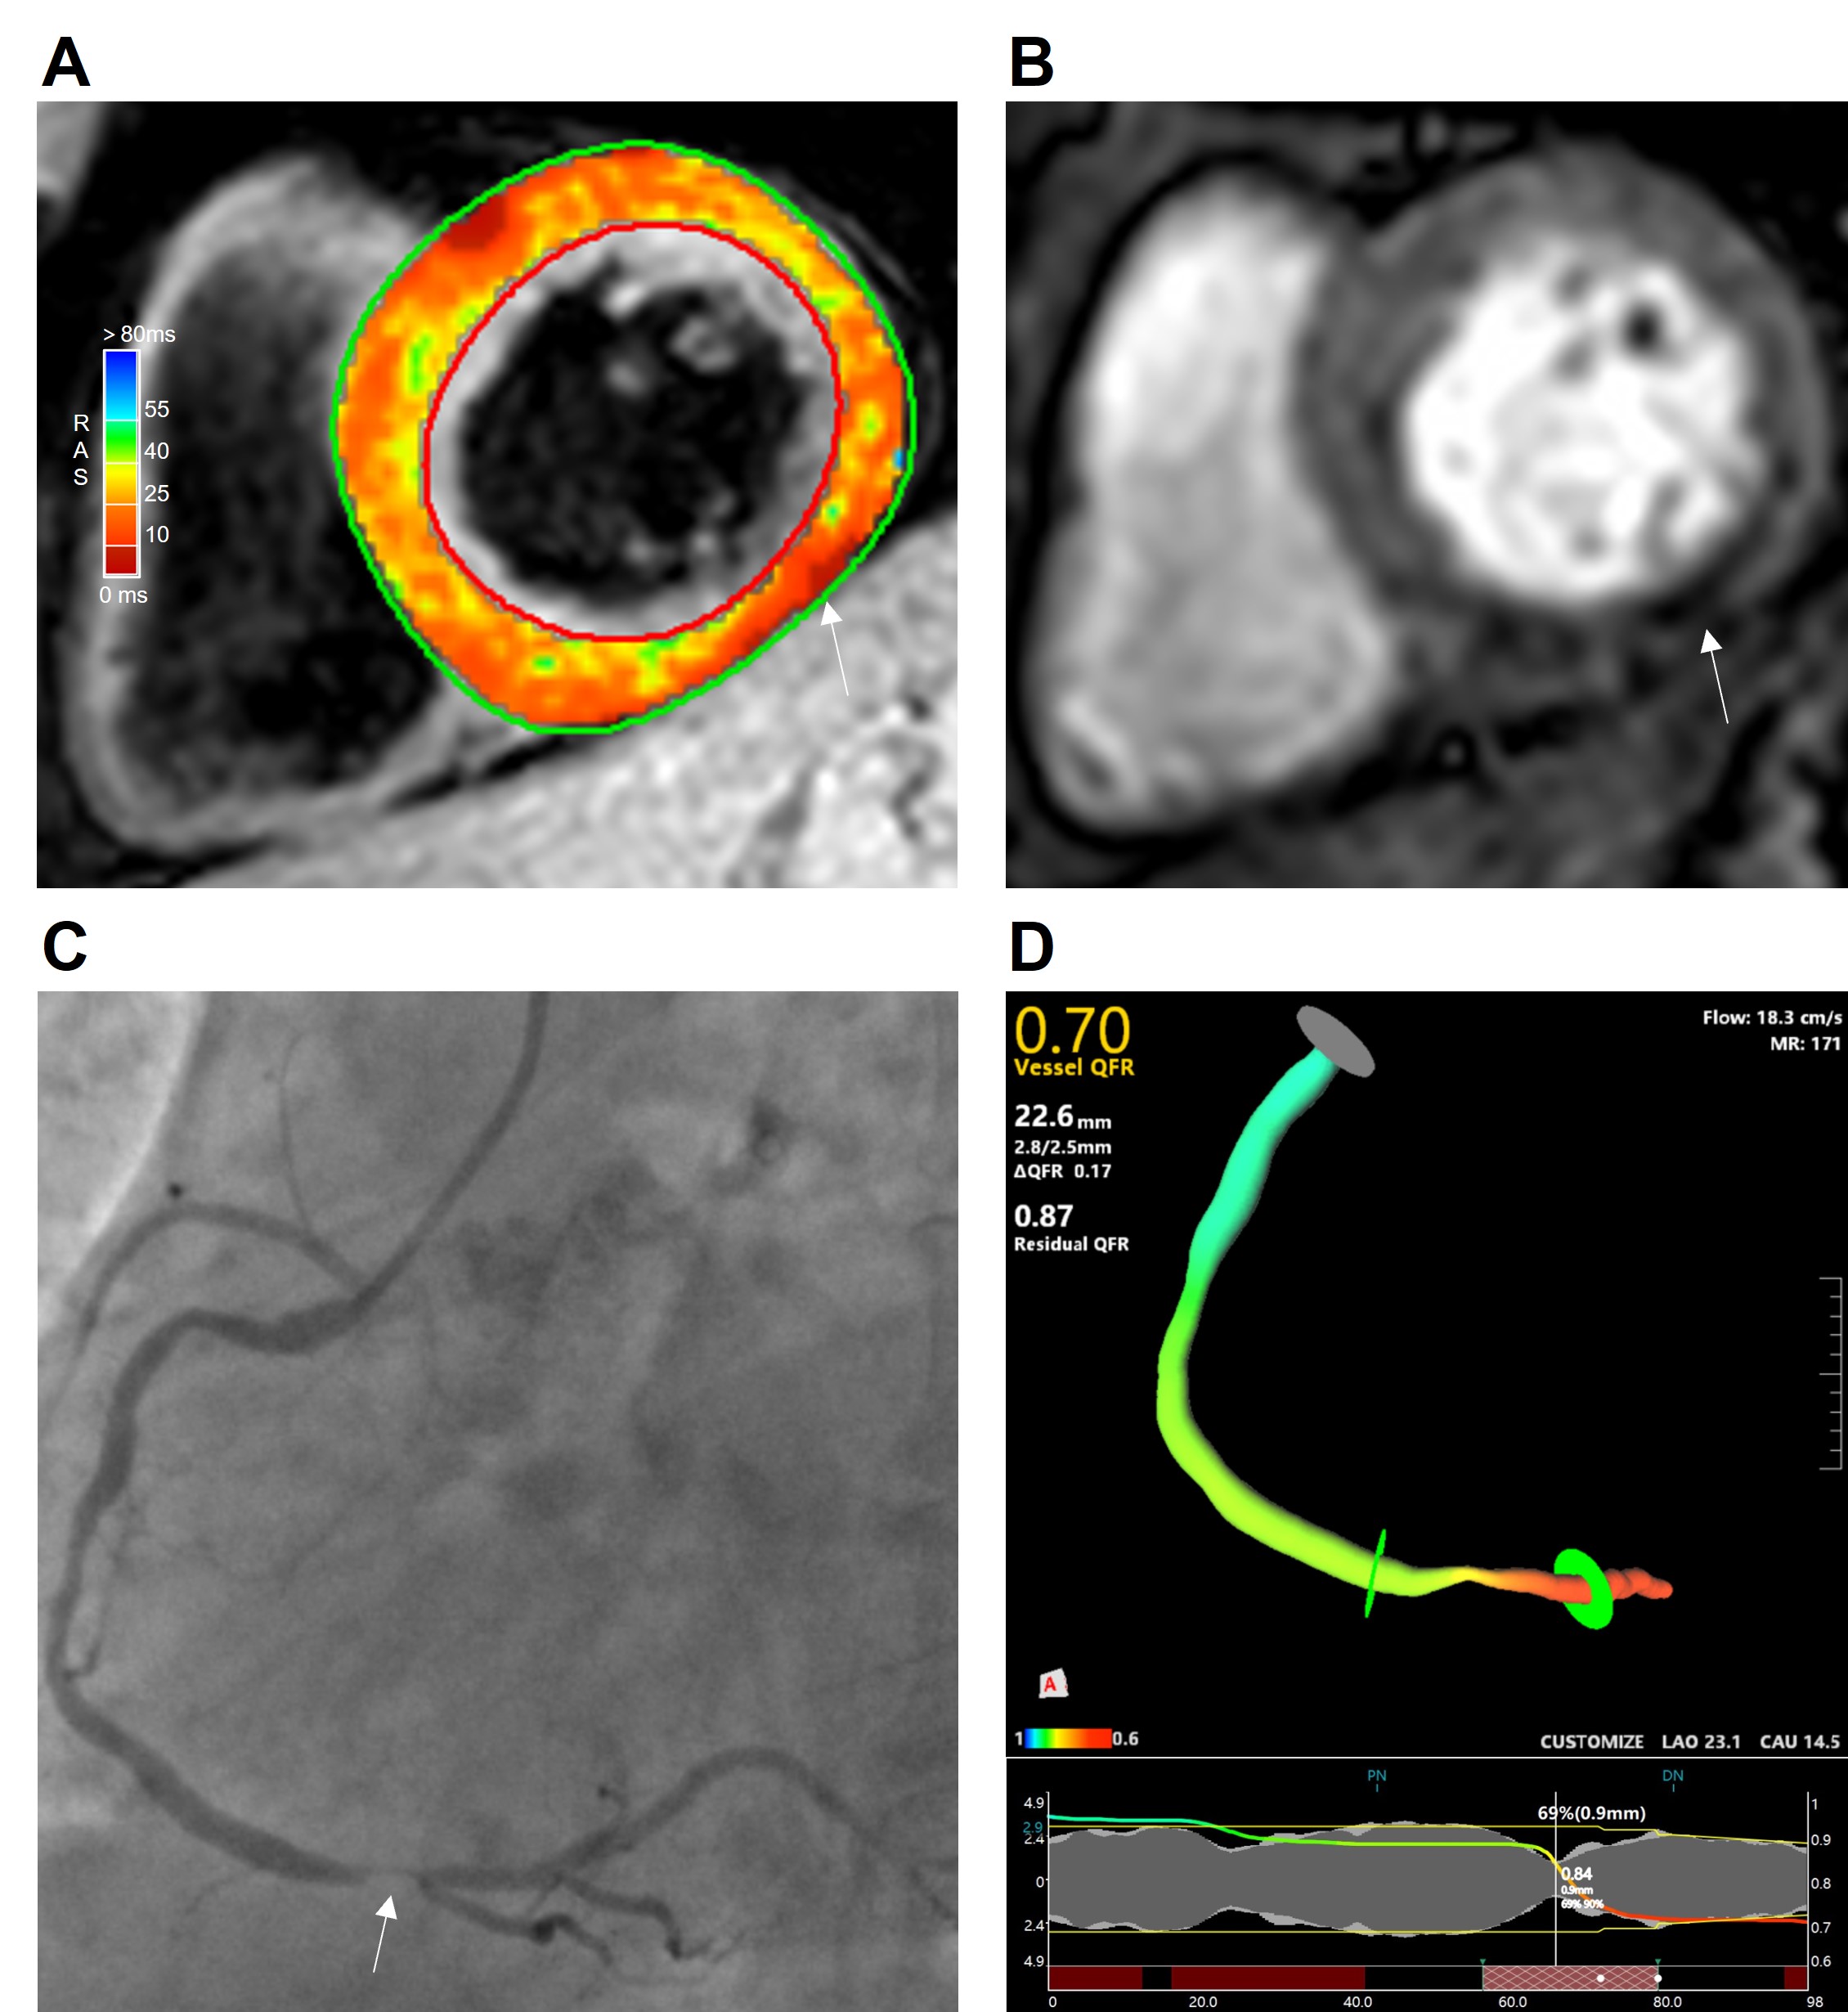
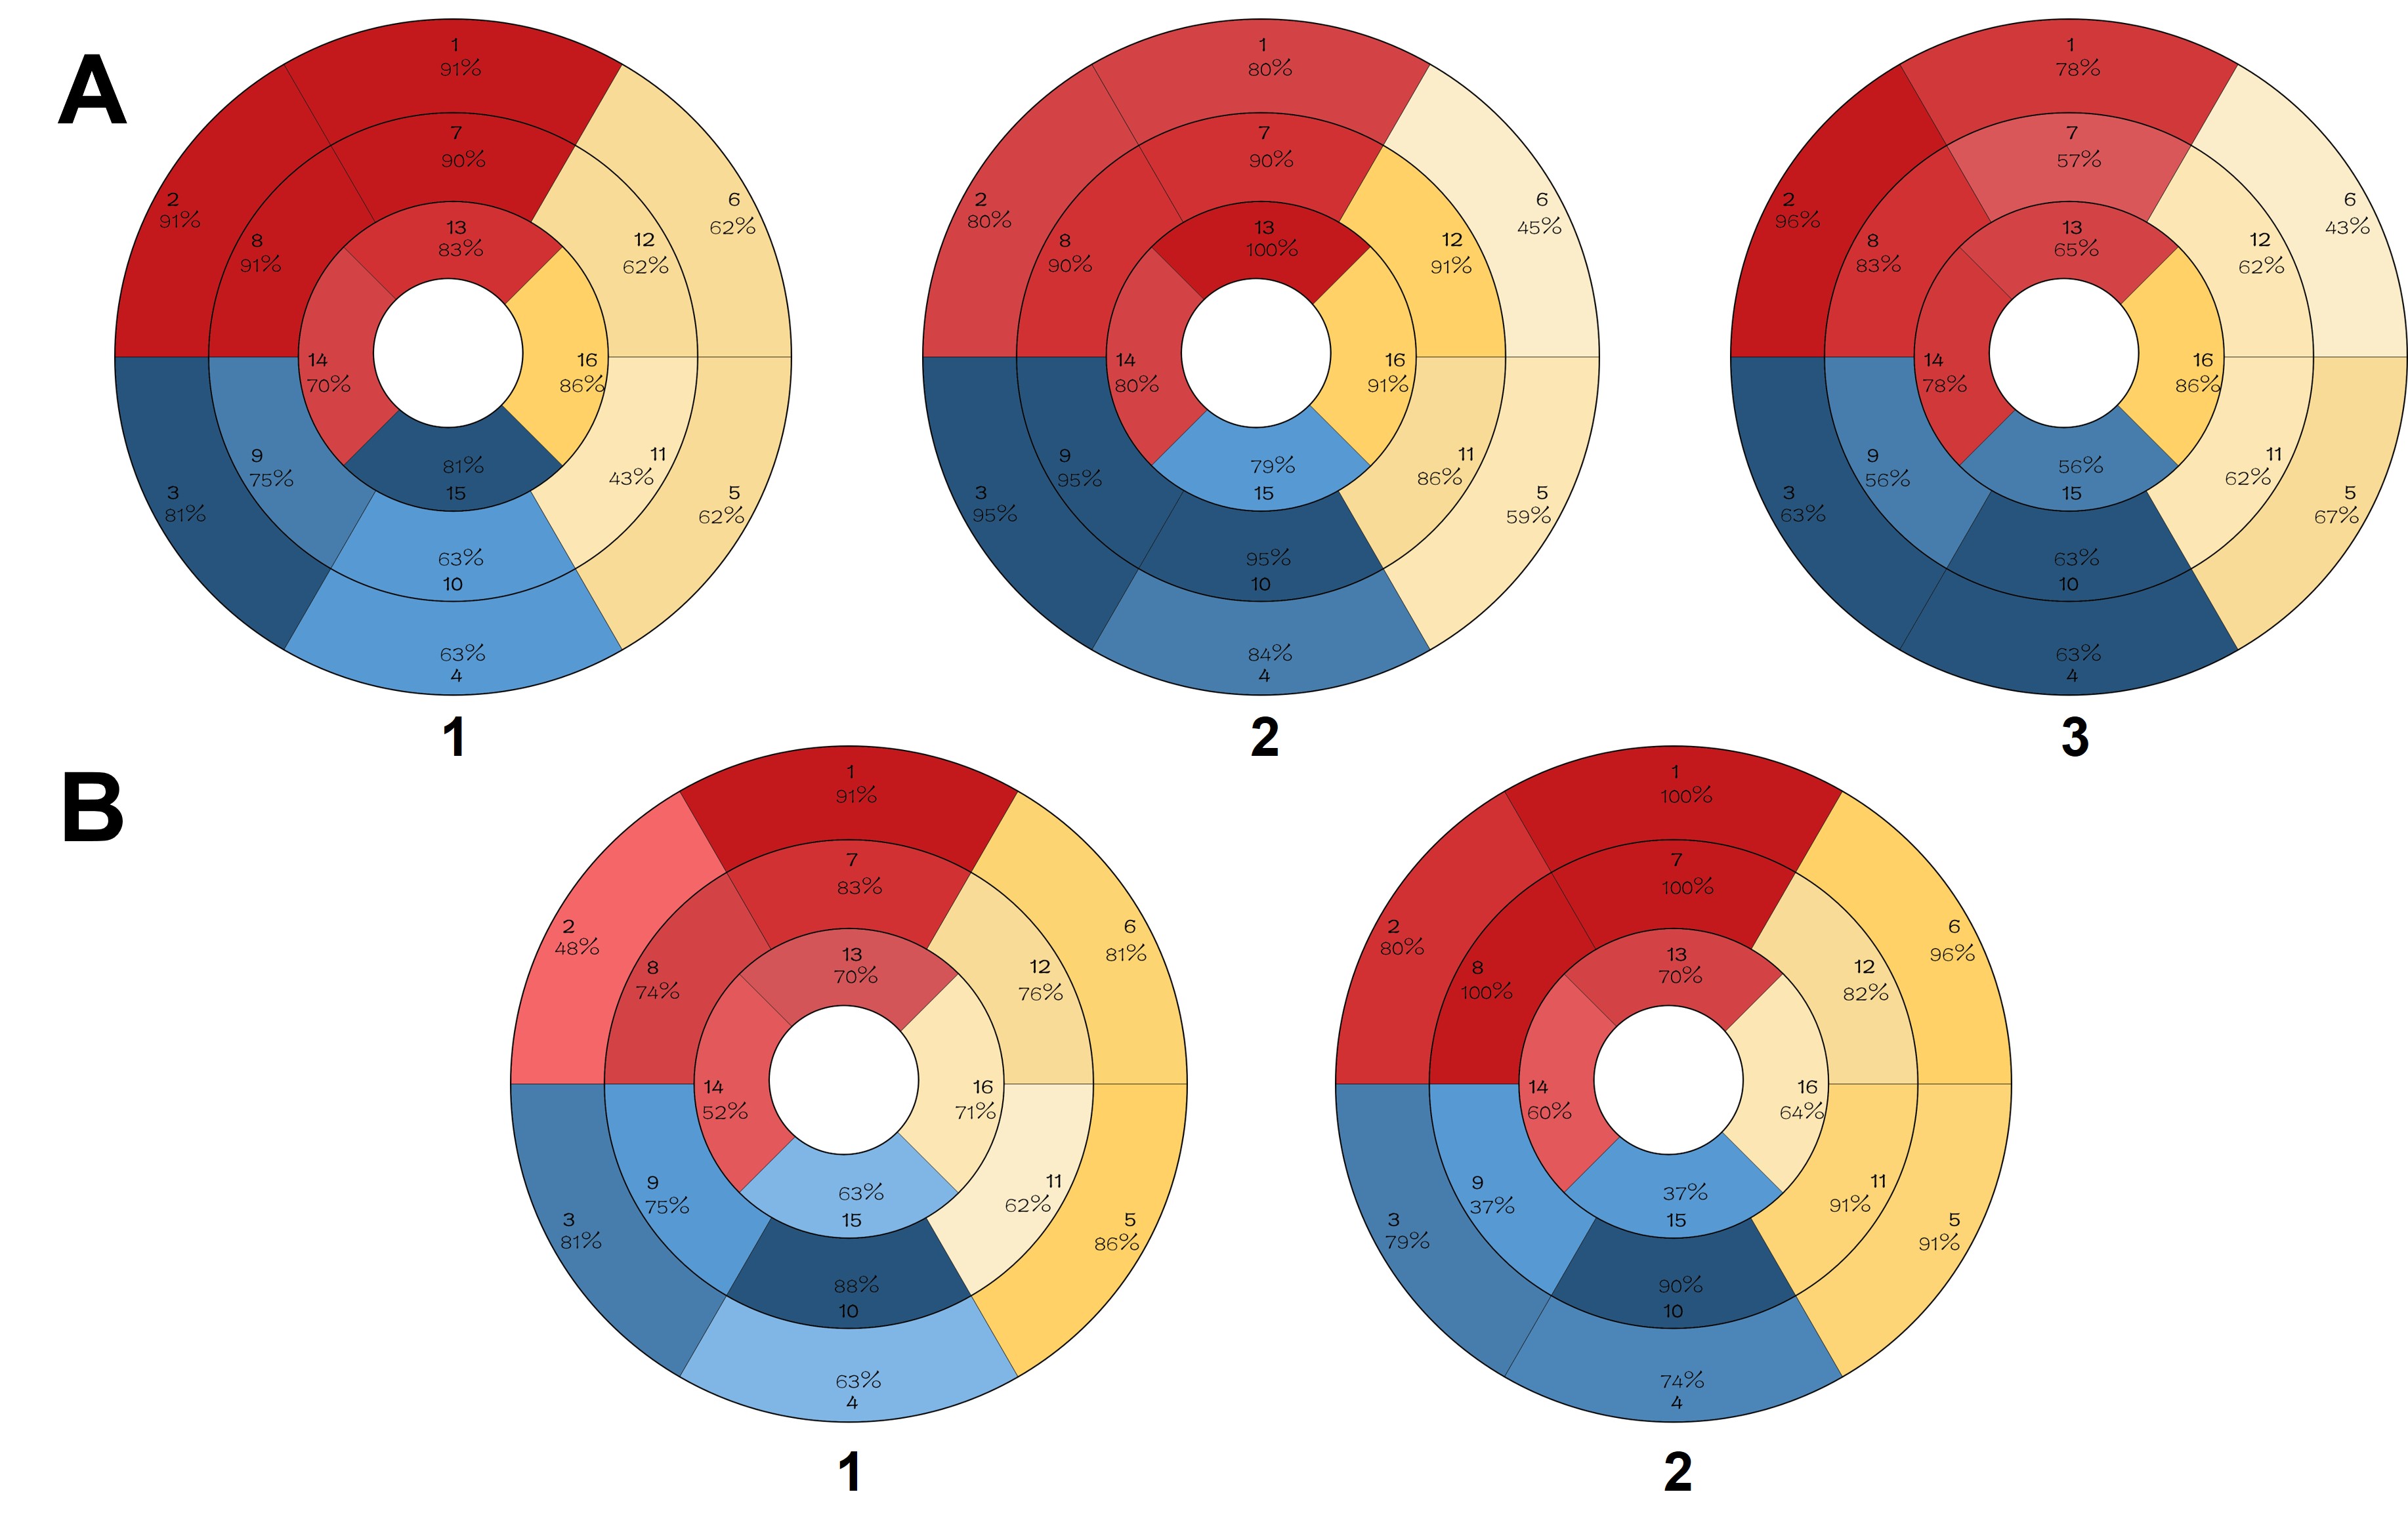
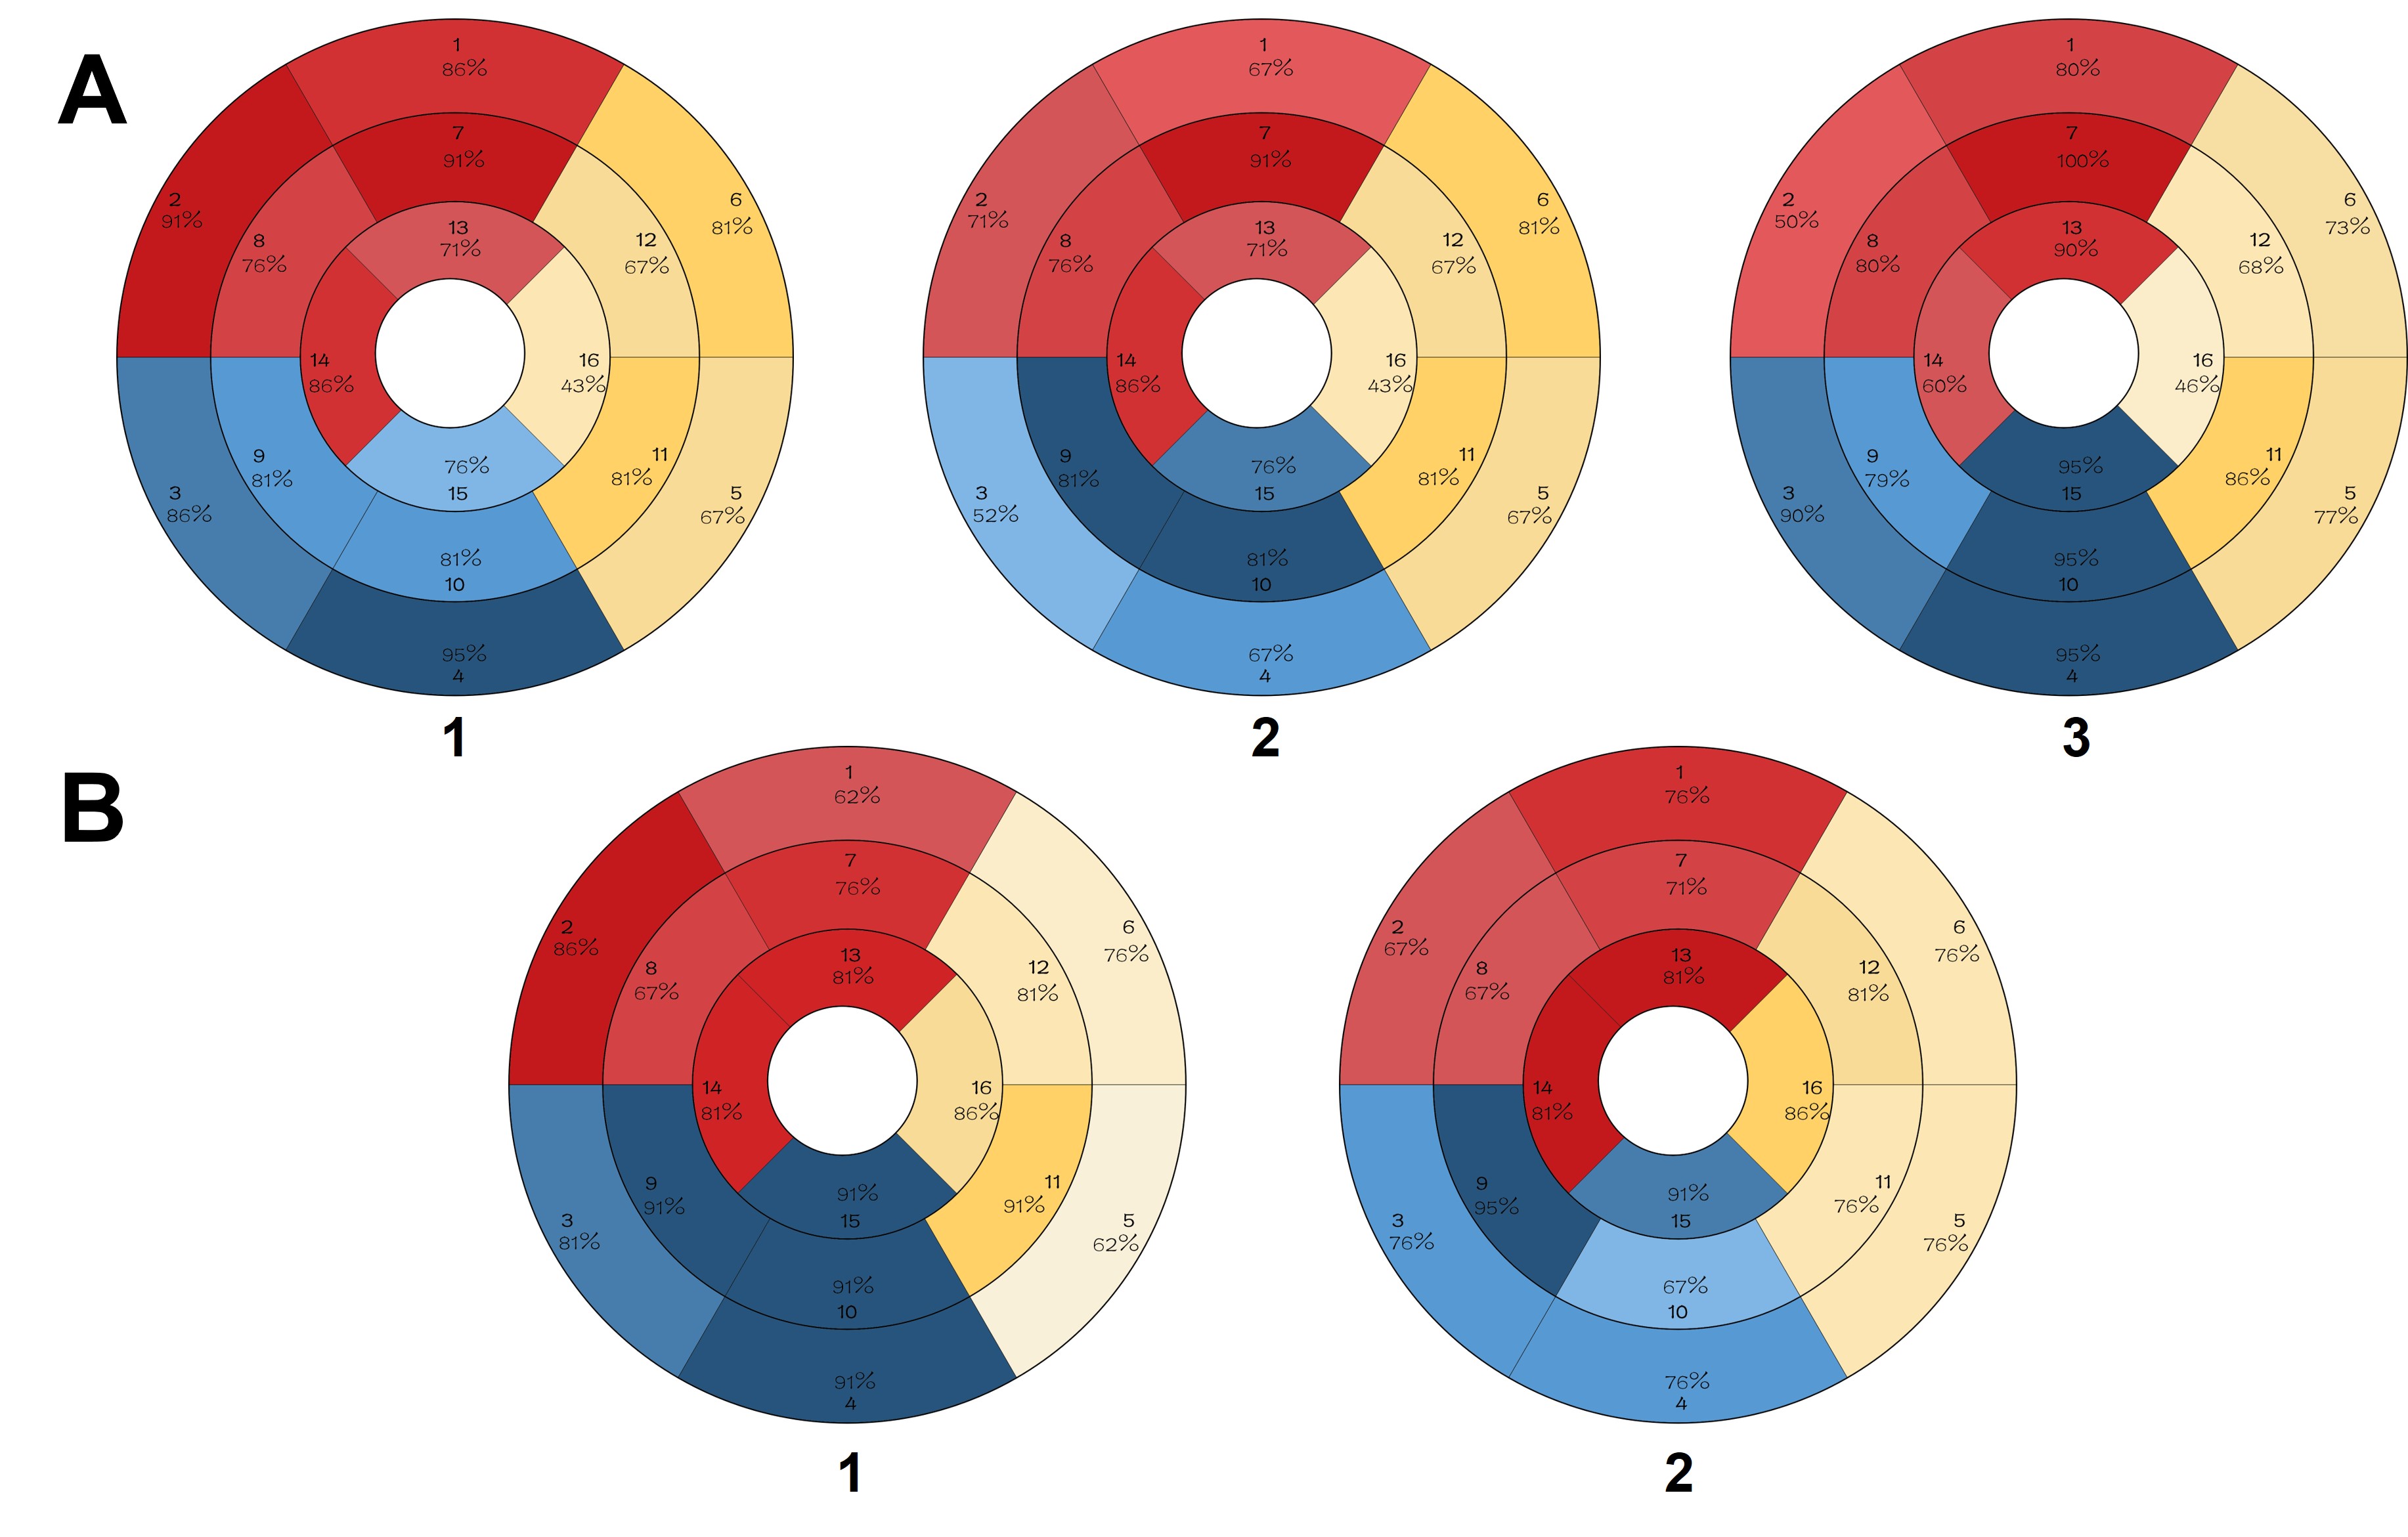
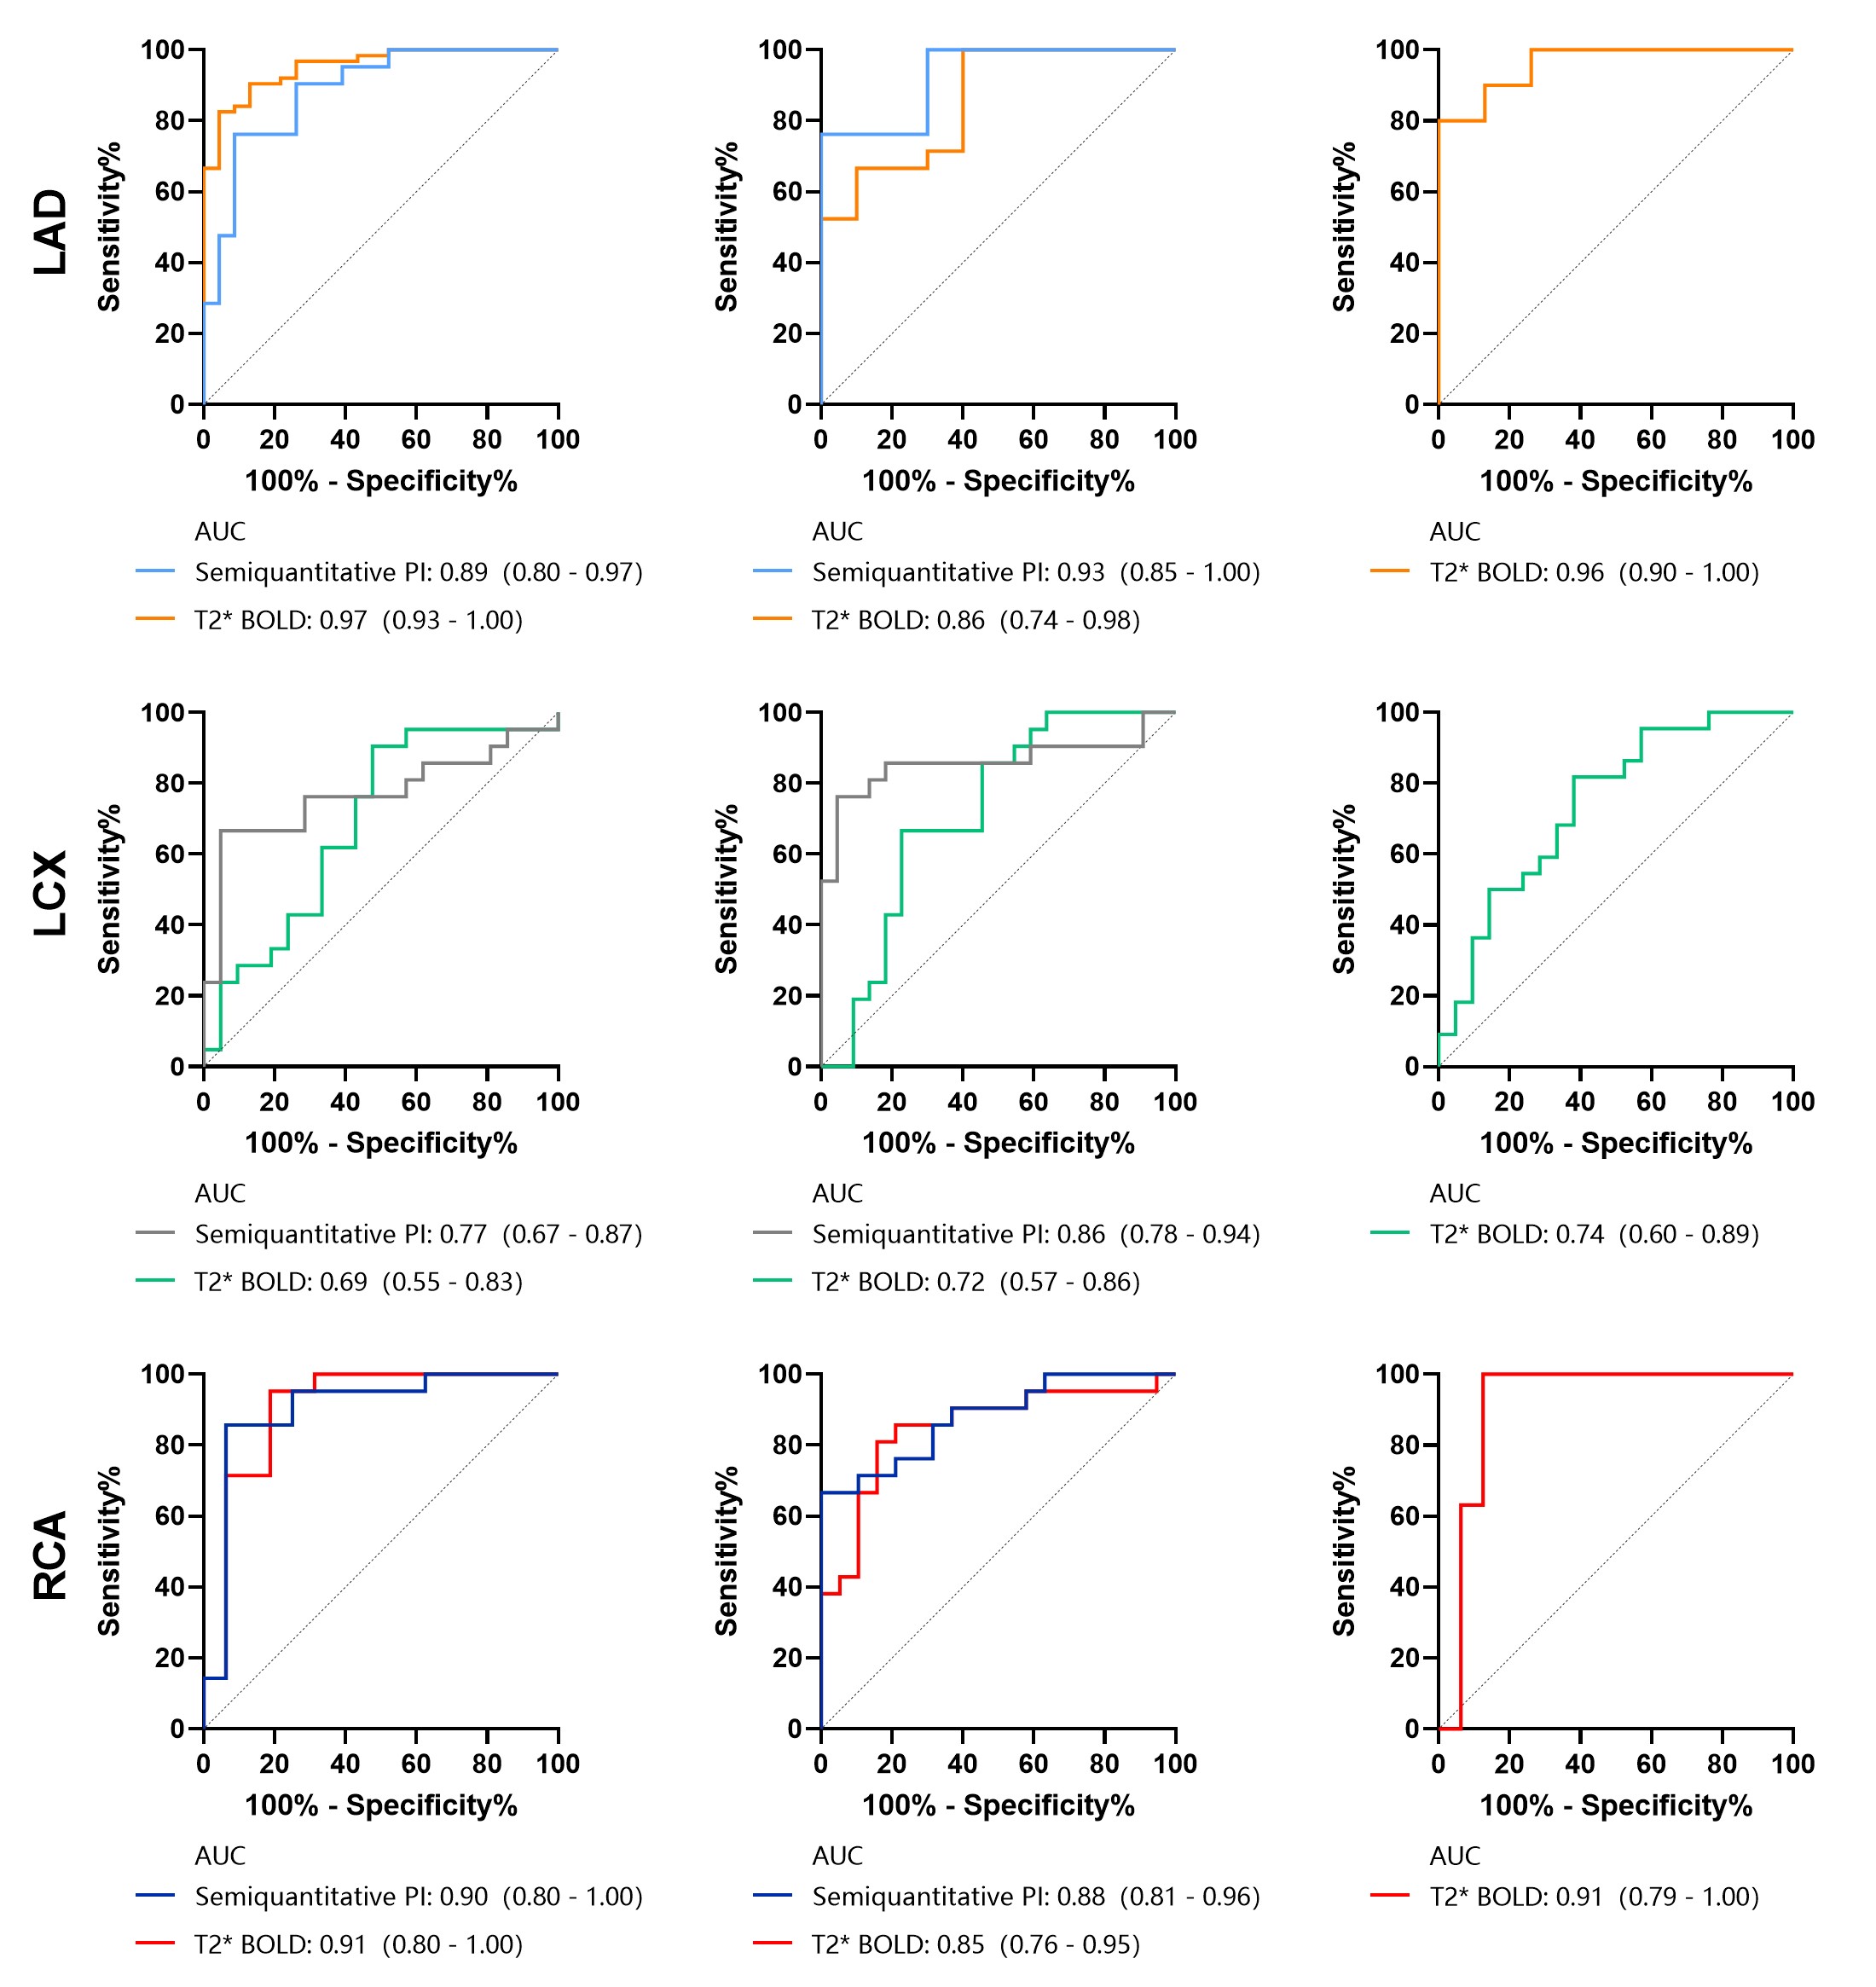
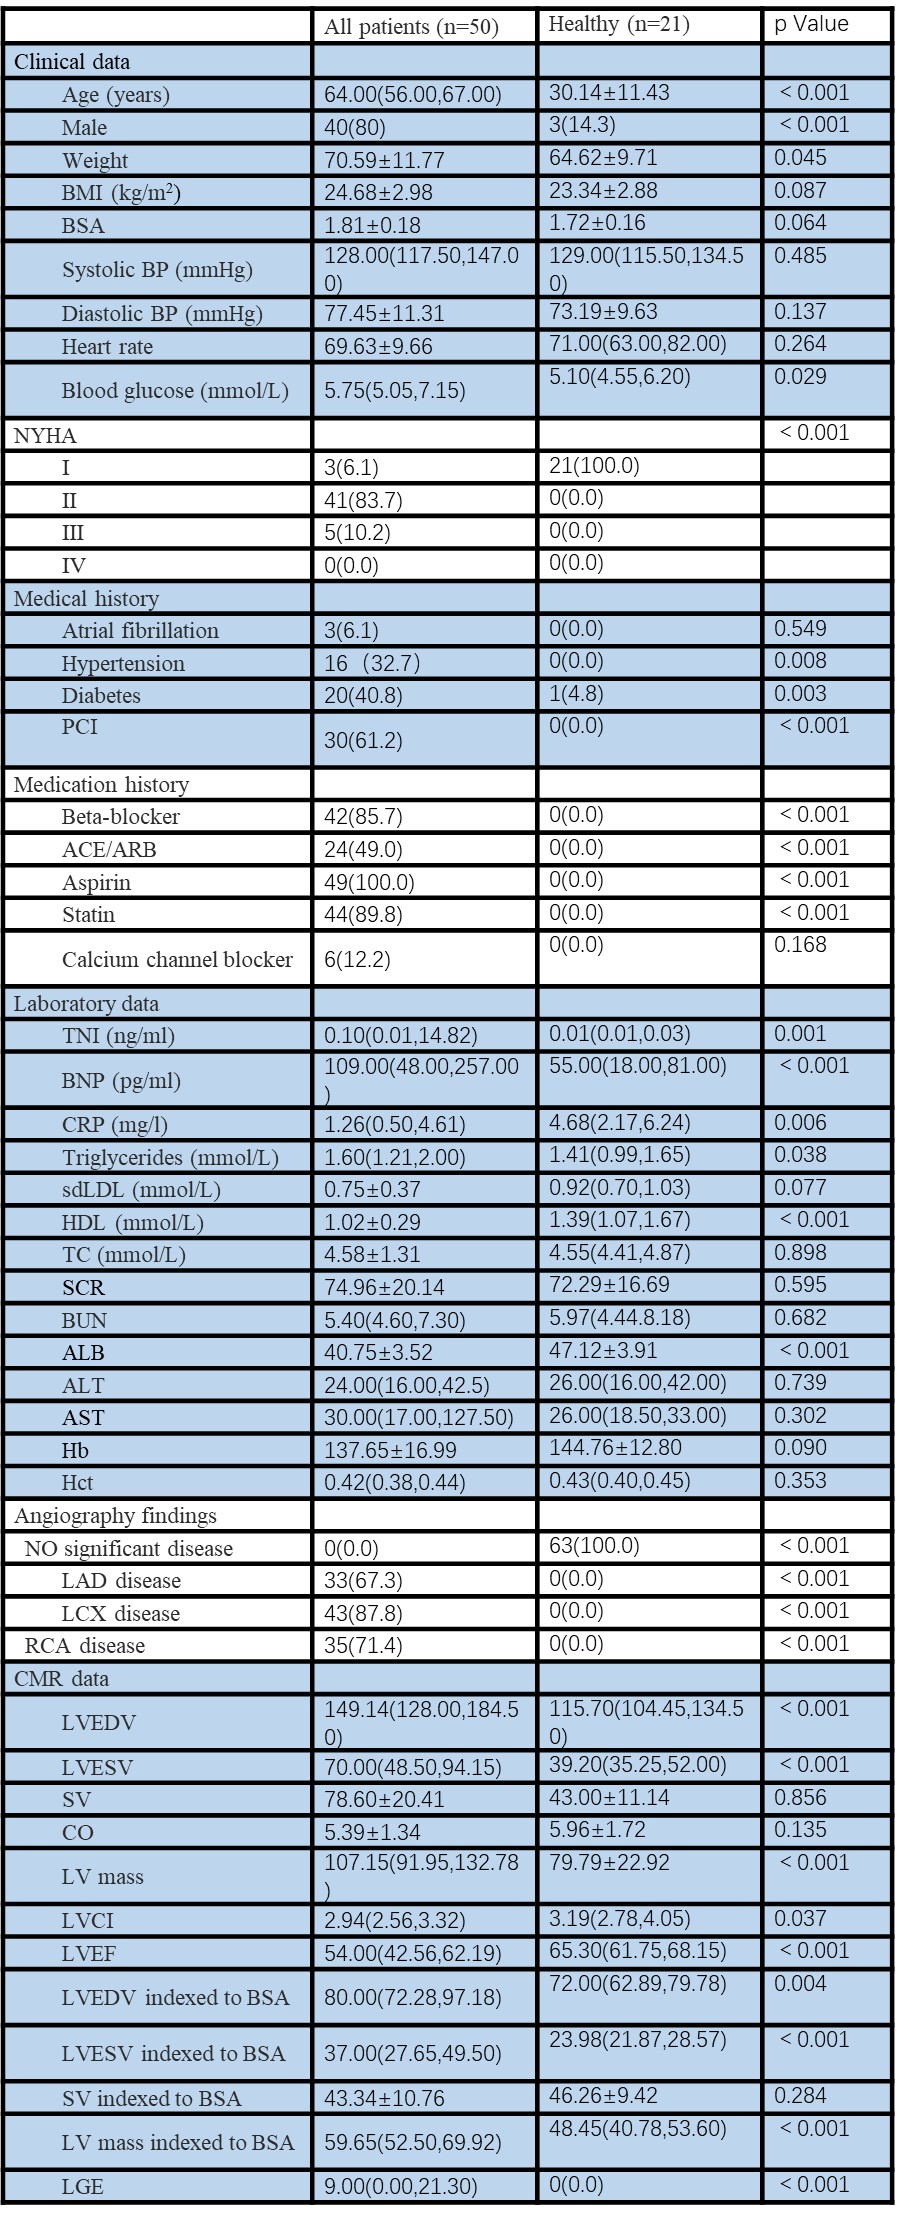
Table1.Values are mean ± SD, n(%) or median (interquartile range)
PCI = percutaneous coronary intervention; ACE = angiotensin-converting enzyme; ARB = angiotensin receptor blocker; BNP = brain natriuretic peptide; LAD = left anterior descending; LCX =left circumflex(LCX); RCA = right coronary artery; LVEDV = left ventricular end-diastolic volume; LVESV = left ventricular end-systolic volume; SV = stroke volume; CO = cardiac output; LV mass = left ventricular mass; LVCI = left ventricular cardiac index; LVEF = left ventricular ejection fraction; LGE = late gadolinium enhancement