3993
Synthetic magnetic resonance quantitative relaxation maps for preoperative staging of rectal cancer1Radiology, XiangYa Hospital, Central South University, Changsha, China, 2MR research, GE Healthcare, Beijing, China
Synopsis
Keywords: Cancer, Quantitative Imaging
To preoperative assessment of tumor and node staging for rectal cancer patients is very important. This study aimed to investigate the feasibility of predicting pathological TN staging with synthetic MRI quantitative relaxation maps for rectal cancer patients. A total of 123 patients were identified in this study. Our results showed that the T1 and T2 values from synthetic MRI can distinguish effectively between pT1-2 and pT3-4 group, pN- and pN+ group, which is vital to selection of therapy strategy for rectal cancer patients.Background
Rectal cancer (RC) is one of the most common malignant tumors of the gastrointestinal tract. The incidence and mortality rate of RC are increasing year by year, and it became the top third cancer [1]. Accurately preoperative assessment of tumor (T) and node (N) staging is vital to selection of therapy strategy for rectal cancer patients [2]. However, visual assessment of TN stage is affected by the radiologist’s experience, including tumor size on the high-resolution magnetic resonance imaging (MRI) [3,4]. Our purpose is to investigate the feasibility of predicting pathological TN staging with synthetic MRI quantitative relaxation maps for RC.Materials and methods
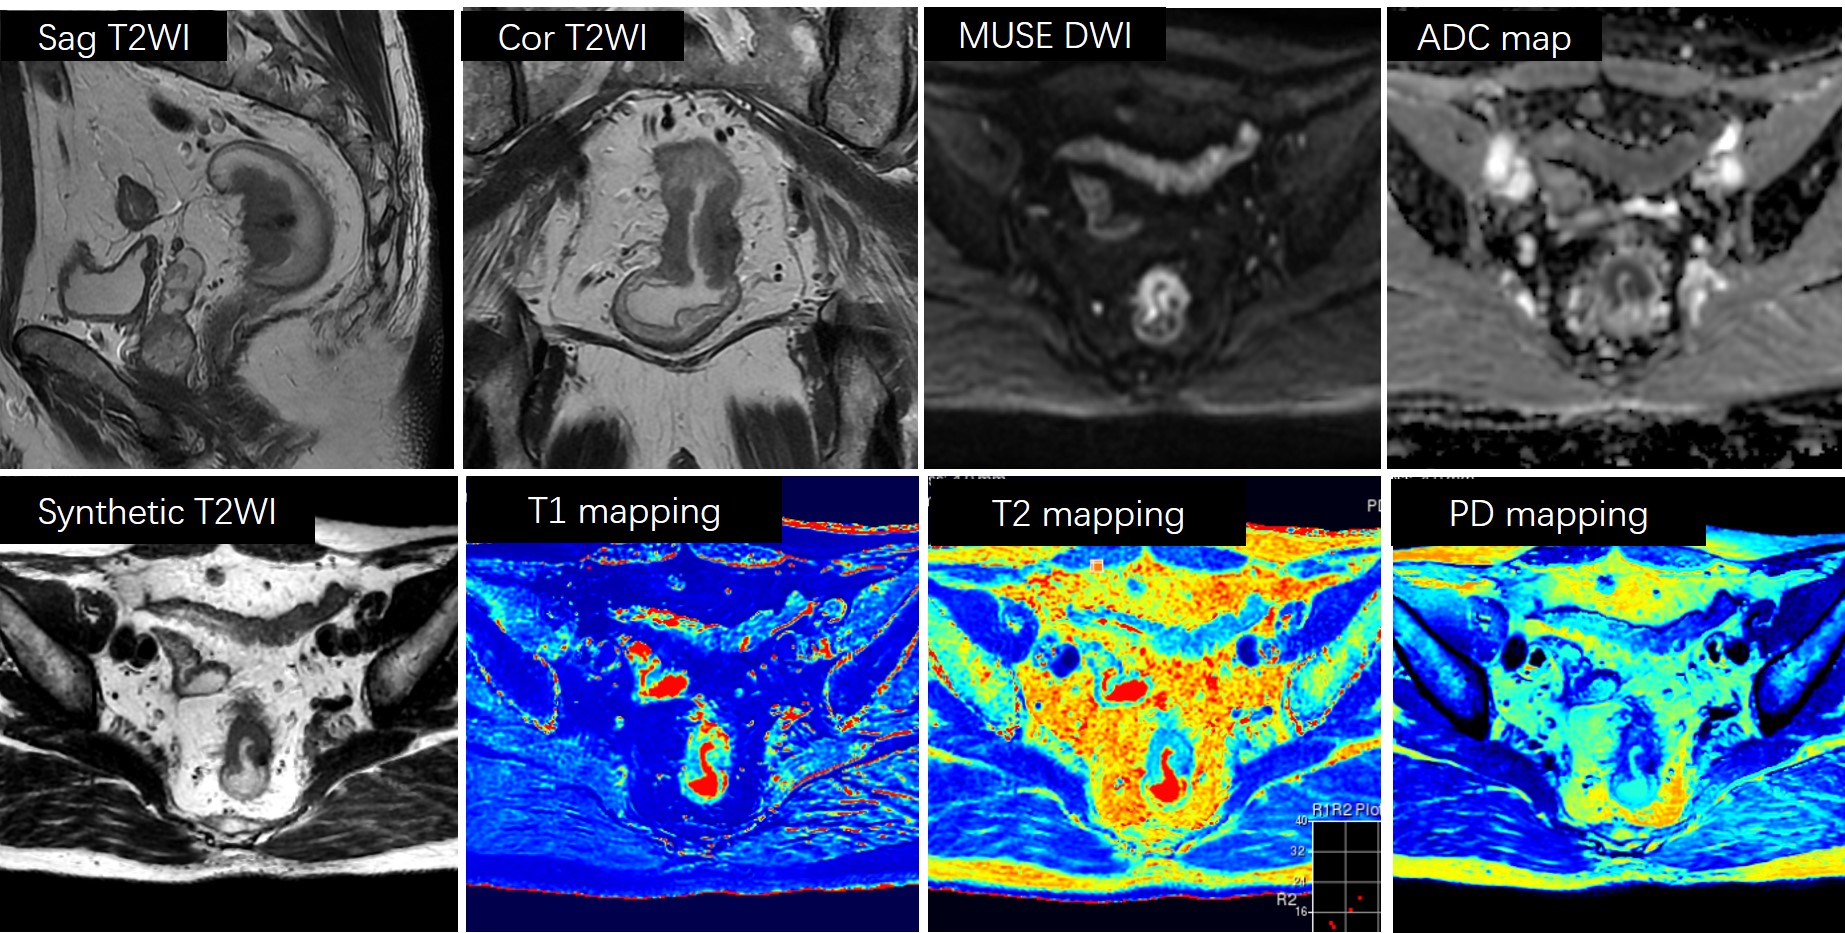
This prospective study was approved by the hospital ethics committee and informed signed consent was obtained from all patients. A total of 123 RC patients (mean age: 60.96 ± 9.89 years, age range: 33-91 years) underwent pre-operative MR examination including synthetic MRI (MAGiC), diffusion-weighted imaging with multiplexed sensitivity encoding (MUSE-DWI) sequence and routine MR images on 3.0 T MR scanners (SIGNA Premier, GE Healthcare, USA) using 16-channel body coil and 32-channel spinal coil (Figure 1). Synthetic MRI was performed before the injection of contrast agent in the oblique axial plane, using a MAGiC (magnetic resonance image compilation) sequence acquired according to the following parameters: repetition time,4000ms; echo time, 13.9/90.1 ms; echo train length,16; slices, 30; slice thickness, 4.0 mm; spacing, 0; the field of view (FOV), 320×320mm; matrix, 320×256; scanning time, 04:00. MUSE-DWI sequence acquired according to the following parameters: repetition time, 3039ms; echo time, 1 ms; number of shots, 3; slices, 30; slice thickness, 4.0 mm; spacing, 0; the field of view (FOV), 300×300mm; matrix, 160×168; scanning time, 02:17. The pathological findings (pTN staging, pathological differentiation, extramural vascular invasion (EMVI) and peripheral invasion (PNI)) were collected. T1, T2, proton density (PD) and ADC values were measured on the largest tumor layer to analyze the performance of pathological TN staging (pT staging: pT1-2 vs pT3-4; pN staging: pN- vs pN+), pathological differentiation, EMVI and PNI with the area under the curve (AUC).Results
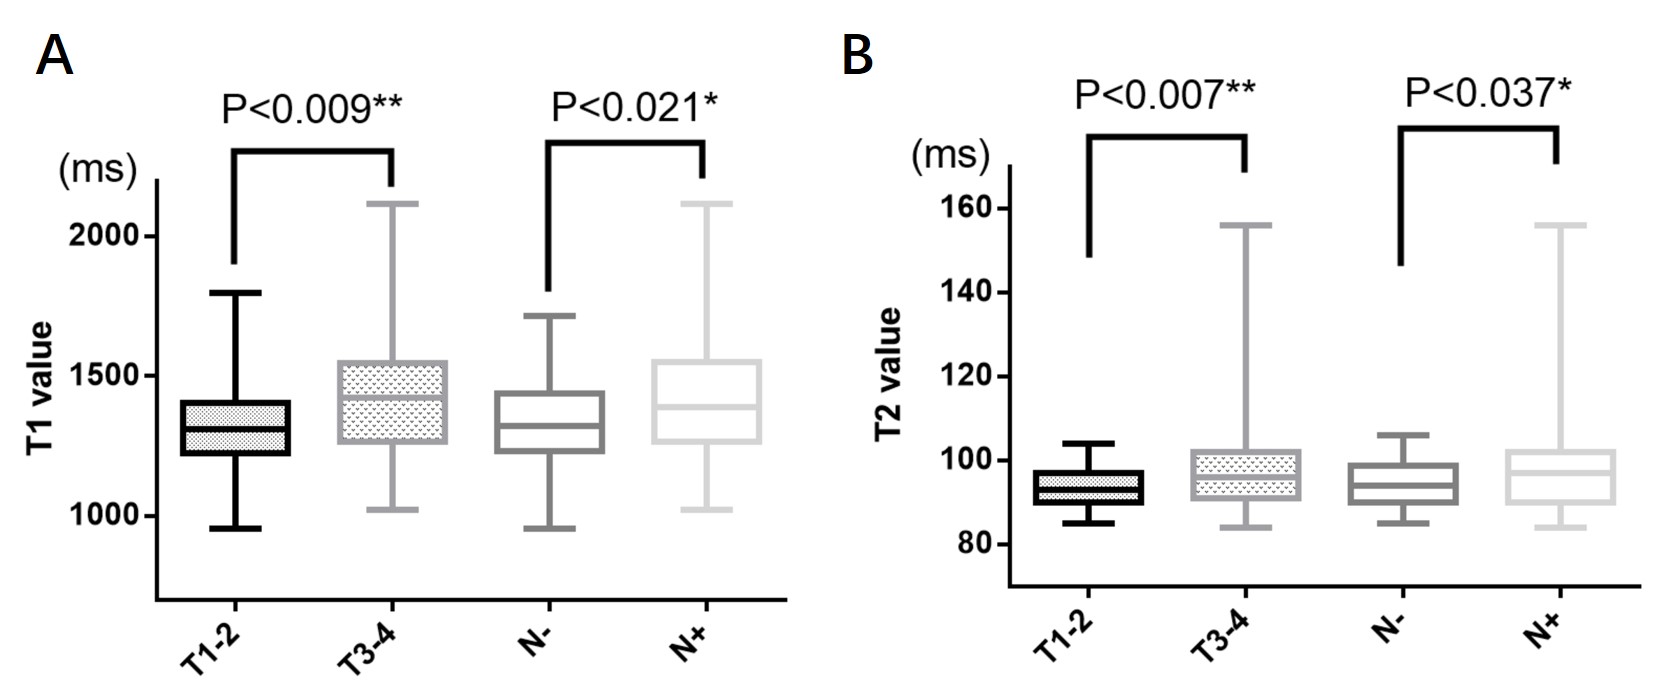
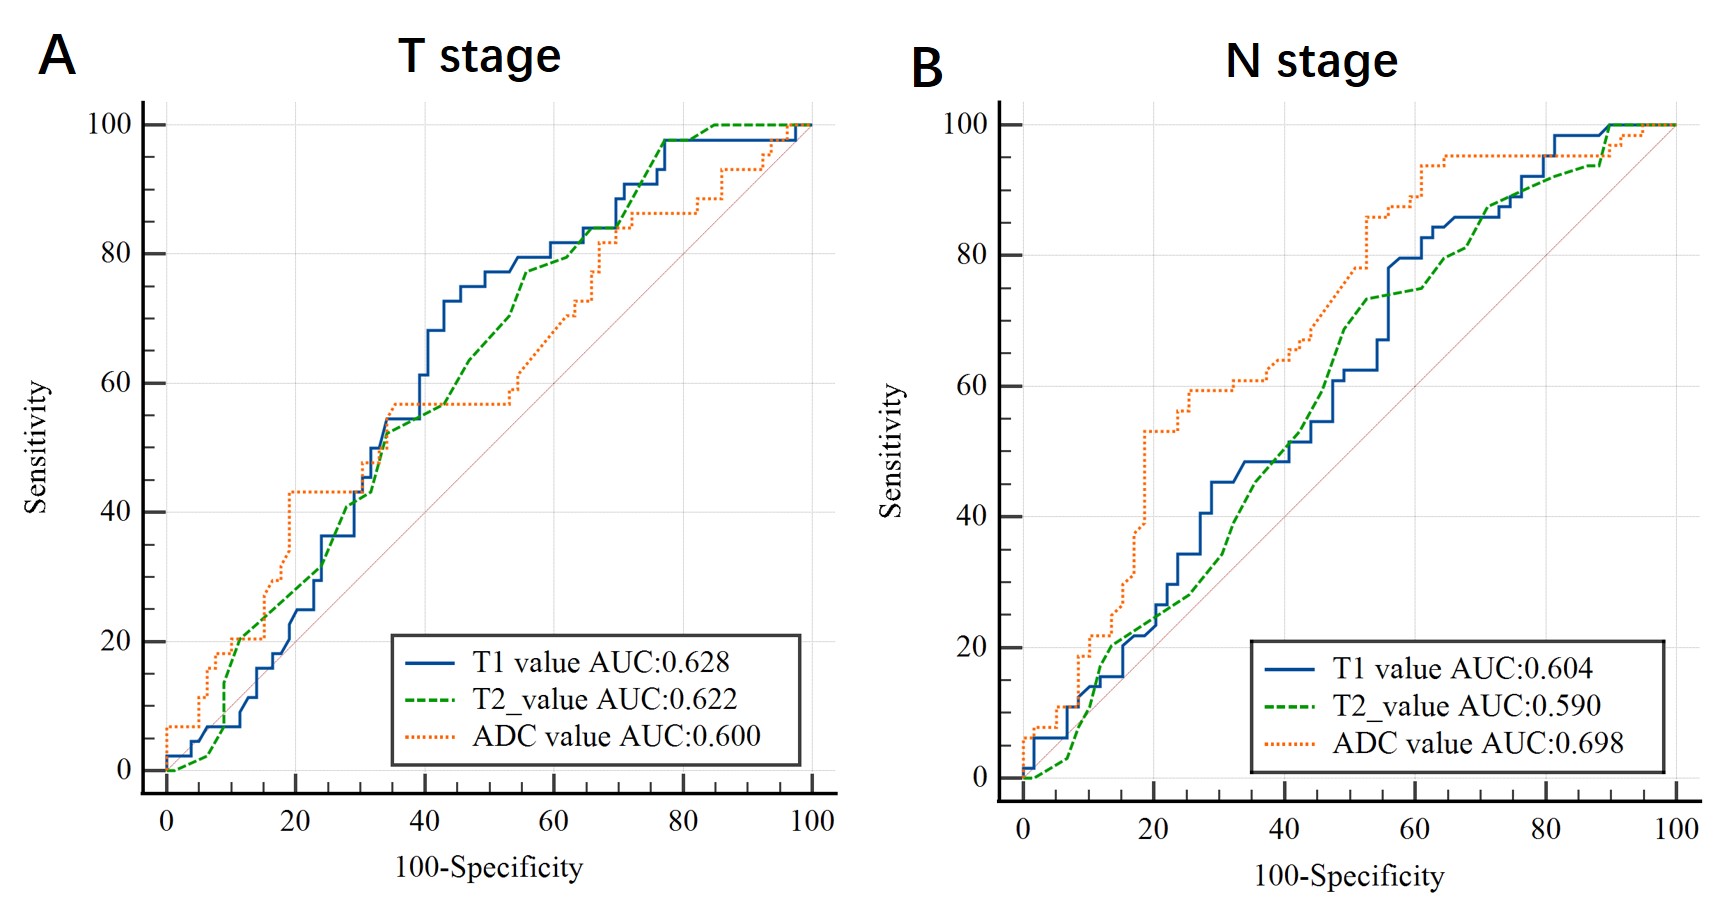
For pT staging, there was a statistically significant with T1 (1321.36 ± 149.60 ms vs 1407.94 ± 206.19 ms, P=0.009, AUC: 0.628) and T2 value (93.64 ± 5.15 ms vs 97.76 ± 11.44 ms, P=0.007, AUC: 0.622) between pT1-2 and pT3-4 group. However, ADC and PD values were not statistically different between the pT1-2 and pT3-4 groups. For pN stage, it showed a significantly different with T1 (1338.09 ± 153.85 ms vs 1419.14 ± 219.62 ms, P=0.021, AUC: 0.604), T2 (94.45 ± 5.67ms vs 98.27 ± 12.69ms, P=0.037, AUC: 0.590) and ADC value (1038.72 ± 127.54 vs 1150.23 ± 196.37 ×10⁻⁶ mm2/s, P<0.001, AUC: 0.698) between pN- and pN+ group (Figure 2,3). However, they showed no significant difference with T1, T2, PD and ADC values in the prediction of pathological differentiation, EMVI and PNI of RC.Discussion and conclusions
We demonstrated T1 and T2 values for pT and pN staging and ADC values for pN positive showed good diagnostic performance. Previous studies have shown the quantitative T2 relaxation time is a reliable and reproducible quantitative biomarker that can reflect the flow water content in different tissues [5]. In addition, the T1 value has been recognized as a noninvasive method for assessing myocardial diffuse fibrosis and a predictor of poor prognosis [6]. Moreover, T1 and T2 value has been widely used to evaluate diseases of the brain, bone, breast and prostate [5,7-9]. Consitent with previous studies to some extent, we also found that the group of higher pT-stage (pT3-4) and lymph node positive (pN+) both had higher T1 and T2 values, which may suggest that T1 and T2 values are increasing with tumor progression. To monitor T1 and T2 values in tissues may help assess the malignancy and progression of rectal cancer. Synthetic MRI can distinguish effectively between pT1-2 and pT3-4 group, pN- and pN+ group, which is vital to selection of therapy strategy for RC patients.Acknowledgements
This work was supported by the National Natural Science Foundation of China (grant number 82271984).References
[1] R-L Siegel, Miller K-D, Fuchs H-E, et al, Cancer statistics, 2022, CA Cancer J Clin, 2022, 72(1): 7-33.
[2] V Granata, Grassi R, Fusco R, et al, Current status on response to treatment in locally advanced rectal cancer: what the radiologist should know, Eur Rev Med Pharmacol Sci, 2020, 24(23): 12050-12062.
[3] B Sohn, Lim J-S, Kim H, et al, MRI-detected extramural vascular invasion is an independent prognostic factor for synchronous metastasis in patients with rectal cancer, Eur Radiol, 2015, 25(5): 1347-1355.
[4] C-G Willett, Czito B-G, Bendell J-C, Radiation therapy in stage II and III rectal cancer, Clin Cancer Res, 2007, 13(22 Pt 2): 6903s-6908s.
[5] Y. Arita, T. Takahara, S. Yoshida, et al, Quantitative assessment of bone metastasis in prostate cancer using synthetic magnetic resonance imaging, Invest Radiol, 2019, 54(10): 638–644.
[6] V.O. Puntmann, G. Carr-White, A. Jabbour, et al, T1-Mapping and outcome in nonischemic cardiomyopathy: all-cause mortality and heart failure, JACC ardiovasc Imaging, 2016, 9(1): 40–50.
[7] Y. Cui, S. Han, M. Liu, et al, Diagnosis and grading of prostate cancer by relaxation maps from synthetic MRI, J Magn Reson Imaging, 2020, 52 (2): 552–564.
[8] S. Li, J. Liu, F. Zhang, et al, Novel t2 mapping for evaluating cervical cancer features by providing quantitative t2 maps and synthetic morphologic images: a preliminary study, J Magn Reson Imaging, 2020, 52(6):1859-1869.
[9] L.C. Adams, K.K. Bressem, P. Jurmeister, et al, Use of quantitative T2 mapping for the assessment of renal cell carcinomas: first results, Cancer Imaging, 2019, 19 (1):35.
Figures