3987
Z-spectrum Imaging of Bowel Wall Fibrosis in Crohn's Disease
Nabeelah Jinnah1, Olivier Mougin1, Penny Gowland1, Caroline Hoad1, Lauren Gascoyne1, Christopher Clarke2, and Gordon Moran1
1University of Nottingham, Nottingham, United Kingdom, 2Nottingham University Hospitals NHS Trust, Nottingham, United Kingdom
1University of Nottingham, Nottingham, United Kingdom, 2Nottingham University Hospitals NHS Trust, Nottingham, United Kingdom
Synopsis
Keywords: Digestive, CEST & MT
Z-spectrum imaging was performed on bowel wall from Crohn's disease patients, to determine it's potential as a method of determining the fibrotic component of scarred bowel wall. Results show that there is a difference between the MT amplitude and linewidth of healthy compared with strictured bowel wall. Future work will involve optimising a protocol to use as a imaging biomarker of the fibrosis within bowel wall in Crohn's disease.Introduction
Fibrosis is the excess deposition of extracellular matrix (ECM) components and is implicated in 45% of deaths worldwide [1], however there are currently no verified non-invasive markers. Crohn’s disease is an inflammatory bowel disorder and a complication is obstruction of fibrotic tissue within the intestinal tract called stricturing, which can inhibit the movement of food and stool, and In some cases, patients will require surgical intervention to remove the affected segment of bowel wall. Currently, the only method which can assess the extent of the bowel wall fibrosis is histology following intestinal resection and there is no validated method to predict whether a CD patient will require surgery or if the disease can be successfully managed using anti-inflammatory medication. Magnetisation transfer imaging may allow us to identify tissues containing elevated levels of fibrosis, by quantifying macromolecular content such as collagen which is the most prominent protein contained within the ECM. Previous work has demonstrated that normalised magnetisation transfer (MT) ratios can differentiate between early fibrotic and non-fibrotic bowel wall [2]. Z-spectrum imaging may provide a more robust measurement to sequence parameters and B0 and B1 inhomogeneity compared with single-point frequency MT acquisition.Methods
NHS Research Ethics Committee approval was obtained. Z-spectra were obtained from three candidates with diagnosis of CD, who were due to undergo surgical resection of bowel wall. Before scanning, participants consumed a 1L drink containing 2 % mannitol and 0.2 % locust bean gum, an. dDuring scanning they were intravenously administered Buscopan (hyoscine butyl bromide) to inhibit gut motility. Z-spectra were acquired on a Phillips 3T Ingenia system with a 32ch receiver body coil using a 3D-TFE readout [1] using a train of 20 Gaussian-windowed sinc pulses of 1.2 s duration. 22 saturation frequency offsets were acquired with a single offset acquired per breath-hold. Motion correction was performed using the ANTs toolkit [3]; the volume from each saturation frequency were motion corrected stepwise to the volume which visibly appeared to have the greatest contrast between the bowel wall and its content and surroundings, using a rigid and affine step followed by a non-rigid B-spline step. The remainder of the analysis was performed in MATLAB: ROIs along the bowel wall in the regions were identified by a physicist with some training from a radiographer. They were selected by using a semi-automated method Bowel wall was masked using methods which included adaptive thresholding and user input to discard unwanted areas. Additional ROIs were selected in other areas along the intestinal wall which were not identified as strictured and z-spectra were then extracted from manually drawn smaller sub-regions within these ROIs and were fitted to a three-pool Lorentzian model, consisting of free water, MT, and fat pools. Spectra from strictured and healthier regions were visually validated to discard of poor-quality spectra. The median MT fit was calculated for each subject for strictured and healthier bowel wall.Results
Box plots displaying the median of the product of the MT amplitude fitting and the MT linewidth fitting from the z-spectra from strictured and healthy bowel wall regions are displayed in Figure 1. Figure 2 displays a voxel-wise map of the MT pool size from strictured bowel wall. Figure 3 shows the results of a spectrum obtained from a strictured region of bowel wall.Discussion
The spectra from both the in-vivo and ex-vivo images were fitted to a three-pool model and the size of the MT pool was considered as an overall indication of the sizes of the CEST and macromolecular pools. This analysis of in-vivo z-spectra from the bowel wall in CD suggests that MT pool size is elevated in strictured regions compared with healthier regions of bowel wall. However, spectra appeared less stable due to motion in the second half of the data in one of the subjects, suggesting that the Buscopan had started to wear off. The final two offset frequencies in these datasets were discarded before fitting. Spectra were also better quality when acquired from the strictured regions compared with healthier regions which may be more prone to motion. A limitation of this work is that the participants in this study were candidates for surgery and therefore these datasets are only representative of moderate-to-severe bowel fibrosis. Additionally, the z-spectrum images were not reviewed by a radiologist to confirm the locations of the strictures.In addition to z-spectrum imaging, T1, T2 and diffusion weighted images were also acquired and are currently being analysed; the end goal is to derive an optimal MR sequence combination which can be used to provide imaging biomarkers for fibrosis and inflammation of the bowel wall. Following surgery, the fresh resected bowel wall samples have been scanned ex-vivo and analysis is ongoing. Future work will additionally involve analysing the z-spectrum of bowel wall healthy control participants and further work could involve imaging CD bowel wall during earlier stages of fibrosis, monitoring the disease long-term and determining if the measurements correlate with which patients eventually require surgery.
Acknowledgements
No acknowledgement found.References
1. Wynn TA. Fibrotic disease and the T(H)1/T(H)2 paradigm. Nat Rev Immunol. 2004;4(8):583-594
2. Li XH, Mao R, Huang SY, et al. Characterization of Degree of Intestinal Fibrosis in Patients with Crohn Disease by Using Magnetization Transfer MR Imaging. Radiology 2018;287:494-503
3. Brian Avants, Jeffrey T Duda, Junghoon Kim, Hui Zhang, John Pluta, James C Gee, and John Whyte. Multivariate analysis of structural and diffusion imaging in traumatic brain injury. Acad Radiol, 15(11):1360–1375, Nov 2008.
Figures
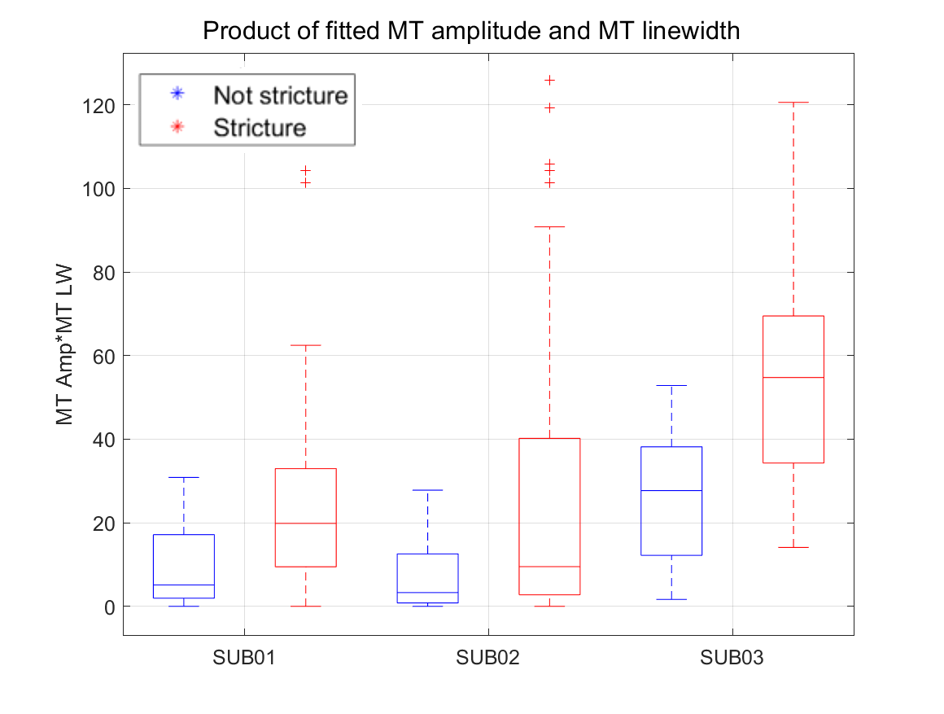
Differences between the product of fitted MT amplitude and fitted MT linewidth across strictured and healthier sub-regions from three subjects.
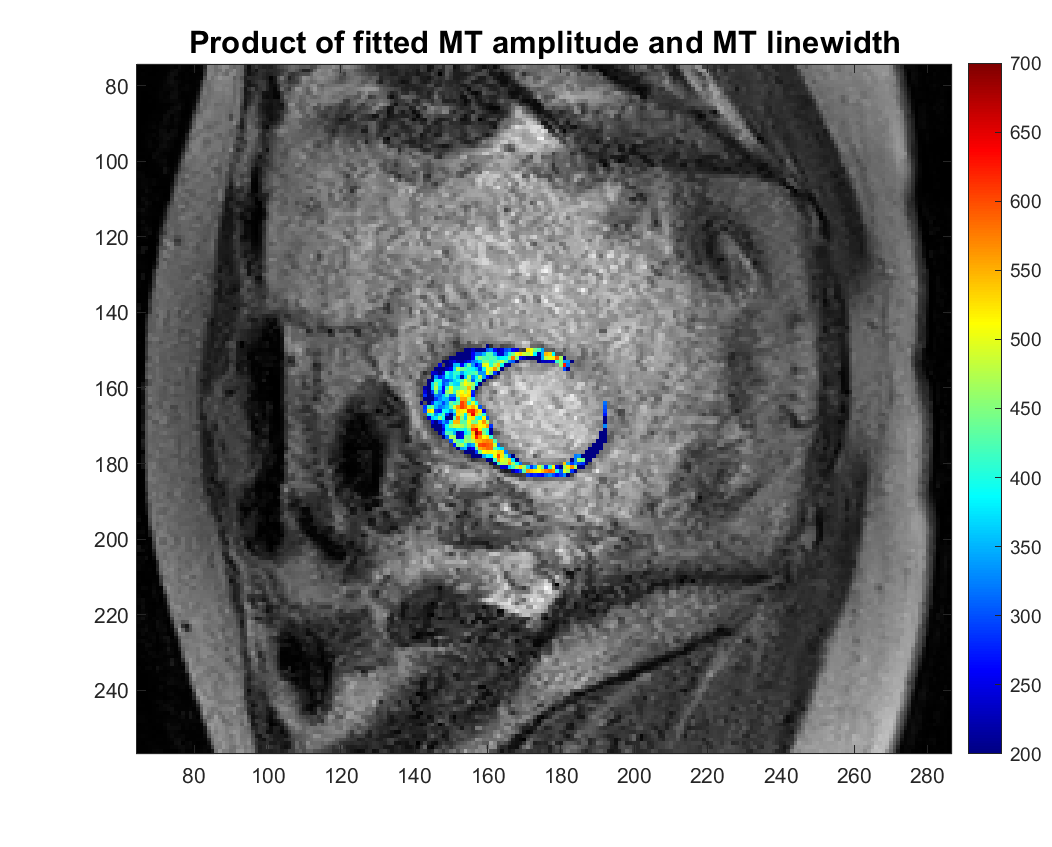
Voxel-wise Lorentzian fitting on a large strictured section of bowel wall.
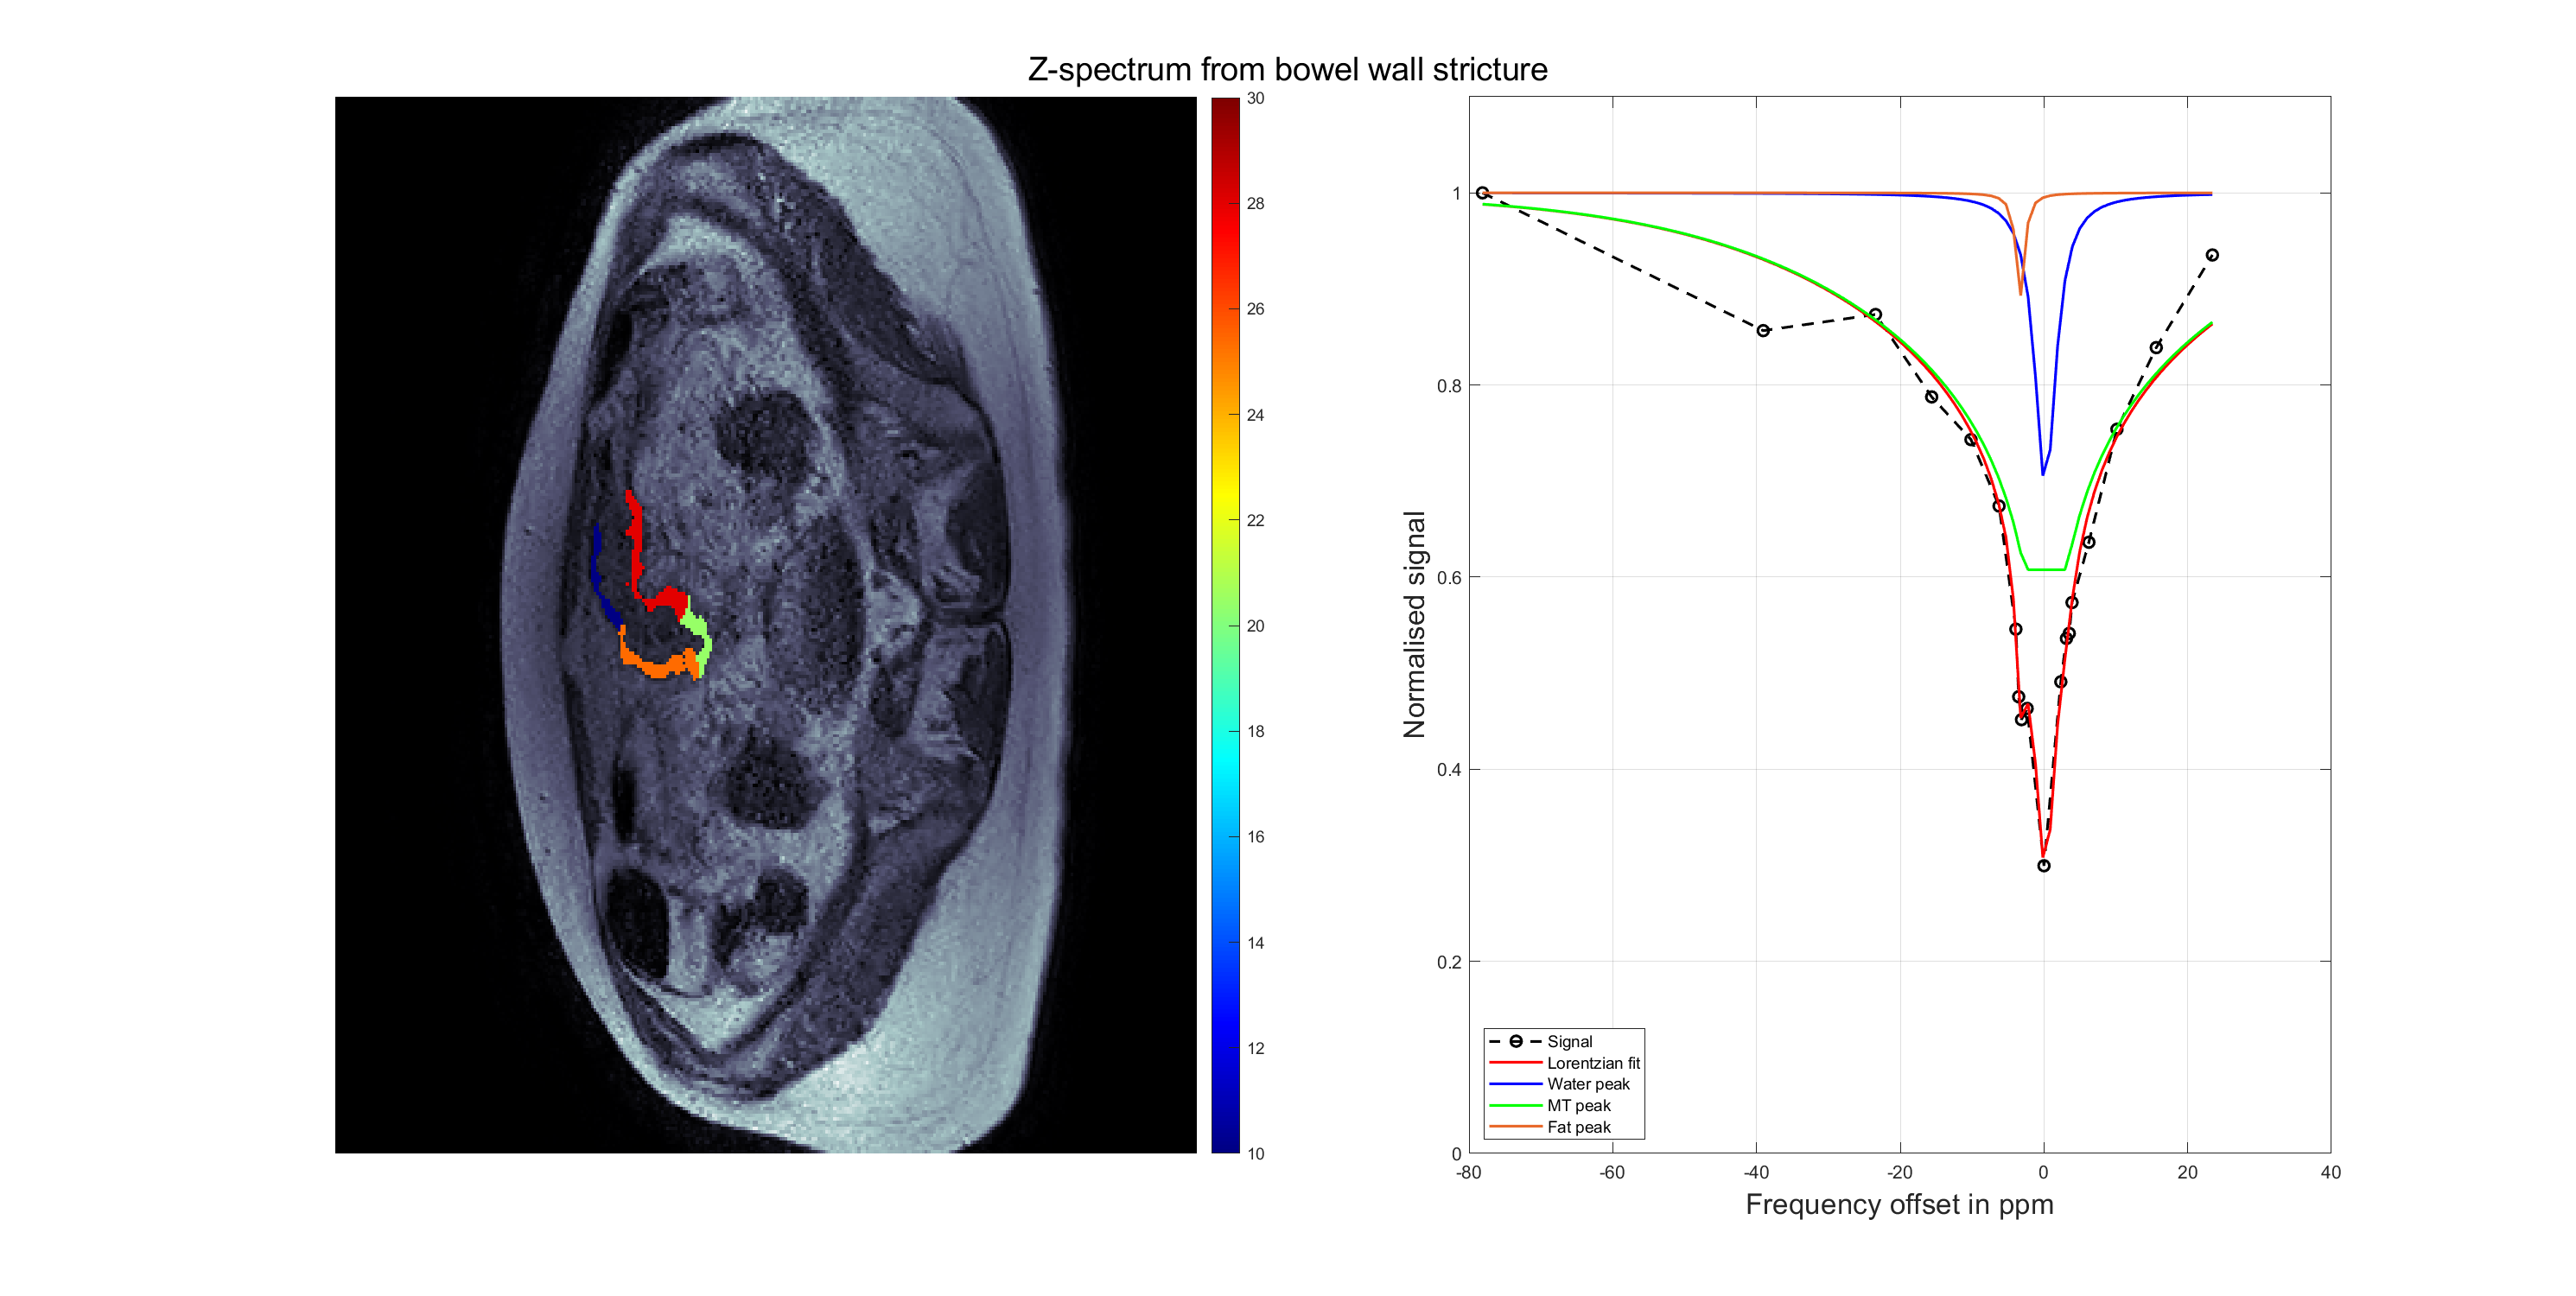
Spectrum acquired from strictured region of bowel wall and results of three-pool Lorentzian fitting performed to include a water pool, an MT pool and a fat pool.
DOI: https://doi.org/10.58530/2023/3987