3979
Age-related changes in normal adult pancreatic parenchyma: multiparametric MR imaging evaluation
Akihiko Kanki1, Yoshihiko Fukukura1, Hidemitsu Sotozono1, Kiyoka Maeba1, Atsushi Higaki1, Akira Yamamoto1, and Tsutomu Tamada1
1radiology, Kawasaki Medical School, kurashiki, Japan
1radiology, Kawasaki Medical School, kurashiki, Japan
Synopsis
Keywords: Pancreas, Pancreas
We evaluated relationships of age and gender with shifted apparent diffusion coefficient (sADC), proton density fat fraction (PDFF), T1 relaxation time, and pancreas size using 3-T MRI. sADC increased and anterior-posterior diameter decreased with age, while T1 relaxation time and PDFF showed no correlations with age. These results would offer beneficial information regarding pancreatic imaging.INTRODUCTION
Pancreatic fibrosis and fatty degeneration are the risk factor for eventual progression to pancreatic ductal adenocarcinoma (PDAC)1-3. Magnetic resonance imaging (MRI) for the pancreas has advanced rapidly in recent years with the spread of high magnetic field devices and technological development4. Diffusion-weighted imaging (DWI)-based virtual elastography with shifted ADC (sADC) has been suggested for noninvasive staging of liver fibrosis without any need for special hardware or software5. Fukui et al. showed that proton density fat fraction (PDFF) was correlated with histological pancreatic fat fraction3. Another study reported the feasibility of T1 relaxation time within the pancreatic parenchyma measured by T1 mapping for evaluating fibrotic change1. It is important to clarify the age- and gender-related changes in findings that represent development risks for PDAC, such as fibrosis and fatty degeneration. The aim of this study was to evaluate the relationship of age and gender with sADC, PDFF, and T1 relaxation time in the pancreas parenchyma, and pancreas size.METHODS
This retrospective study received institutional review board approval. Participants comprised 71 patients (mean age, 64.9±14.6 years; 34 men, 37 women) with no history of pancreatic disease, who underwent MRI, including DWI with b-values of 200 and 1500 s/mm2, multi-echo 3D Dixon T1WI, T1-mapping images acquired using the Look-Locker method. sADC, PDFF, and T1 relaxation time within the pancreas parenchyma, and anterior-posterior (AP) diameters of the head, body, and tail of the pancreas on opposed-phase T1WI were measured and used for analyses. The relationships of sADC, PDFF, T1 relaxation time, and AP diameter with patient age were analyzed by using the Spearman rank correlation coefficient (Rs). The Mann-Whitney and the Kruskal-Wallis tests were used to compare differences in sADC, PDFF, T1 relaxation time, and AP diameter, regarding patient gender and the anatomical region of the pancreas (head, body, and tail), respectively.RESULTS
A significant correlation was identified between age and sADC (Pearson’s coefficient=0.398, P<0.001) or AP diameter (Pearson’s coefficient=-0.364, P=0.002, respectively). No significant correlation was identified in PDFF (Pearson’s coefficient =0.174, P=0.147) or T1 relaxation time within the pancreas parenchyma (Pearson’s coefficient =-0.173, P=0.149, respectively) (Fig.1). Significant differences in sADC (P=0.027) and AP diameters (P=0.010) were seen between man and woman (Fig. 2). Significant differences in T1 relaxation time (P=0.010) and AP diameters were seen among the head, body, and tail regions (P<0.001). In pairwise comparisons, T1 relaxation time was significantly lower in the head than in the body (P=0.01). AP diameter was significantly higher in the head than in the body (P=0.010) or in the tail (P=0.010) (Fig. 3).DISCUSSION
In our study, sADC increased with age, and AP diameters decreased with age, while T1 relaxation time and PDFF did not show any correlations with age. Sato et al. 4 showed that the pancreatic AP diameter significantly reduced and parenchymal fatty change became more evident with aging. Our results are consistent with their report for AP diameter but differed on fatty change. This difference may be due to the fact that they evaluated fatty change by chemical shift imaging, whereas we used PDFF. The PDFF has been reportedly correlated with histologic pancreatic fat fraction3. Changes in pancreatic sADC and T1 relaxation time with age have not been reported. Kolipaka A et al. 2 reported that the stiffness of the pancreas increased with age using MR elastography. Our results showed that sADC increased with age although it might not reflect pure pancreatic stiffness. Our results suggested that the effects of aging alone are unlikely to cause fibrosis or fatty degeneration. In other words, the presence of severe fibrosis or fatty degeneration should be considered in the presence of pancreatic diseases such as chronic pancreatitis. These results would offer beneficial information regarding pancreatic imaging.CONCLUSION
sADC increased and AP diameters decreased with age, while T1 relaxation time and PDFF showed no correlations with age. These results would offer beneficial information regarding pancreatic imaging.Acknowledgements
No acknowledgement found.References
[1] Steinkohl E, Olesen SS, Hansen TM, Drewes AM, Frøkjær JB. T1 relaxation times and MR elastography-derived stiffness: new potential imaging biomarkers for the assessment of chronic pancreatitis. Abdom Radiol (NY) 2021;46(12):5598-608.[2] Kolipaka A, Schroeder S, Mo X, Shah Z, Hart PA, Conwell DL. Magnetic resonance elastography of the pancreas: Measurement reproducibility and relationship with age. Magn Reson Imaging 2017;42:1-7.[3] Fukui H, Hori M, Fukuda Y, et al. Evaluation of fatty pancreas by proton density fat fraction using 3-T magnetic resonance imaging and its association with pancreatic cancer. Eur J Radiol 2019;118:25-31.[4] Sato T, Ito K, Tamada T, et al. Age-related changes in the normal adult pancreas: MR imaging evaluation. Eur J Radiol 2012;81(9):2093-8.[5] Kromrey ML, Le Bihan D, Ichikawa S, Motosugi U. Diffusion-weighted MRI-based Virtual Elastography for the Assessment of Liver Fibrosis. Radiology 2020;295(1):127-35.Figures
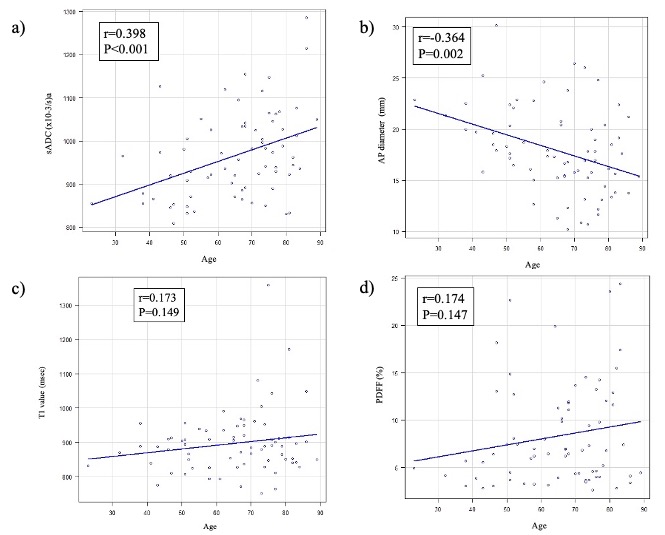
Fig. 1 Relationships of patient age with shifted apparent diffusion coefficient (sADC), anterior-posterior (AP) diameters, T1 relaxation time, and proton density fat fraction (PDFF).
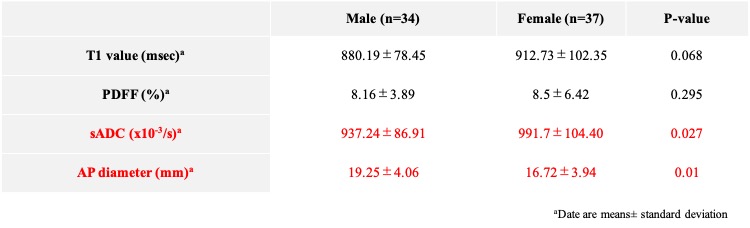
Fig. 2. Effect of gender on shifted apparent diffusion coefficient (sADC), anterior-posterior (AP) diameters, T1 relaxation time, and proton density fat fraction (PDFF).
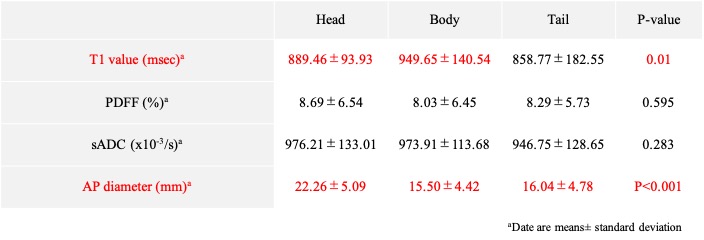
Fig. 3. Comparisons of shifted apparent diffusion coefficient (sADC), anterior-posterior (AP) diameters, T1 relaxation time measured by T1 mapping and proton density fat fraction (PDFF) among the anatomical regions (head, body, and tail).
DOI: https://doi.org/10.58530/2023/3979