3978
Multiparametric quantitative MRI of Healthy Adult Pancreas: Correlations with Gender and Age1Biomedical Imaging Research Institute, Cedars-Sinai Medical Center, Los Angeles, CA, United States, 2Radiologic department, Beijing Chaoyang Hospital, Captial Medical University, Beijing, China, 3MR Scientific Marketing, Siemens Healthcare, Beijing, China, 4Department of Medicine, Cedars-Sinai Medical Center, Los Angeles, CA, United States, 5Division of Digestive and Liver Diseases, Cedars-Sinai Medical Center, Los Angeles, CA, United States
Synopsis
Keywords: Pancreas, Quantitative Imaging, T1 value, T2 value, ADC value
The pancreas plays an important role in nutrition and metabolism of the whole body. Changes of pancreatic morphology and function are related to many diseases. Multiparametric MR provides quantitative information about pancreatic morphology and function. In this work, we measured the normal range of T1, T2, and ADC values for different gender and age groups, and found significant differences between age groups. Gender difference was only found in T2. There are negative correlations between T2/ADC and age, and positive correlation between T1 and age.Introduction
The pancreas plays an important role in nutrition and metabolism of whole body. Many disease processes including obesity, diabetes mellitus (DM), acute or chronic pancreatitis, and pancreatic carcinoma result in abnormality of pancreas morphology and function. MRI provides quantitative parameters including T1, T2 and ADC values for evaluating normal and abnormal pancreas[1]. T1 and T2 values were used to characterize different tissue properties which were influenced by pancreatic acinar protein and endoplasmic reticulum[2]. ADC value was a biomarker which reflected cellular density and composition. Based on the normal range of these quantitative parameters, the pancreatic abnormality could be detected early. Previous research focused on the normal pancreatic volume evaluation[3] and established the range of pancreatic volume in different age groups[4] with MRI. However, the range and relationship of MR parameters with gender and age groups have not been explored. The purpose of this study was to establish the range of healthy MR tissue and functional parameters, including T1, T2, and ADC and explore their correlations with age.Methods
Eighty-six adult cases with normal pancreas (54 Females and 32 Males, mean age 44.7 years with a range of 18 – 90 years) were recruited and underwent 3.0T MR scanner (MAGNETOM MMR and Prisma, Siemens Healthcare, Germany). T1-mapping were derived using a Modified Look-Locker Inversion Recovery (MOLLI) sequence and B1- corrected variable flip angle (VFA) of the whole abdomen. T2-mapping were acquired using a T2-prepared TrueFISP sequence that copied location and slices copied from T1-MOLLI. DWI were acquired using single-shot echo-planar imaging (SS-EPI) pulse sequence with b-values of 50, 400, 800 s/mm2. Clinical T1-VIBE and T2WI were acquired simultaneously and used as diagnostic references. Regions of interest (ROI) were drawn three times in pancreatic head, neck, body, and tail avoiding the vessels and the main pancreatic duct (MPD). Average T1, T2, and ADC values were obtained by pixel-wise method. T-test, one-way analysis of variance (ANOVA,) and post hoc test (Turkey test) were used for comparison the difference between groups and within groups. Pearson Correlation coefficients were used to explore the correlations of T1, T2, and ADC values with age.Results
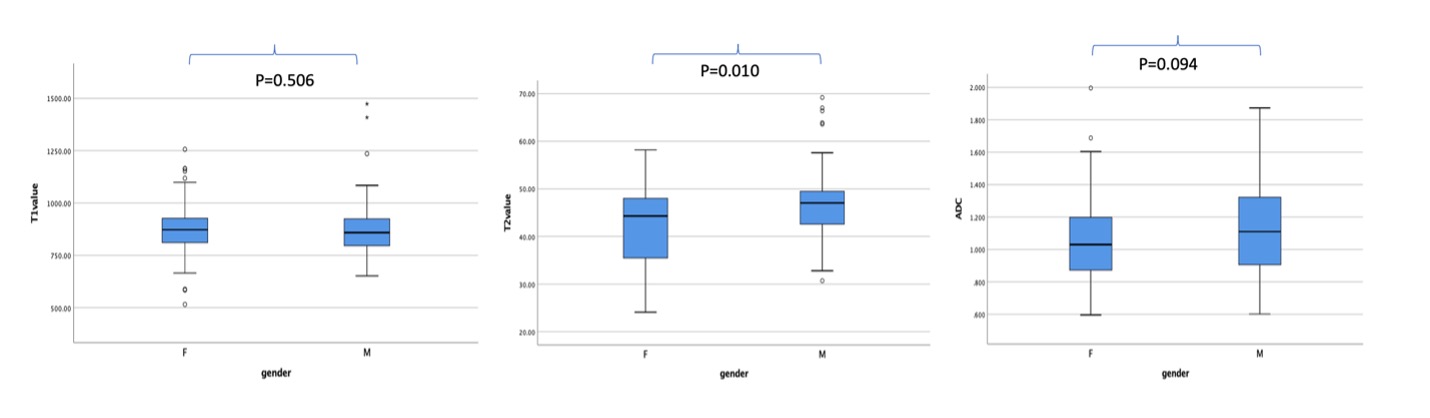
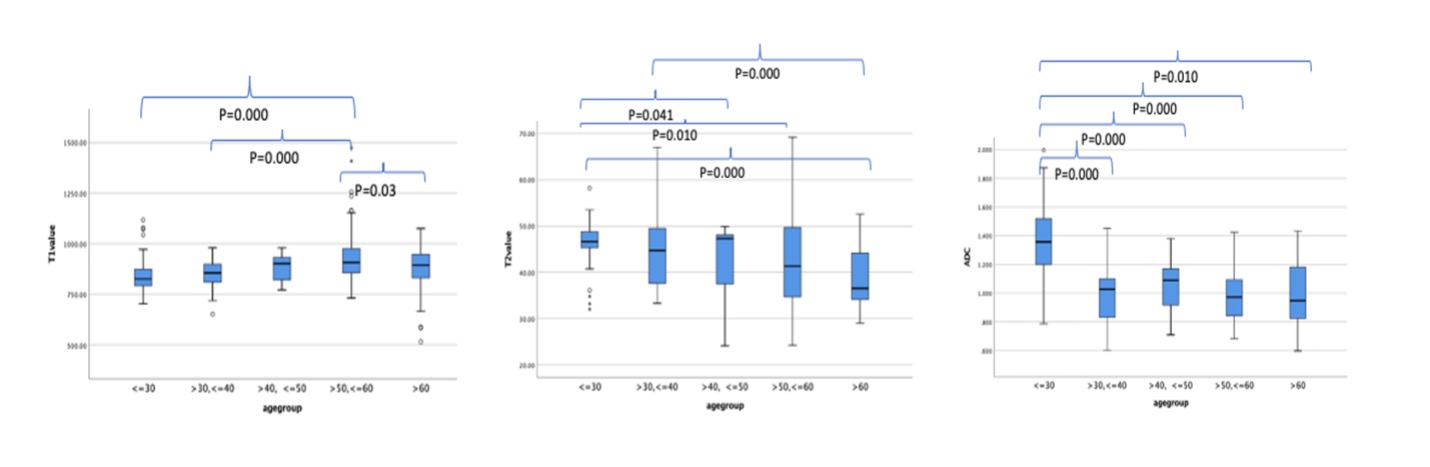
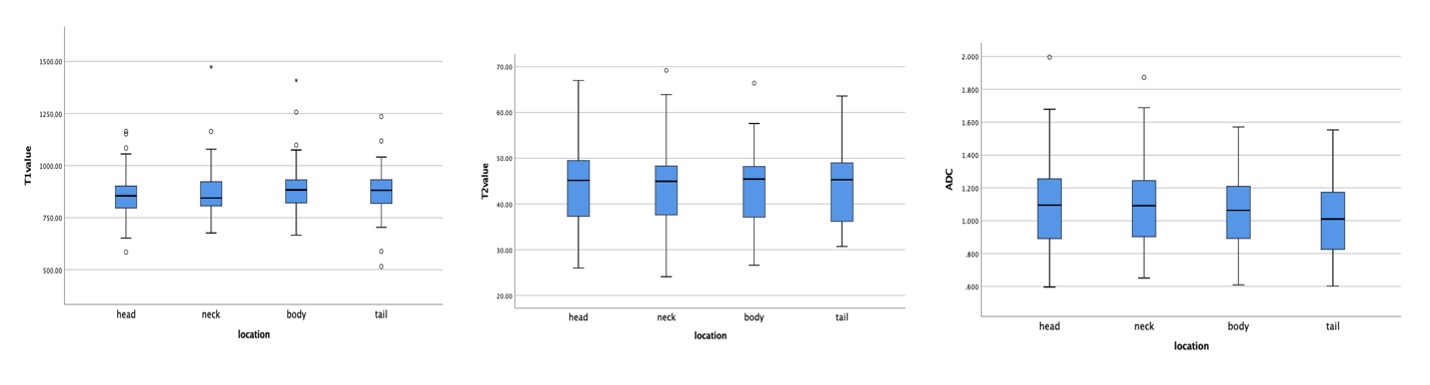
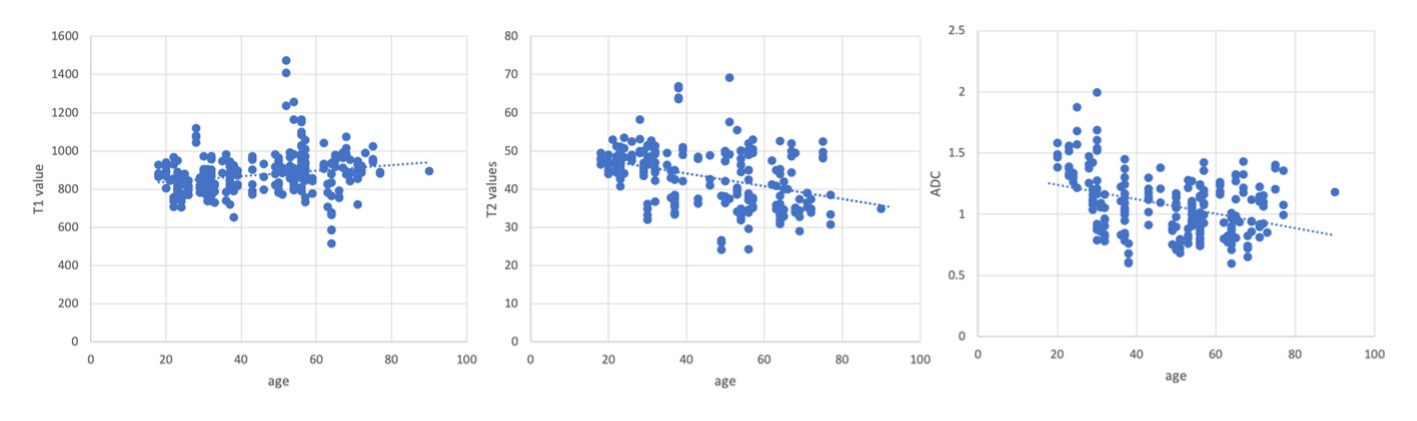
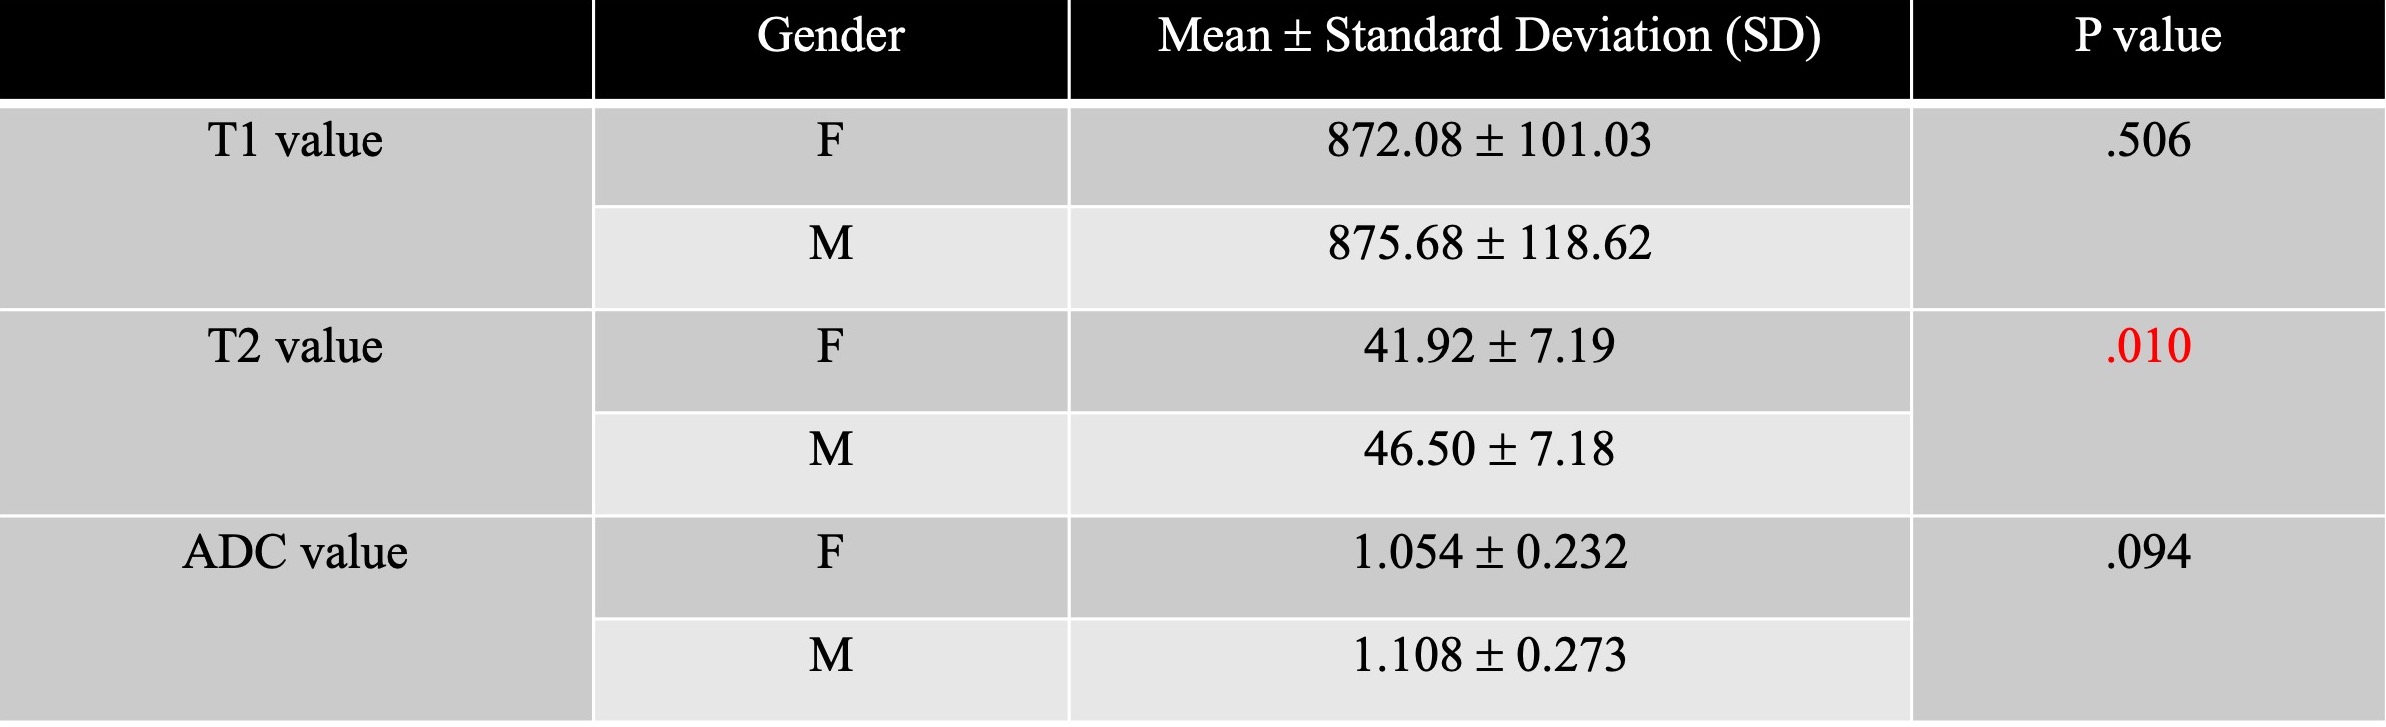
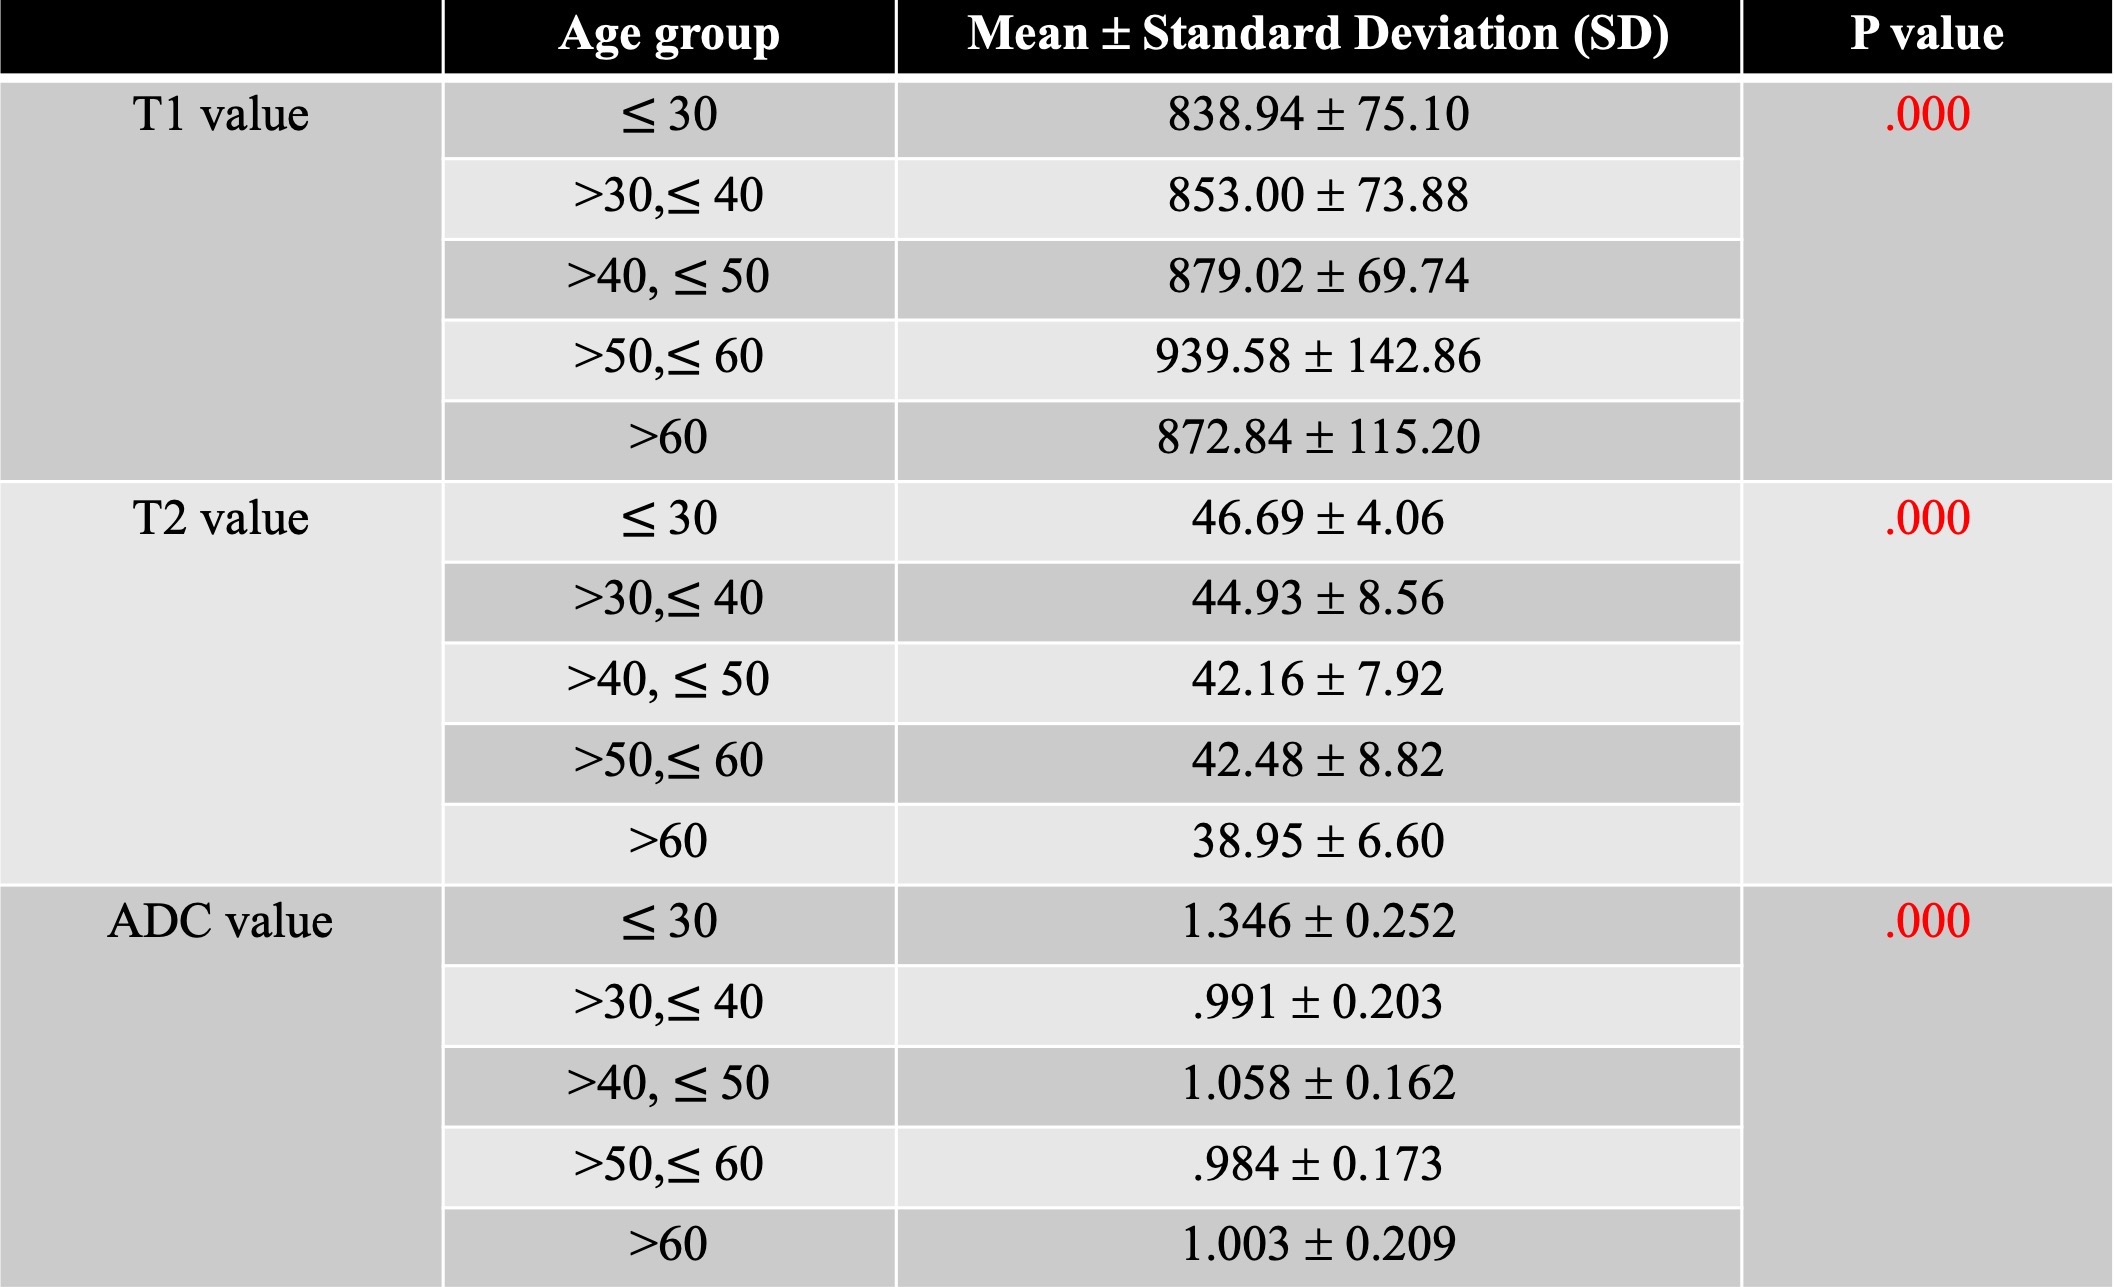
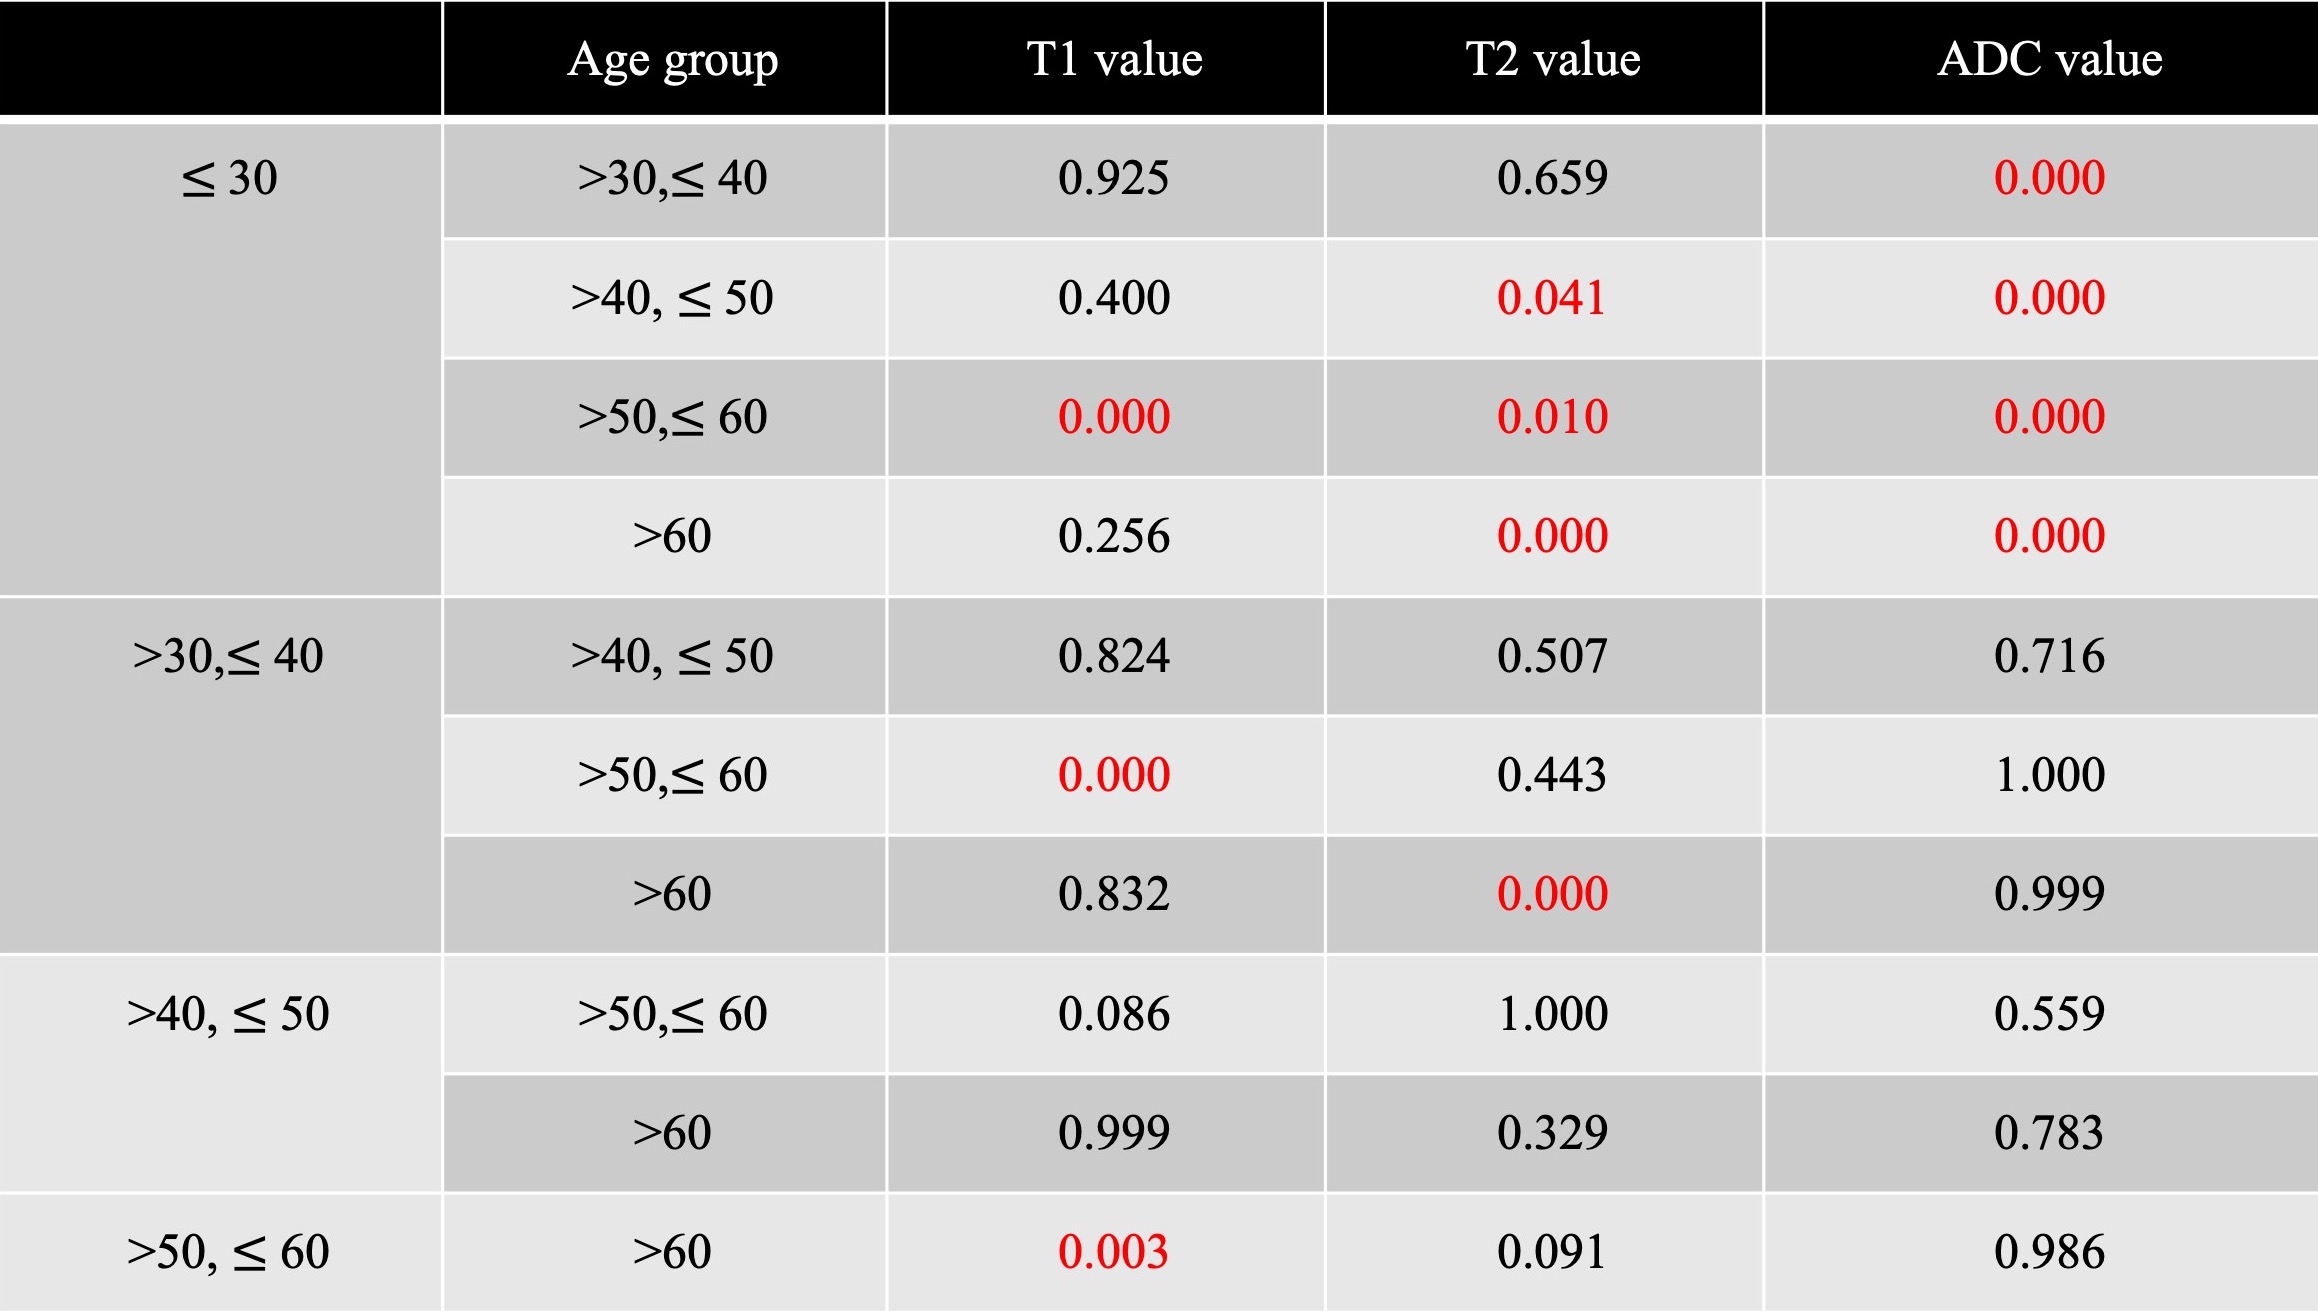
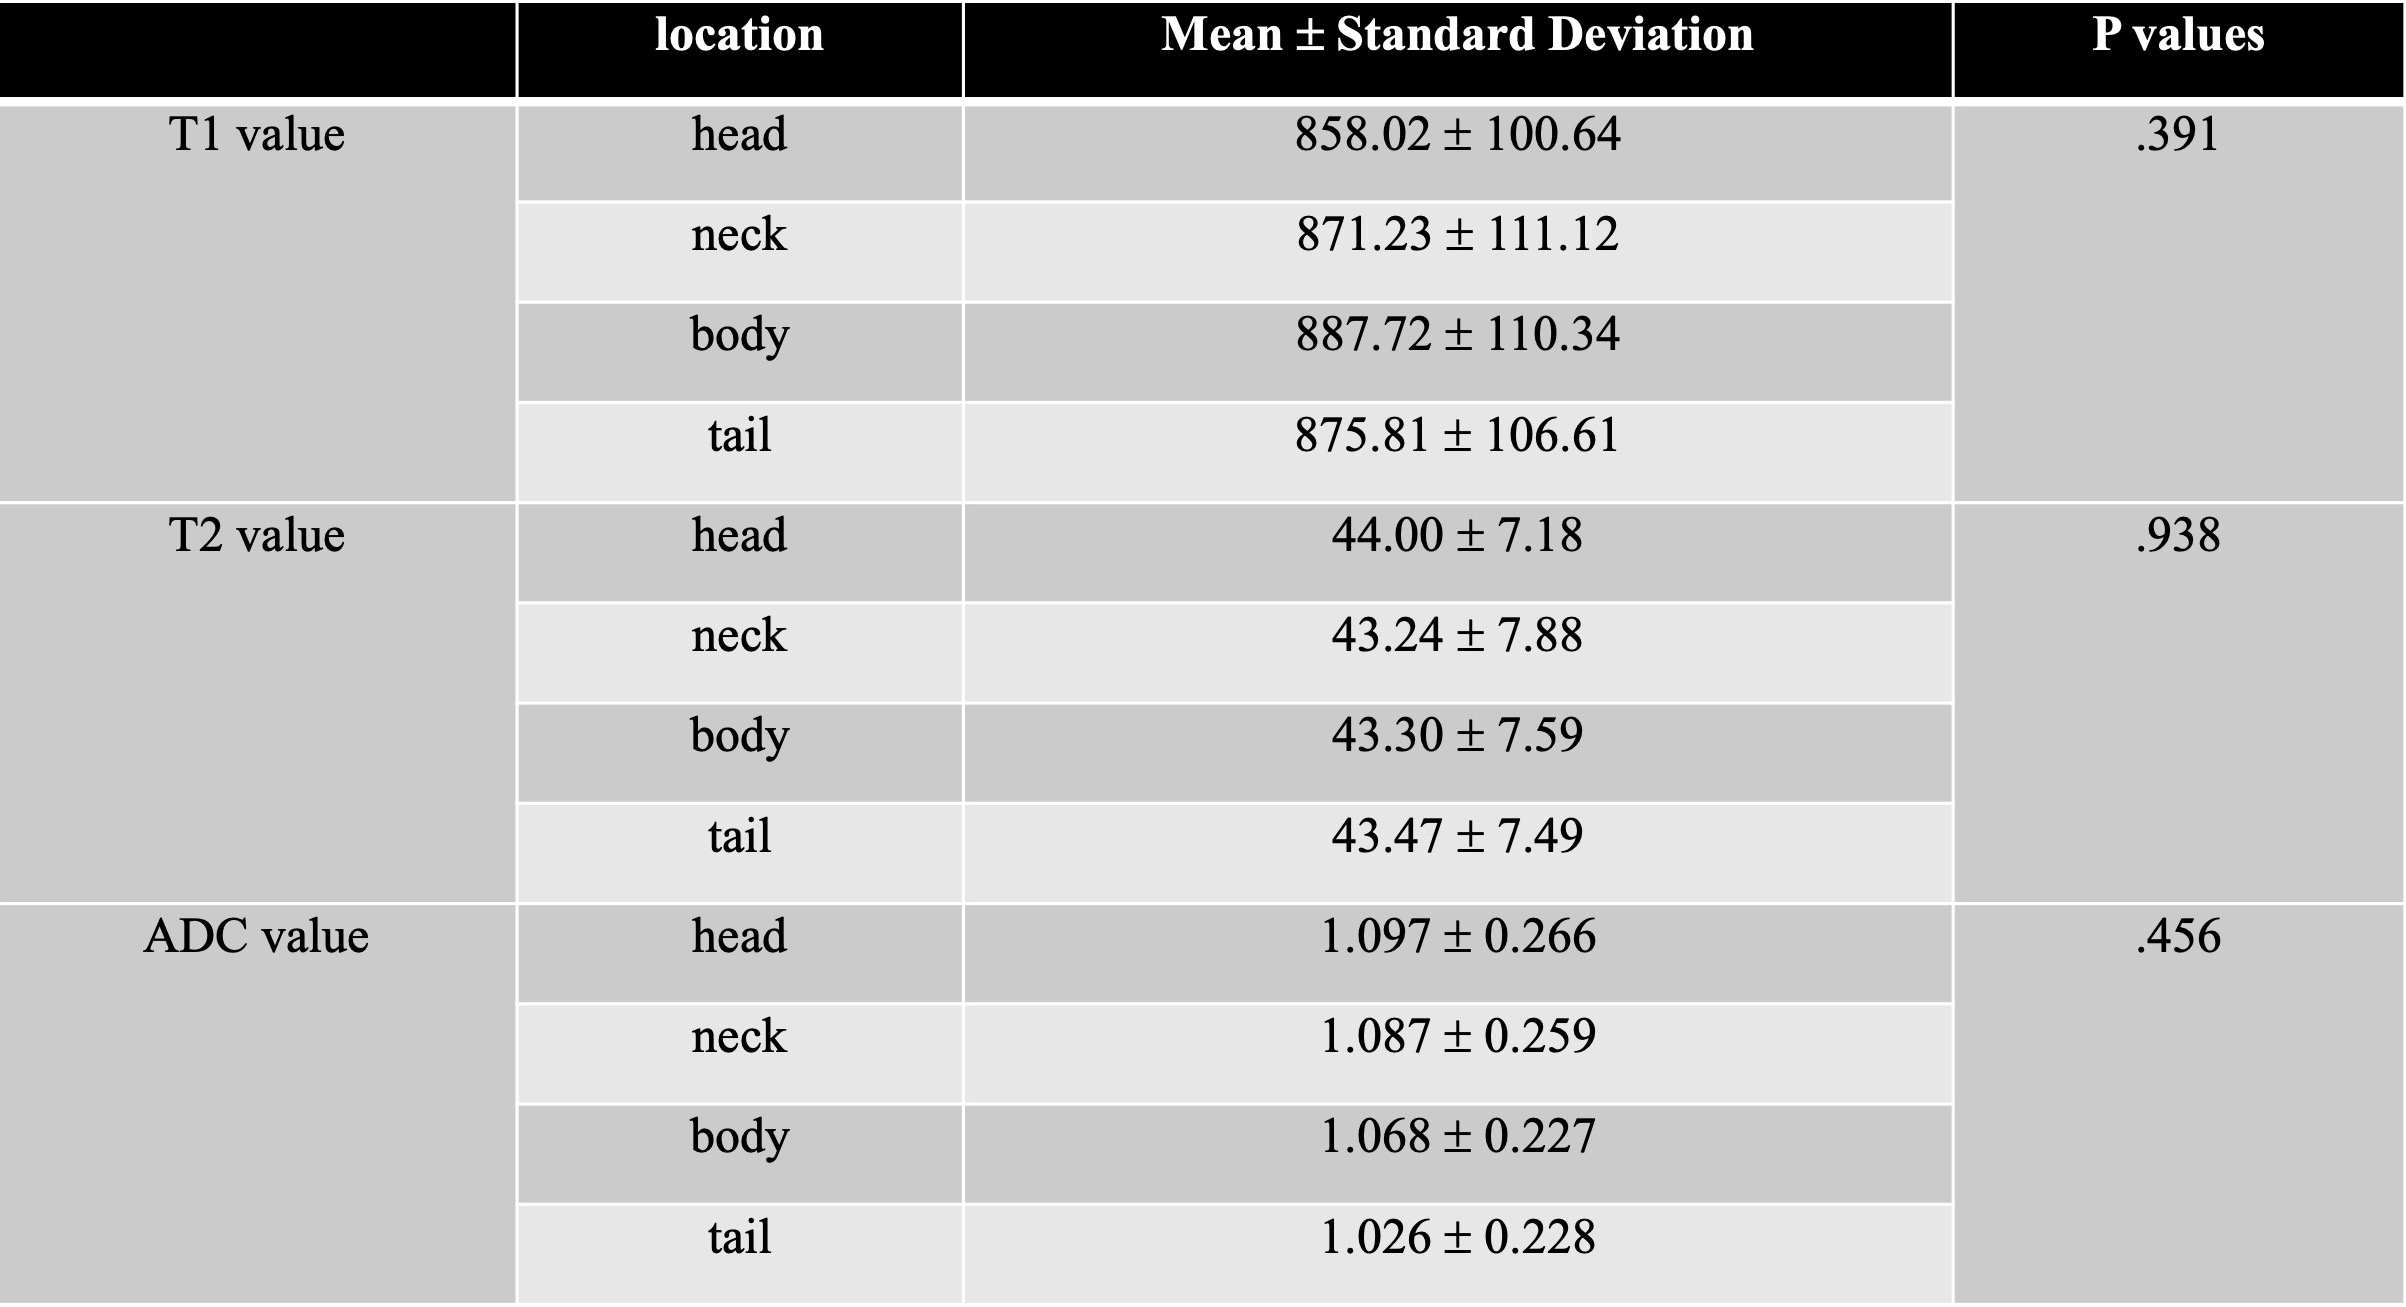
The T1, T2, and ADC values were 880.30 ± 91.33ms, 47.89 ± 2.93ms, (1.220 ± 0.171) ×10-3mm2/s respectively in healthy adult pancreas (Figure 1). The mean values and standard deviation (SD) of T1, T2, and ADC values in different gender, age group, different locations were listed in Table 1, 2, 4. T2 value between female and male showed significant differences (P < 0.05) (Figure 2). The T1, T2, and ADC values between different age groups showed significant differences (P = 0.000). The P values of multi-comparison between different age groups were listed in Table 3 and significant differences were listed in the upper of box (Figure 3). No significant differences were found between pancreatic locations (P > 0.05) in T1, T2 and ADC values (Figure 4). No significant difference was found in T1 values measured with MOLLI and VFA (870.5 ± 102.2ms vs 880.4 ± 119.3ms, P=0.069). However, T1-MOLLI showed significantly higher SNR than VFA based T1-mapping (P=0.008). The Pearson Correlation coefficients of T1, T2, and ADC values with ages were 0.234 (P = 0.000), -0.385 (P = 0.000), and -0.384 (P = 0.000) respectively (Figure 5).Discussion
Establishing the range of quantitative MR parameters in healthy adult pancreas is potentially useful to detect early abnormalities of the pancreas. Normal pancreas has lower ADC values and relaxation times than PDAC and chronic pancreatitis[5], resulting from dense exocrine tissue and packed serous acinar cells in normal pancreas. The results are consistent with our previous work[6]. Significance T2 difference was found between males and females. We also found that the T1 value of healthy adult pancreas reaches a maximum average value in the age group of 50-60 years, and then declined markedly with age, which is similar with the changes of normal pancreatic volume[7]. T2 and ADC values of healthy pancreas reach maximum in the age group of under 30 years. T2 value also showed a decreased trend and were negatively correlated with ages. These findings may be related to increased pancreatic fat and pancreatic atrophy with age.Conclusion
The range of MR tissue and functional parameters in healthy adult pancreas is potentially useful for the functional and metabolic research of pancreatic disease. The differences of quantitative parameters in different gender and age groups and the correlations of quantitative parameters with age show potential value for pancreatic screening and early detection of PDAC.Acknowledgements
We thank all the patients who participated in the study. In addition, we thank all radiologists and technicians who gave so much assistance with MR scan and the study.References
1. Hill, D.V. and Tirkes, T., Advanced MR Imaging of the Pancreas. Magn Reson Imaging Clin N Am, 2020. 28(3): p. 353-367.
2. Tirkes, T., Lin, C., Fogel, E.L., et al., T1 mapping for diagnosis of mild chronic pancreatitis. Journal of Magnetic Resonance Imaging, 2017. 45(4): p. 1171-1176.
3. Garcia, T.S., Rech, T.H., and Leitão, C.B., Pancreatic size and fat content in diabetes: A systematic review and meta-analysis of imaging studies. PLoS One, 2017. 12(7): p. e0180911.
4. DeSouza, S.V., Singh, R.G., Yoon, H.D., et al., Pancreas volume in health and disease: a systematic review and meta-analysis. Expert Rev Gastroenterol Hepatol, 2018. 12(8): p. 757-766.
5. Tirkes, T., Dasyam, A.K., Shah, Z.K., et al., Role of standardized reporting and novel imaging markers in chronic pancreatitis. Curr Opin Gastroenterol, 2021. 37(5): p. 512-519.
6. Wang, L., Gaddam, S., Wang, N., et al., Multiparametric Mapping Magnetic Resonance Imaging of Pancreatic Disease. Front Physiol, 2020. 11: p. 8.
7. Saisho, Y., Butler, A.E., Meier, J.J., et al., Pancreas volumes in humans from birth to age one hundred taking into account sex, obesity, and presence of type-2 diabetes. Clin Anat, 2007. 20(8): p. 933-42.
Figures
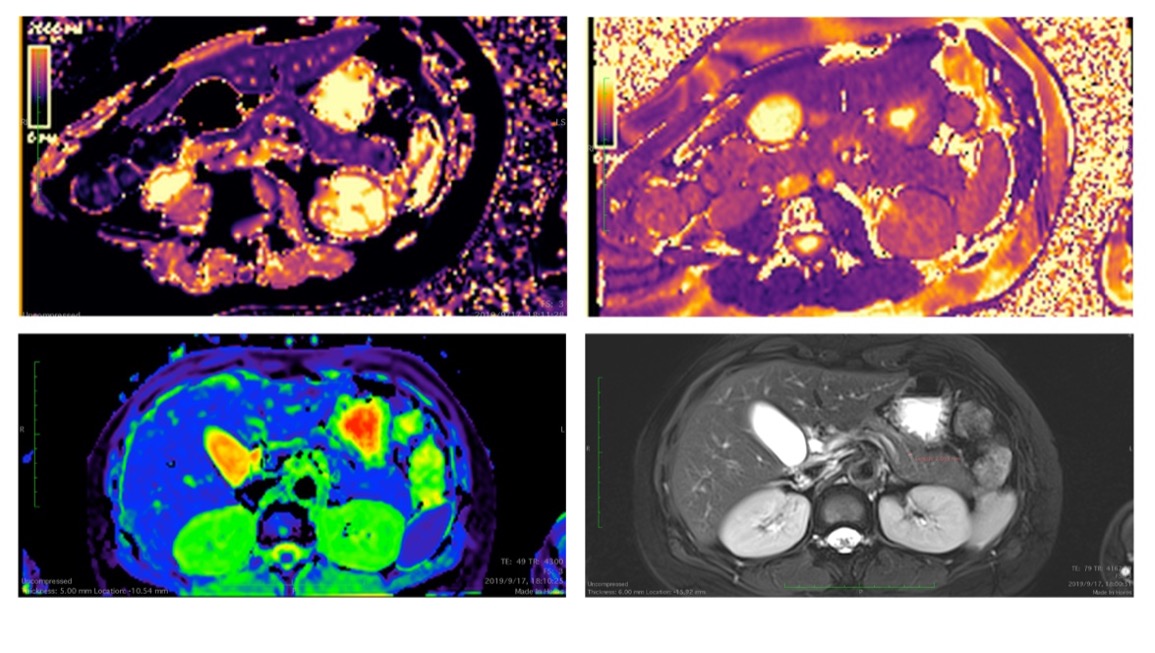
Figure 1 T1 mapping, T2 mapping, ADC map and T2WI of healthy adult pancreas. The value of T1, T2 and ADC values are 863.3 ± 30.7ms, 46.30 ± 6.6ms and (0.952 ± 0.300) ×10-3mm2/s respectively.