3977
Usefulness of quantitative MRI in the evaluation of pancreatic fibrosis1Department of Radiology, Kawasaki Medical School, Kurashiki, Japan
Synopsis
Keywords: Pancreas, Pancreas
We sought to clarify the value of quantitative MRI for evaluating pancreatic fibrosis. Longer T1 relaxation time and lower D within the pancreas parenchyma were significantly related to pancreatic fibrosis score based on histopathological evaluation. T1 relaxation time and D may be sensitive indicators of fibrosis within the pancreas parenchyma.INTRODUCTION
Stroma reaction leading to fibrosis is the most characteristic histopathological feature of both pancreatic carcinoma and chronic pancreatitis. Desmoplastic fibrosis in pancreatic carcinoma acts as a mechanical barrier, decreasing oxygenation and blood perfusion to the tumor impeding delivery and efficacy of chemotherapeutic agents. For chronic pancreatitis, early detection of morphological pancreatic damage, including fibrosis, loss of acinar and islet cells, and ductal changes may facilitate potential antifibrotic treatment and potentially reduce disease progression. However, characteristic features of early chronic pancreatitis are often absent in conventional qualitative imaging studies. Quantitative MRI offers several advantages, including quantitative measurement of the tissue relaxometry values, simplicity of analysis by allowing population-based comparisons, and cross-platform compatibility. However, the quantitative MRI that can sensitively assess fibrosis of the pancreatic parenchyma have not been fully clarified. Therefore, the purpose of this study was to clarify the value of quantitative MRI for evaluating pancreatic fibrosis.METHODS
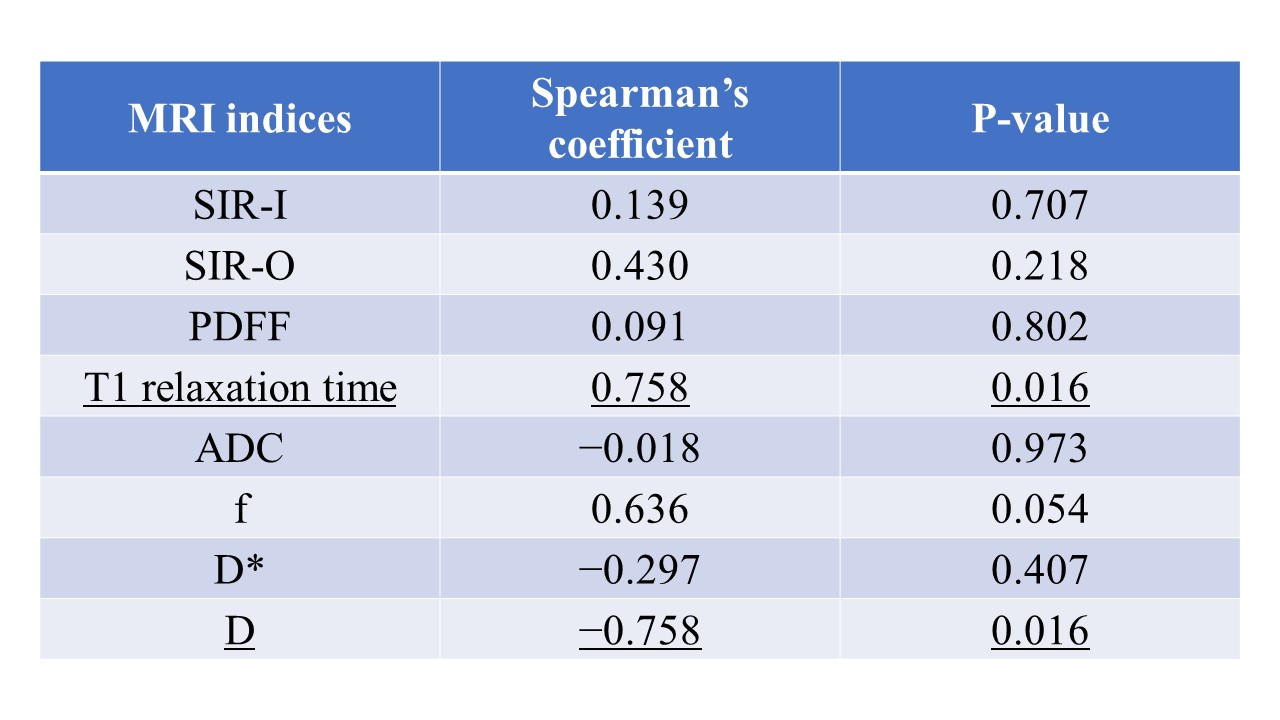
This study was approved by the local institutional review board, and all patients gave written informed consent. From May 2021 through April 2022, patients scheduled for pancreatectomy were prospectively enrolled. A total of 10 patients (mean age, 65.6±11.9 years), including 6 men (mean age, 69.3±6.0 years) and 4 women (mean age, 60.0±15.7 years), who underwent pancreatic MRI within 2 weeks prior to pancreatectomy were enrolled in this study. Pancreas tumors were histologically diagnosed as pancreatic ductal adenocarcinoma (n=6), intraductal-papillary mucinous tumor (n=3), and solid pseudopapillary neoplasm (n=3). Pancreatoduodenectomy was performed in 7 patients with tumors located in the head, and distal pancreatectomy was in 3 patients with pancreas tail tumors. MRI was performed using a 3-T scanner (Ingenia Elition; Philips Medical Systems) with a 32-channel phased-array coil. The MRI examinations included multi-echo 3D Dixon T1WI, T1-mapping images acquired using Look-Locker inversion recovery sequences, and single-shot echo-planar DWI with 2 b-values (0 and 1500 s/mm2) and 10 b-values (0, 25, 50, 75, 100, 150, 200, 500, 800, and 1000 s/mm2). The pancreas-to-muscle signal intensity ratios on in-phase imaging (SIR-I) and opposed-phase imaging (SIR-O), proton density fat fraction (PDFF) calculated with multi-echo 3D Dixon T1WI, T1 relaxation time on T1 map, ADC acquired using a monoexponential fitting with 2 b-values, and IVIM parameters (perfusion fraction (f), molecular diffusion coefficient (D), and perfusion-related diffusion coefficient (D*)) using the bi-exponential fitting model with the 10 b-values were measured using an ROI by two abdominal radiologists with 7 and 15 years of experience in consensus (Figs. 1 and 2). Histopathological evaluation of the surgical specimens in the area adjacent to resection margins was conducted by a pathologist. Azan-Mallory (AM) staining was utilized to evaluate the relative quantity of collagen. AM images were recorded as digital files and were processed using the color deconvolution function of ImageJ. Colors of aniline blue (indicating collagen fibers) and red staining were divided for the quantification of collagen fibers. After the threshold had been set manually, the percentage of pixels within the blue areas reflecting fibrosis was calculated from three randomly selected images per case, and the average value was used as the pancreatic fibrosis score. Spearman's rank correlation coefficient was performed to analyze the relationship between the quantitative MRI indices and the pancreatic fibrosis score.RESULTS
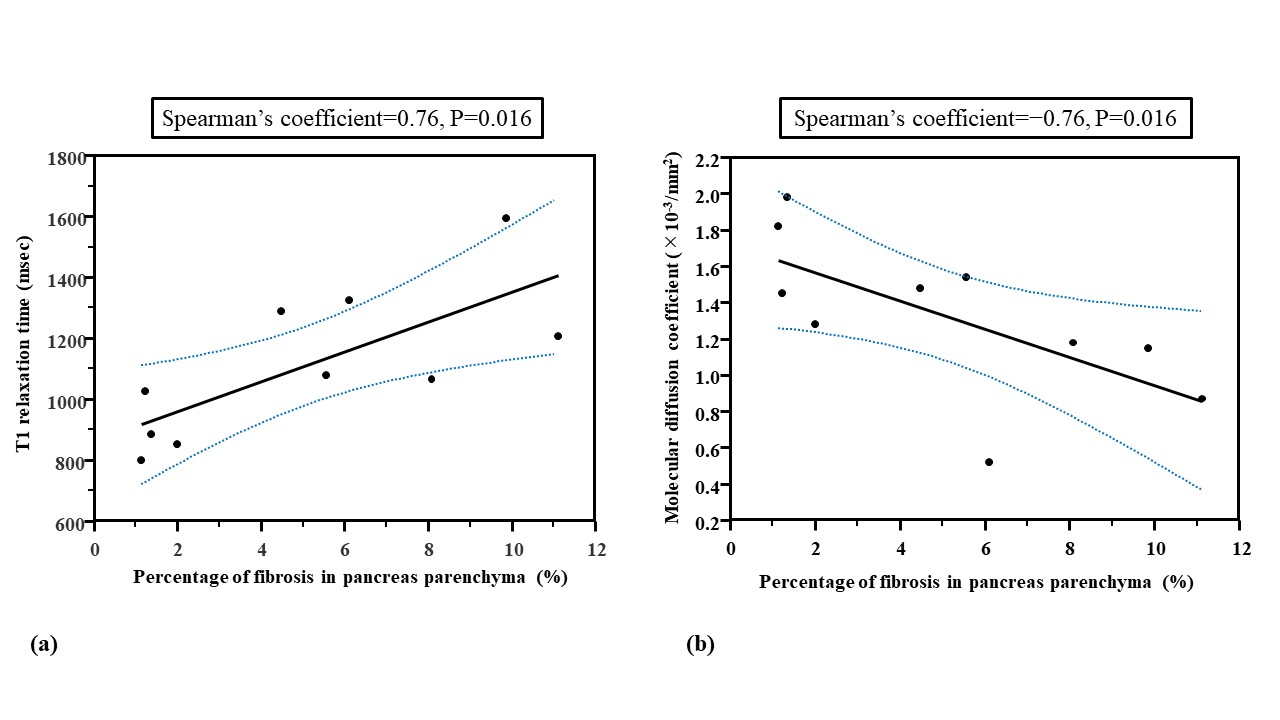
The quantitative MRI indices were as follows: SIR-I, 1.16±0.18; SIR-O, 1.46±0.44; PDFF, 6.85±5.88; T1 relaxation time, 1113.20±233.59; ADC, 1.18±0.18; f, 38.19±20.18; D*, 54.42±74.13; and D, 1.32±0.41. The pancreatic fibrosis score showed positive and negative relationships with T1 relaxation time (Spearman’s coefficient=0.76, P=0.016) and D (Spearman’s coefficient=−0.76, P=0.016), respectively (Figs. 3 and 4).DISCUSSION
In our study, T1 relaxation time and D within the pancreas parenchyma were significantly related to the pancreatic fibrosis score on the basis of histopathological evaluation. A previous study reported that the pancreas-to-muscle signal intensity ratio on T1WI of the pancreas parenchyma correlated with the degree of fibrosis1. In our study, however, the pancreas-to-muscle signal intensity ratio on in-phase and opposed-phase T1WI did not show any correlations with the degree of fibrosis. Recent investigations showed that T1 relaxation time of chronic pancreatitis or autoimmune pancreatitis was longer than that of the normal pancreas because the loss of acinar cells and the presence of inflammation or fibrosis are considered to be a source of longer T1 relaxation time1-4. Our results suggested that T1 mapping technique should be a more reliable and accurate method than the conventional T1-weighted techniques. D was reported to correlate with the degree of fibrosis within pancreatic adenocarcinoma, supporting our results5. Therefore, T1 relaxation time and D might be sensitive indicators of pancreatic fibrosis.CONCLUSION
T1 relaxation time and molecular diffusion coefficient measurement may be useful for the evaluation of pancreatic fibrosis.Acknowledgements
No acknowledgement found.References
1. Tirkes T, Lin C, Fogel EL, et al. T1 Mapping for Diagnosis of Mild Chronic Pancreatitis. J Magn Reson Imaging 2017;45(4):1171-6.
2. Tirkes T, Yadav D, Conwell DL, et al. Quantitative MRI of chronic pancreatitis: results from a multi-institutional prospective study, magnetic resonance imaging as a non-invasive method for assessment of pancreatic fibrosis (MINIMAP). Abdom Radiol (NY) 2022;47(11):3792-805.
3. Wang M, Gao F, Wang X, et al. Magnetic Resonance Elastography and T1 Mapping for Early Diagnosis and Classification of Chronic Pancreatitis. J Magn Reson Imaging 2018;48(3):837–45.
4. Zhu L, Lai Y, Makowski M, et al. Native T1 mapping of autoimmune pancreatitis as a quantitative outcome surrogate. Eur Radiol 2019;29(8):4436-46.
5. Hecht EM, Liu MZ, Prince MR, Jambawalikar S, et al. Can diffusion-weighted imaging serve as a biomarker of fibrosis in pancreatic adenocarcinoma? J Magn Reson Imaging 2017;46(2):393-402.
Figures
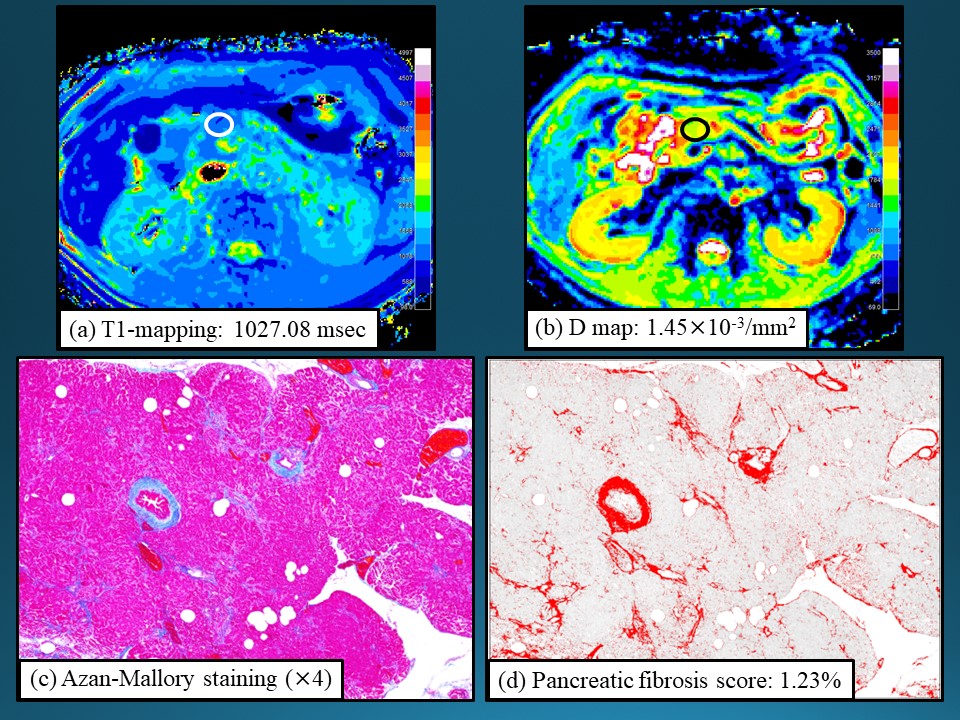
Fig. 1. A 74-year-old man with pancreatic ductal adenocarcinoma and mild fibrosis of the underlying pancreas parenchyma. ROIs are placed in the head of the pancreas parenchyma on the T1 (a, white oval) and D maps (b, black oval). A histological specimen stained with Azan-Mallory (c) shows colors of aniline blue (indicating collagen fibers) and red staining. The calculated percentage of pixels within the blue areas (red on d) as pancreatic fibrosis score was 1.23%.
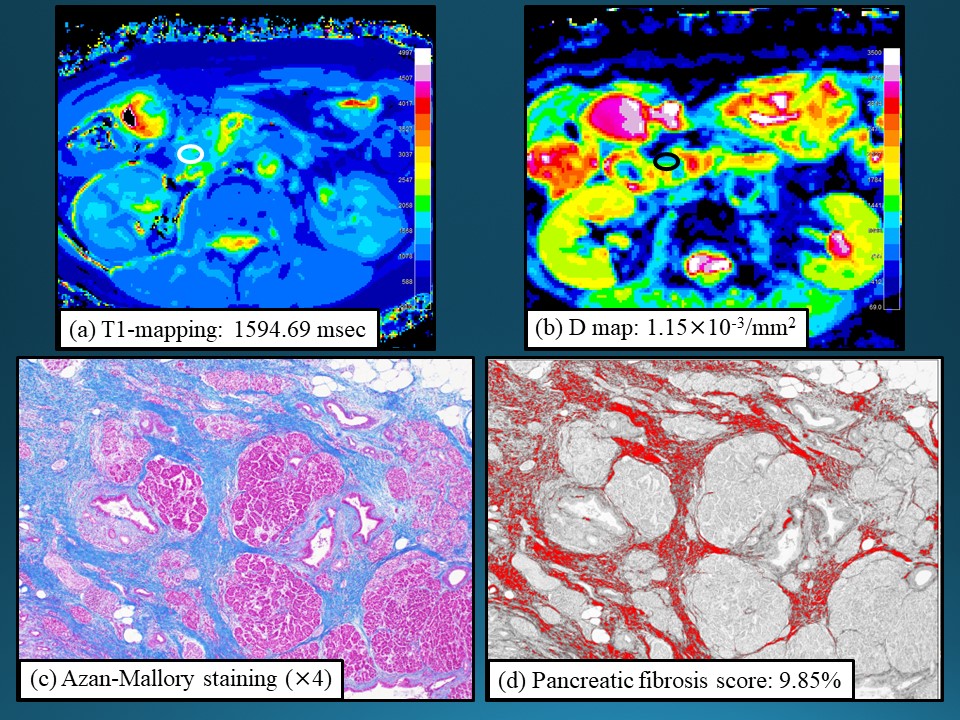
Fig. 2. A 66-year-old woman with pancreatic ductal adenocarcinoma and severe fibrosis of the underlying pancreas parenchyma. ROIs are placed in the head of the pancreas parenchyma on the T1 (a, white oval) and D maps (b, black oval). A histological specimen stained with Azan-Mallory (c) shows a large staining area of aniline blue reflecting abundant collagen fibers. The calculated percentage of pixels within the blue areas as pancreatic fibrosis score was 9.85% (d).