3975
Unpaired Super-Resolution for Anisotropic MRI using a Gradient Mapping Adversarial Loss1University College London, London, United Kingdom
Synopsis
Keywords: Digestive, Body
We present a novel approach to synthesise high-resolution isotropic 3D abdominal MR images, from anisotropic 3D images in an unpaired fashion. Using a modified CycleGAN architecture with a novel gradient mapping loss, we leverage disjoint patches from the high-resolution (in-plane) data of an anisotropic volume to enforce the network generator to increase the resolution of the low-resolution (through-plane) slices. This will enable accelerated whole-abdomen scanning with high-resolution isotropic images within short breath-hold times.Introduction
3D breath-hold imaging is a rapid method of assessing the abdominal anatomy, however anisotropic imaging with thick slices, is often required to enable the acquisition within a reasonable breath hold time. In this paper we have developed an unpaired approach to perform super-resolution of anisotropic MRI data to generate isotropic volumes. To achieve this we have implemented a novel adversarial loss, consisting of a cycle-consistent gradient mapping in order to enhance structural details and perceptual quality of abdominal MR images.Methodology
Dataset and Pre-ProcessingAnisotropic 3D T1-weighted data was retrospectively collected from 26 patients. Images were collected in the coronal plane using a volume-interpolated breath-hold (VIBE) sequence, after injection of gadolinium contrast. Whole abdominal coverage was achieved in a breath-hold of $$$\approx 21$$$s, with the following parameters: pixel size $$$\approx 1.3 \times 1.3 \times 6$$$mm, matrix size $$$\approx 256 \times 256$$$ and partitions $$$\approx 45$$$.
Each volume was interpolated to create isotropic pixels. Training and validation data were created by extracting 2D slices of size $$$92 \times 92 \times 92$$$ pixels, in both the coronal (originally high-resolution in both directions) and sagittal planes (low resolution in the AP-direction). This resulted in a total of 2391 unpaired data sets, which were used for training ($$$90\%$$$) and validation ($$$10\%$$$).
CycleGAN
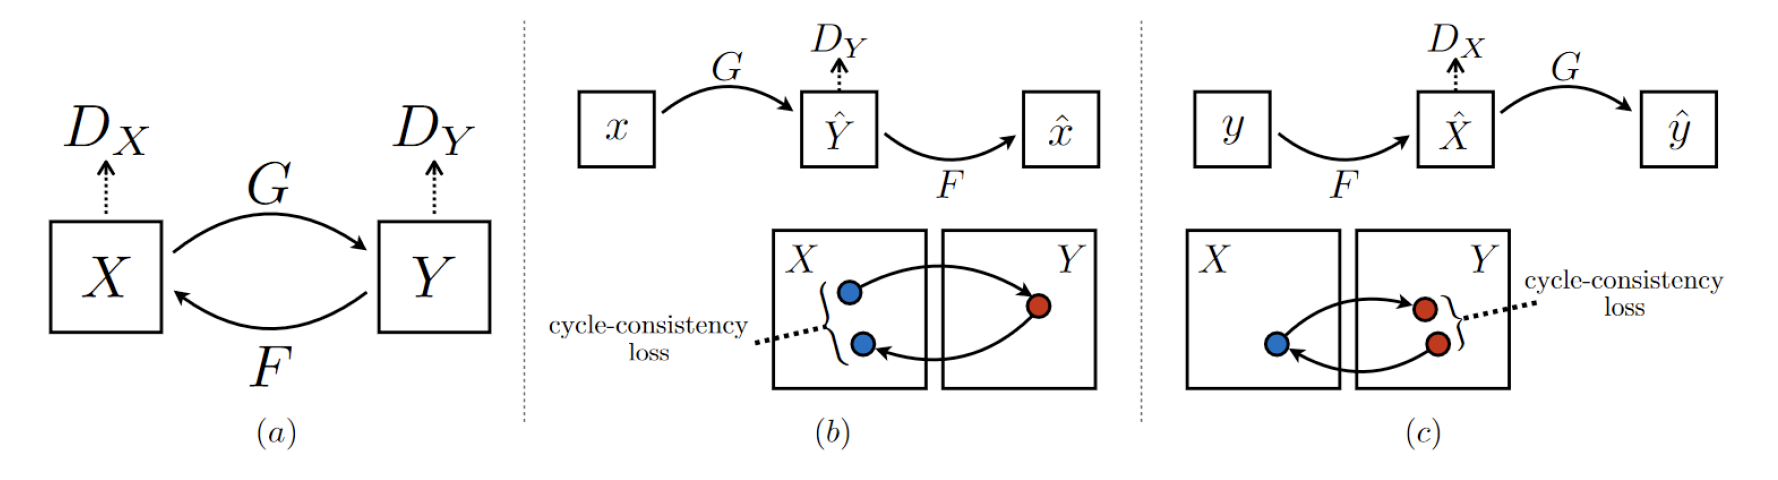
The CycleGAN1 architecture (see Fig.1a) is a variant of a Generative Adversarial Network (GAN) that imposes a Cycle-Consistency Loss in order to perform image-to-image translation with unpaired data. Here, the goal of the CycleGAN is to take low-resolution (LR) sagittal images ($$$X$$$) and translate them to high-resolution (HR) coronal images ($$$Y$$$), through a generator mapping, $$$G: X \rightarrow Y$$$.
Gradient Mapping Cycle-Consistency Loss
The Cycle-Consistency Loss (Fig.1b and 1c) is necessary as the generator mappings $$$G$$$ and $$$F$$$ are severely under constrained. To mitigate this, an inverse mapping is introduced which enforces $$$F(G(X)) \approx X$$$. In this study we developed a novel Cycle-Consistency Loss (See $$$\mathcal{L}_{\text {gmap }}(G, F)$$$ below) that works by imposing a "Gradient Mapping" between the gradient maps of input images $$$(x, y)$$$ and "cycled" images $$$(F(G(x)), G(F(y)))$$$, respectively2.
$$\begin{aligned}\mathcal{L}_{\text {gmap }}(G, F) &=\mathbb{E}_{x \sim \text { pdata }}(x)\left[\| S_x(F(G(x)))-S_x(x)\right.\\&\left.+S_y(F(G(x)))-S_y(x) \|_1\right] \\&+\mathbb{E}_{y \sim \text { pdata }}(y)\left[\| S_x(G(F(y)))-S_x(y)\right.\\&\left.+S_y(G(F(y)))-S_y(y) \|_1\right]\end{aligned}$$
Above, $$$S_x$$$ and $$$S_y$$$ denote the $$$x$$$ and $$$y$$$ gradients acquired using a Sobel Operator and $$$||\cdot||_{1}$$$ denotes an $$$L_{1}$$$ loss. The final loss function is then defined as follows:
$$
\begin{equation}\begin{aligned}\mathcal{L}_{\text {total}}(G, F) &=\lambda_{cyc} L_{cyc} + \lambda_{gmap}L_{gmap},\label{eq:final_loss}\end{aligned}\end{equation}
$$
where $$$L_{cyc}$$$ denotes the original Cycle-Consistency Loss1 and $$$\lambda_{cyc}, \lambda_{gmap}$$$ denote loss weights for the Cycle-Consistency and Gradient Mapping losses respectively.
Patch Reconstruction Algorithm
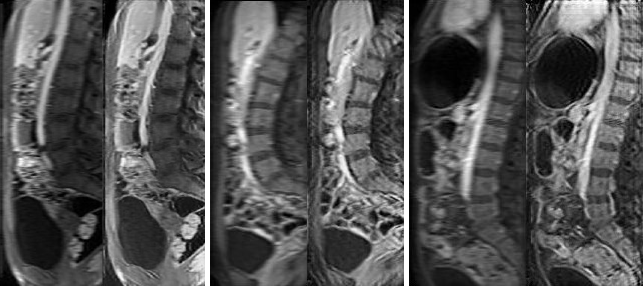
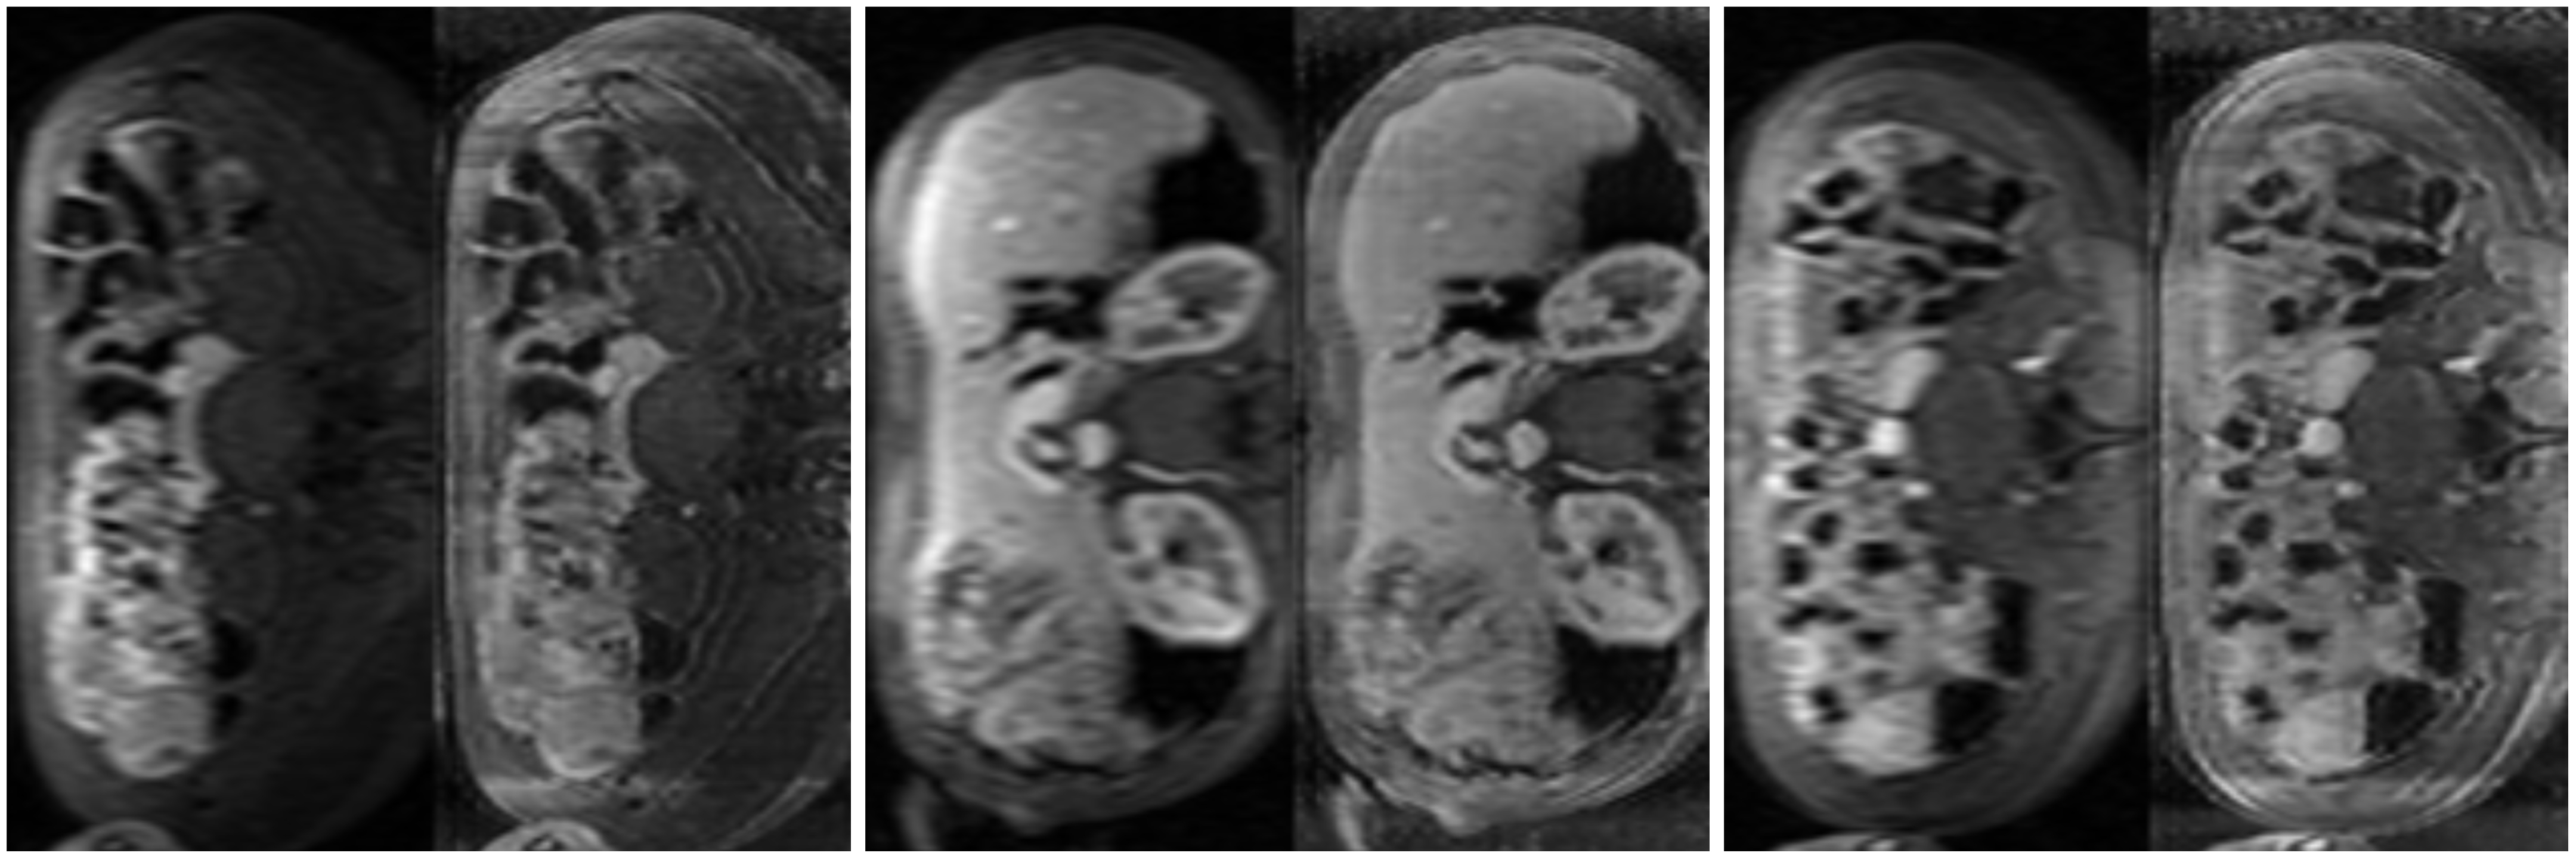
The trained network can be applied to unseen prospective data which is not of fixed size (examples of these full-size images are shown on the left of each image pair in Fig. 2). To reconstruct a full 2D slice of shape $$$m \times n$$$, we use an overlapping patch reconstruction algorithm. Each overlapping patch is passed through our network to produce a corresponding HR patch of the same size. These patches are then stitched together to produce a reconstructed HR image from the overlapping patches.
Quantitative Metric
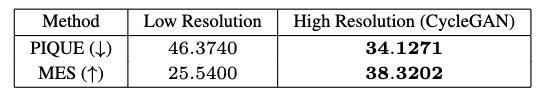
Quantitative image quality was measured by calculating edge sharpness (ES) and the Perception Based Image Quality Evaluator (PIQUE)3 (as a no-reference image quality score). ES was calculated by measuring the maximum gradient of the pixel intensities across the border of the bladder4.
Qualitative Metric
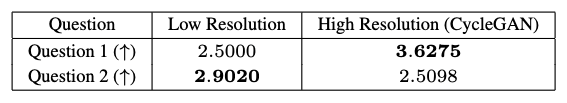
Qualitative image scoring was performed by two MR specialists (VM and JS) in one sitting. Three sagittal slices were extracted for the original data (high resolution in HF dimension, and low resolution in the AP dimension), and for the super-resolved data.
Images were viewed in a random order and scored in two categories:
- Global image quality (sharpness and delineation of anatomic features)
- Image artefacts (observers’ confidence that any artefacts aren't hallucinated)
Results
Quantitative and Qualitative ResultsBoth quantitative and qualitative scores were used in order to measure the performance of our model.
PIQUE analysis of the data in Figure 4 showed the original data quality as "fair" ($$$46.3740$$$), which was improved after super-resolution to "good" ($$$34.1271$$$)5. ES also improved after application of the CycleGAN super-resolution. Qualitative scores in Figure 5 also demonstrated a significant improvement in overall image sharpness, however with more image artefacts - this can be seen visually in Figure 2.
Conclusions
Our initial results demonstrate that it is possible to perform ML super resolution without paired data. Our method relies on the idea that a patch in the high-resolution coronal plane has similar structures to a low-resolution sagittal patch, enabling the use of unpaired learning paradigm. The CycleGAN performs well on a relatively small training dataset with significant improvement in perceptual image quality and edge sharpness. However, there was a slight increase in artefacts, probably due to sharpening of ghosting and noise. Nevertheless, we believe this approach has potential in improving image quality for abdominal imaging.Acknowledgements
This work was supported by UK Research and Innovation (MR/S032290/1).References
1. Zhu, J., Park, T., Isola, P., & Efros, A. A. Unpaired Image-to-Image Translation Using Cycle-Consistent Adversarial Networks. 2017 IEEE International Conference on Computer Vision (ICCV). 2017; doi:10.1109/iccv.2017.244
2. Lusine Abrahamyan, Anh Minh Truong, Wilfried Philips,and Nikos Deligiannis. Gradient variance loss for structure-enhanced image super-resolution, 2022; doi:10.48550/ARXIV.2202.00997
3. Venkatanath N, Praneeth D, Maruthi Chandrasekhar Bh,Sumohana S. Channappayya, and Swarup S. Medasani. Blind image quality evaluation using perception based features. In 2015 Twenty First National Conference on Communications(NCC), pages 1–6, 2015; doi:10.1109/NCC.2015.7084843
4. Jennifer A. Steeden, David Atkinson, Michael S. Hansen, Andrew M. Taylor, and Vivek Muthurangu. Rapid flow assessment of congenital heart disease with high-spatiotemporal-resolution gated spiral phase-contrast mr imaging. Radiology,260(1):79–87, 2011. PMID: 21415248; doi:10.1148/radiol.11101844
5. Sheikh H. R., Z. Wang, L. Cormack, and A.C. Bovik. ”LIVE Image Quality Assessment Database Release 2”. https://live.ece.utexas.edu/research/quality/
Figures