3973
Incorporating Tissue and Blood Relaxometry For Estimating IVIM Parameters: A Simulation Study
Yousef Mazaheri1
1Memorial Sloan Kettering Cancer Center, New York, NY, United States
1Memorial Sloan Kettering Cancer Center, New York, NY, United States
Synopsis
Keywords: Signal Representations, Diffusion/other diffusion imaging techniques, IVIM
The aim of this aim of this study is to use numerical simulation to compare the performance of the standard bi-exponential IVIM model to an extended model which incorporates tissue and blood relaxometry for the estimation of IVIM parameters.Synopsis
This aim of this study is to use numerical simulation to compare the performance of the standard bi-exponential IVIM model to an extended model which incorporates tissue and blood relaxometry for the estimation of IVIM parameters.INTRODUCTION
The intravoxel incoherent motion (IVIM) biexponential model has been proposed to characterize both microcirculation of blood in the capillaries and small vessels as well as restricted diffusion. Simulation studies by Pekar [1] and others have suggested that reliable estimated of the perfusion coefficient, D*, and perfusion fraction, f, requires substantial SNR. If IVIM diffusion parameters are to be clinically useful, they must be robust and reliable. Here, we compare IVIM parameters obtained with the standard model to a model which incorporates tissue and blood relaxometry for estimating IVIM parameters to determine the potential advantages of the alternative model.METHODS
Simulations Monte Carlo (MC) simulations were performed to determine confidence in parameters derived from analysis of alternative diffusion models. Ideal signal intensity data were generated using the protocol shown in Table 1. The simulations were performed assuming that in vivo signal is bi-exponential, with parameters set to f = 0.05-0.4, D= 0.001-0.0025 ×10⁻³ mm2/s, and D*= 0.01-0.025 ×10⁻² mm2/s. The standard IVIM experiment consists of a DWI acquisition with fixed TR, TE, =0, and a range of b-values. The IVIM-relaxation experiment consists of a slice-selective inversion recovery (IR) preparation is used prior to the DW-EPI acquisition with varied TI for T1 relaxometry and varied TE for T2 relaxometry. In all simulations, signal intensity decay curves weigthed by the T1 and T2 relaxation of tissue and blood.For the simulations, noise was added to the signal to generate instances with the SNR ranging from 10-150. The noise-added data were fitted with the bi-exponential IVIM and IVIM-relaxation models. Five thousand simulations were performed at each of 5 different noise levels.
RESULTS
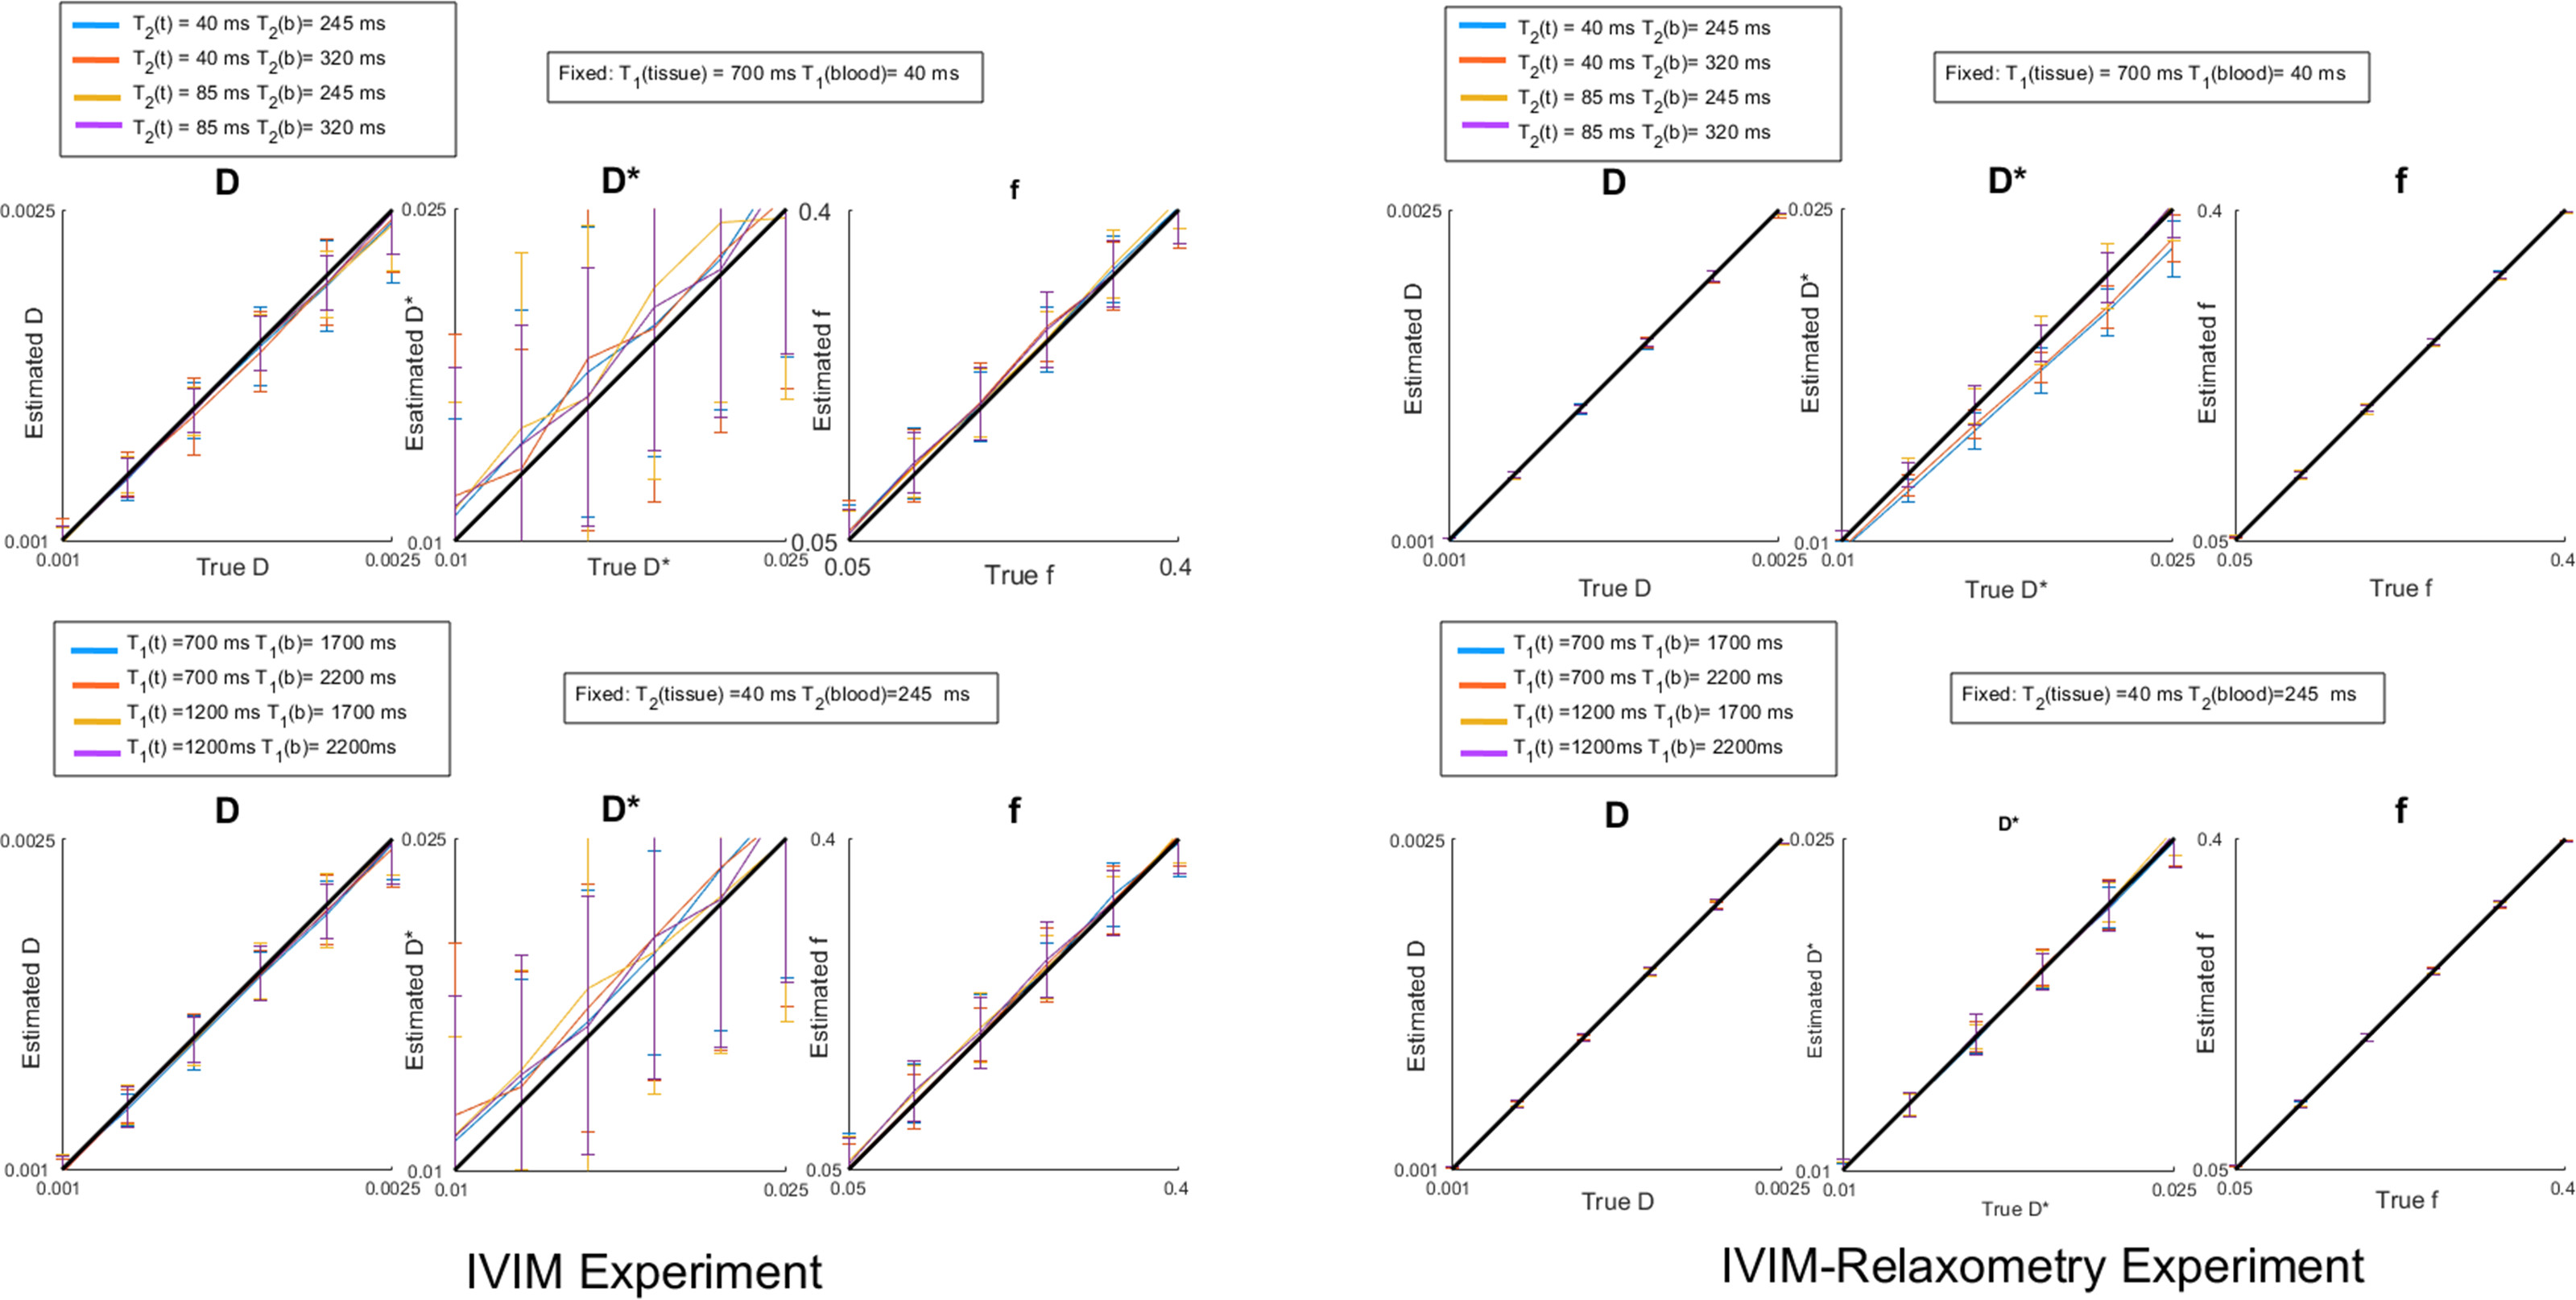
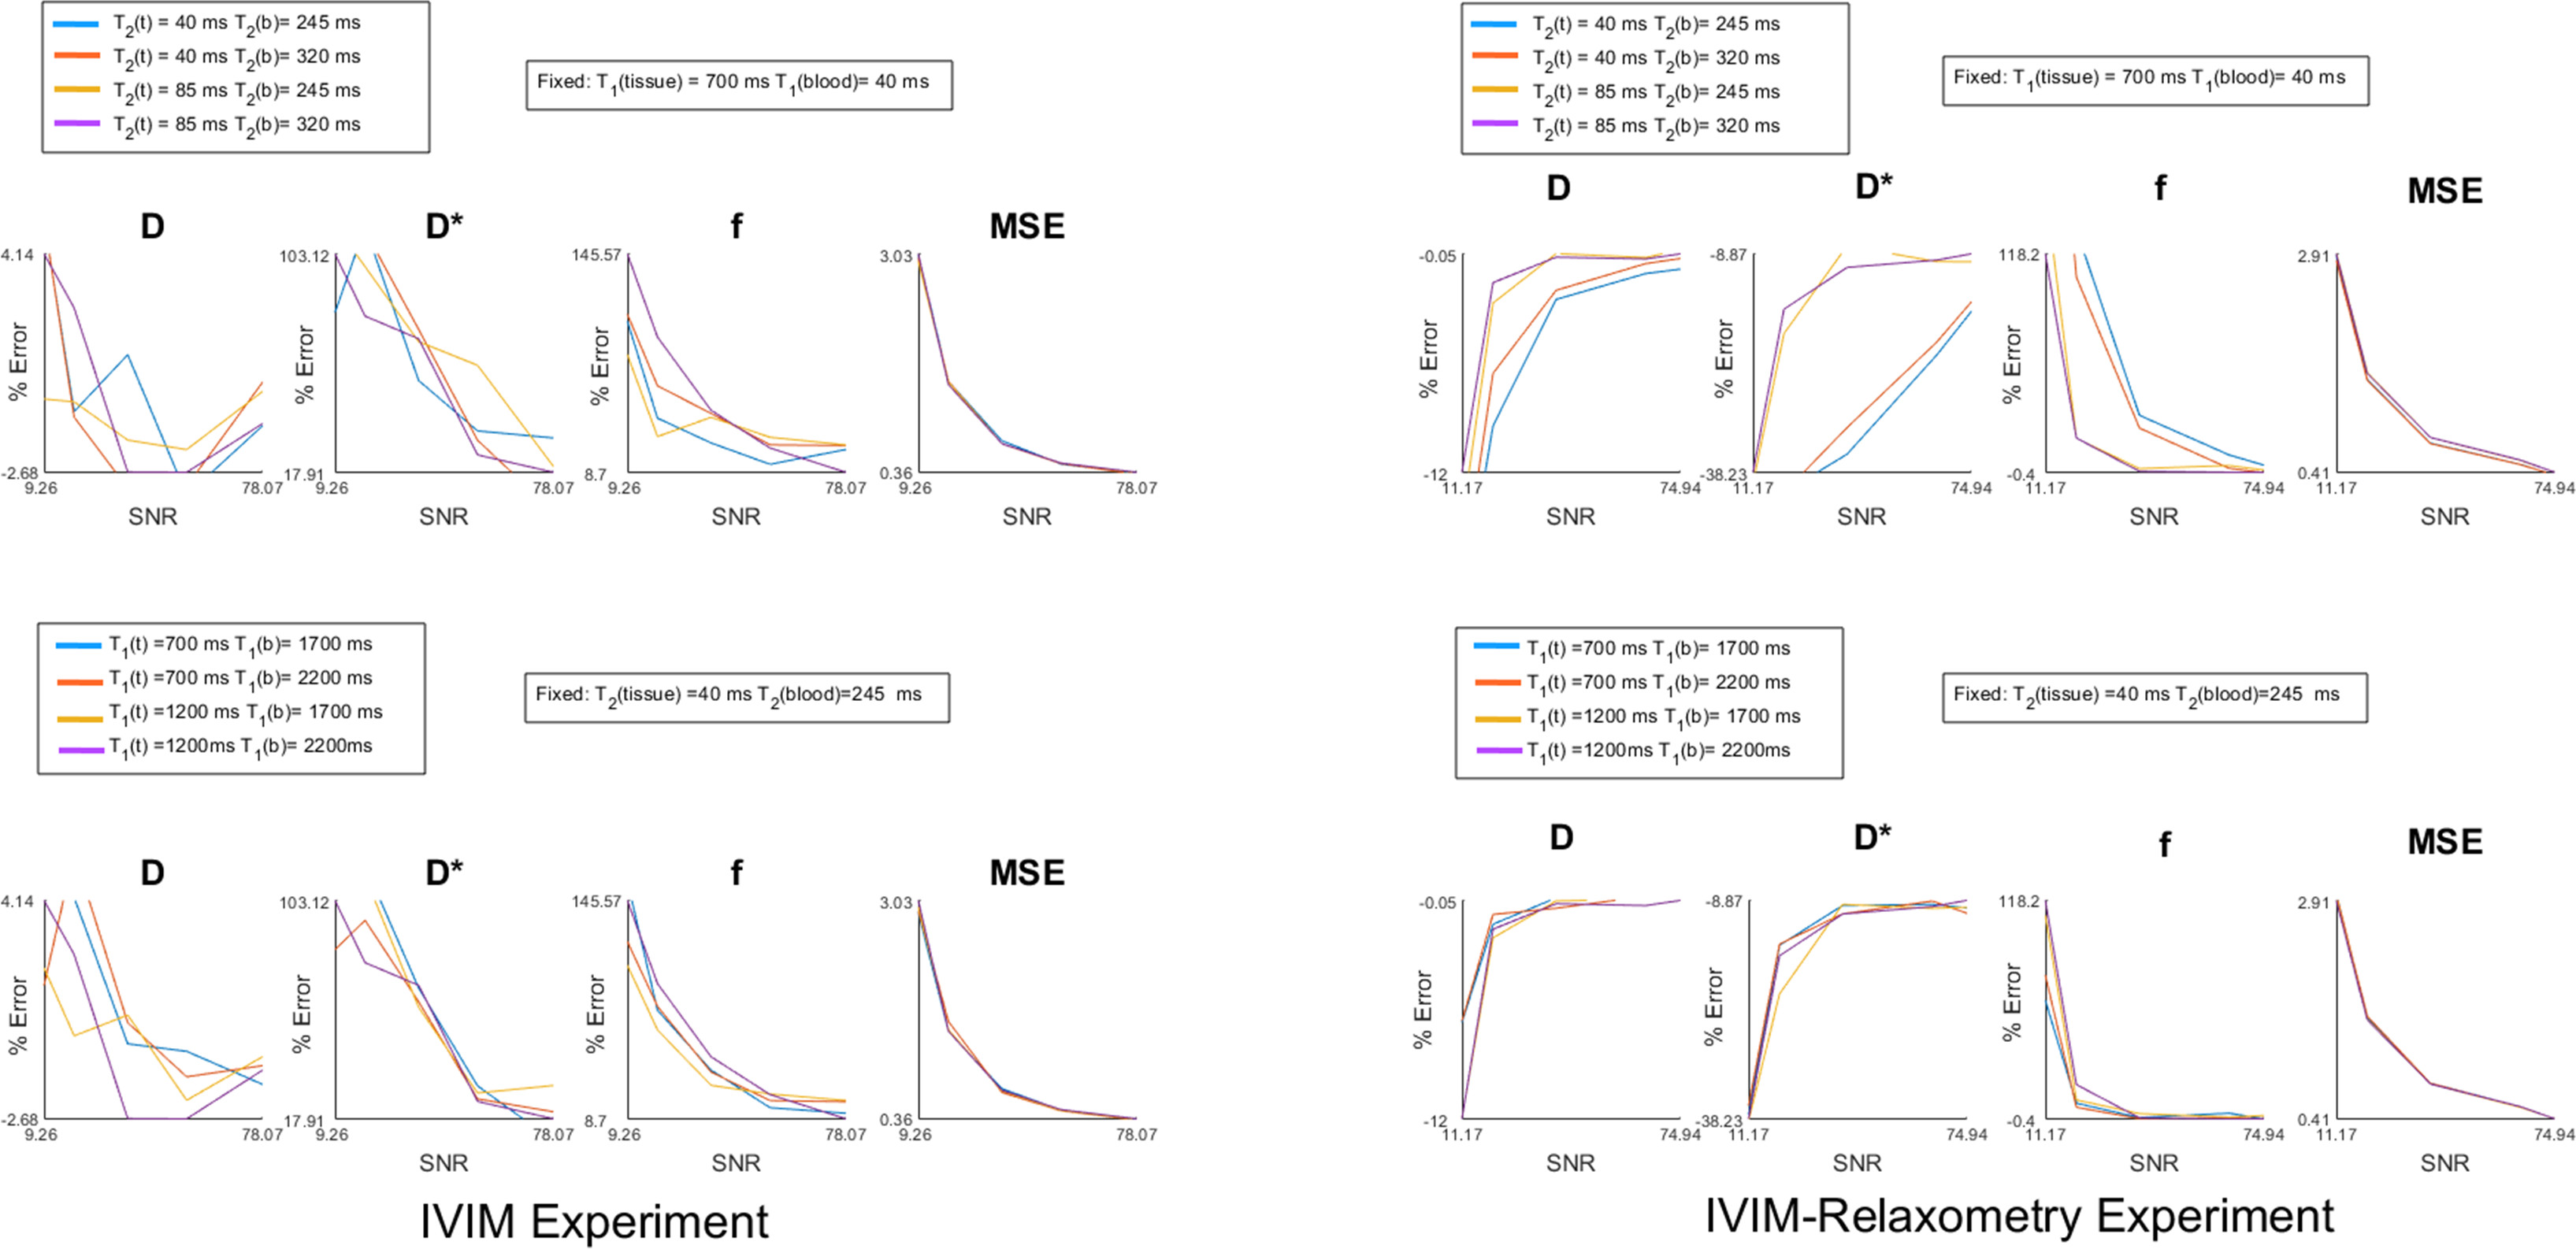
Figure 1 is a comparison of estimated IVIM parameters to their corresponding true values from both the standard IVIM experiment (left) and the IVIM-relaxometry experiment (right). The simulations were performed for pairs of tissue and blood T2 (while the T1 were kept constant) (top row), add for pairs of tissue and blood T2 (while the T2 were kept constant) (bottom row). The SNR was held constant (SNR=40). There is improvement in precision of all parameters but most noticeable in the estimate of D* and f. Figure 2 shows maps of estimated parameters for SNR = 150 (top row), 40 (middle row) and 10 (bottom row) for standard IVIM experiment (left) and IVIM-relaxometry experiment (right), respectively. As expected, at high SNR, the variability of the estimated IVIM parameters is low, including D* and f. At moderate (middle row) and low SNR (bottom row), D* and f are highly overestimated. For the relaxometry experiment, the maps indicate that D* is moderately underestimated. Figure 3 shows comparison of % Error of the parameters as a function of SNR, consistent with results presented in the maps. At errors associated with the standard IVIM experiment for D* and f at low to moderate SNR are large and the values are overestimated. In comparison, there is substantial decrease in % Error for these parameters in the IVIM-Relaxometry experiment.DISCUSION AND CONCLUSION
Lemke [2] showed that the f value of normal pancreatic tissue increased with an increase in the TE value, and they suggested that TE values had a greater effect on tissue with a short T2 relaxation time. Our simulation results suggest that for the range of tissue and blood T1 and T2 relaxation values used, performing experiments which are sensitive to both tissue diffusion as well as tissue/blood relaxometry can have a substantial impact on the accuracy and precision of D* and f. The simulations presented are based on the premise that incorporation relaxometry (T1 and T2 estimates of tissue and blood) for the estimation of IVIM parameters can enhance the ability of the acquired data to disentangle different vascular and tissue compartments within a voxel. This approach was previously investigated on healthy subjects to obtain estimates of IVIM parameters with reduced sensitivity to partial volume effects [3]. Acquisition of such datasets within a reasonable acquisition time is a challenge and would require optimization of the acquisition points.FIGURES
Table 1. IVIM and IVIM-relaxometry parameters. For the IVIM experiment, TI and TE are held constant, and diffusion-weighted data are sampled at various b-values. For the IVIM-relaxometry experiment, data are sample at varies parameters for TI, TE, and b-value.Figure 1. Comparison of estimated IVIM parameters (D, D*, and f) to their corresponding true values form the standard IVIM experiment (left) and the IVIM-relaxometry experiment (right). SNR=40.
Figure 2. Maps of estimated parameters for SNR = 150 (top row), 40 (middle row) and 10 (bottom row) for standard IVIM experiment (left) and IVIM-relaxometry experiment (right), respectively.
Figure 3. Comparison of % Error of the parameters as a function of SNR for standard IVIM experiment (left) and IVIM-relaxometry experiment (right).
Acknowledgements
No acknowledgement found.References
1. Pekar J, et al. On the precision of diffusion/ perfusion imaging by gradient sensitization. Magn Reson Med. 1992;23:122-129.
2. Lemke A, et al. Differentiation of pancreas carcinoma from healthy pancreatic tissue using multiple b-values: comparison of apparent diffusion coefficient and intravoxel incoherent motion derived parameters. Invest Radiol. 2009;44:769-775.
3. Rydhög A, et al. Estimation of diffusion, perfusion and fractional volumes using a multicompartment relaxation-compensated intravoxel incoherent motion (IVIM) signal model. European Journal of Radiology Open 6 (2019) 198–205.
Figures
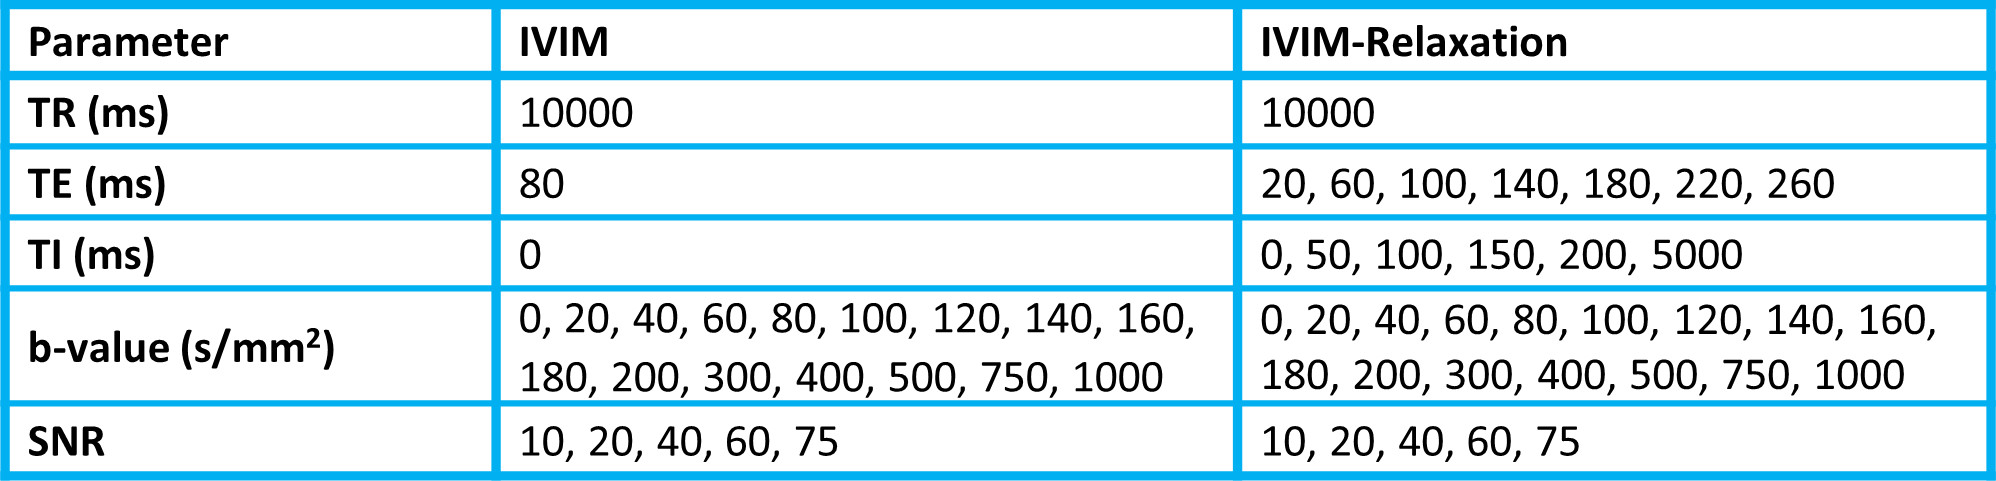
Table 1. IVIM
and IVIM-relaxometry parameters. For the IVIM experiment, TI and TE are held
constant, and diffusion-weighted data are sampled at various b-values. For the
IVIM-relaxometry experiment, data are sample at varies parameters for TI, TE,
and b-value.
Figure
1. Comparison of estimated IVIM parameters (D, D*,
and f) to their corresponding true values form the standard IVIM experiment
(left) and the IVIM-relaxometry experiment (right). SNR=40.
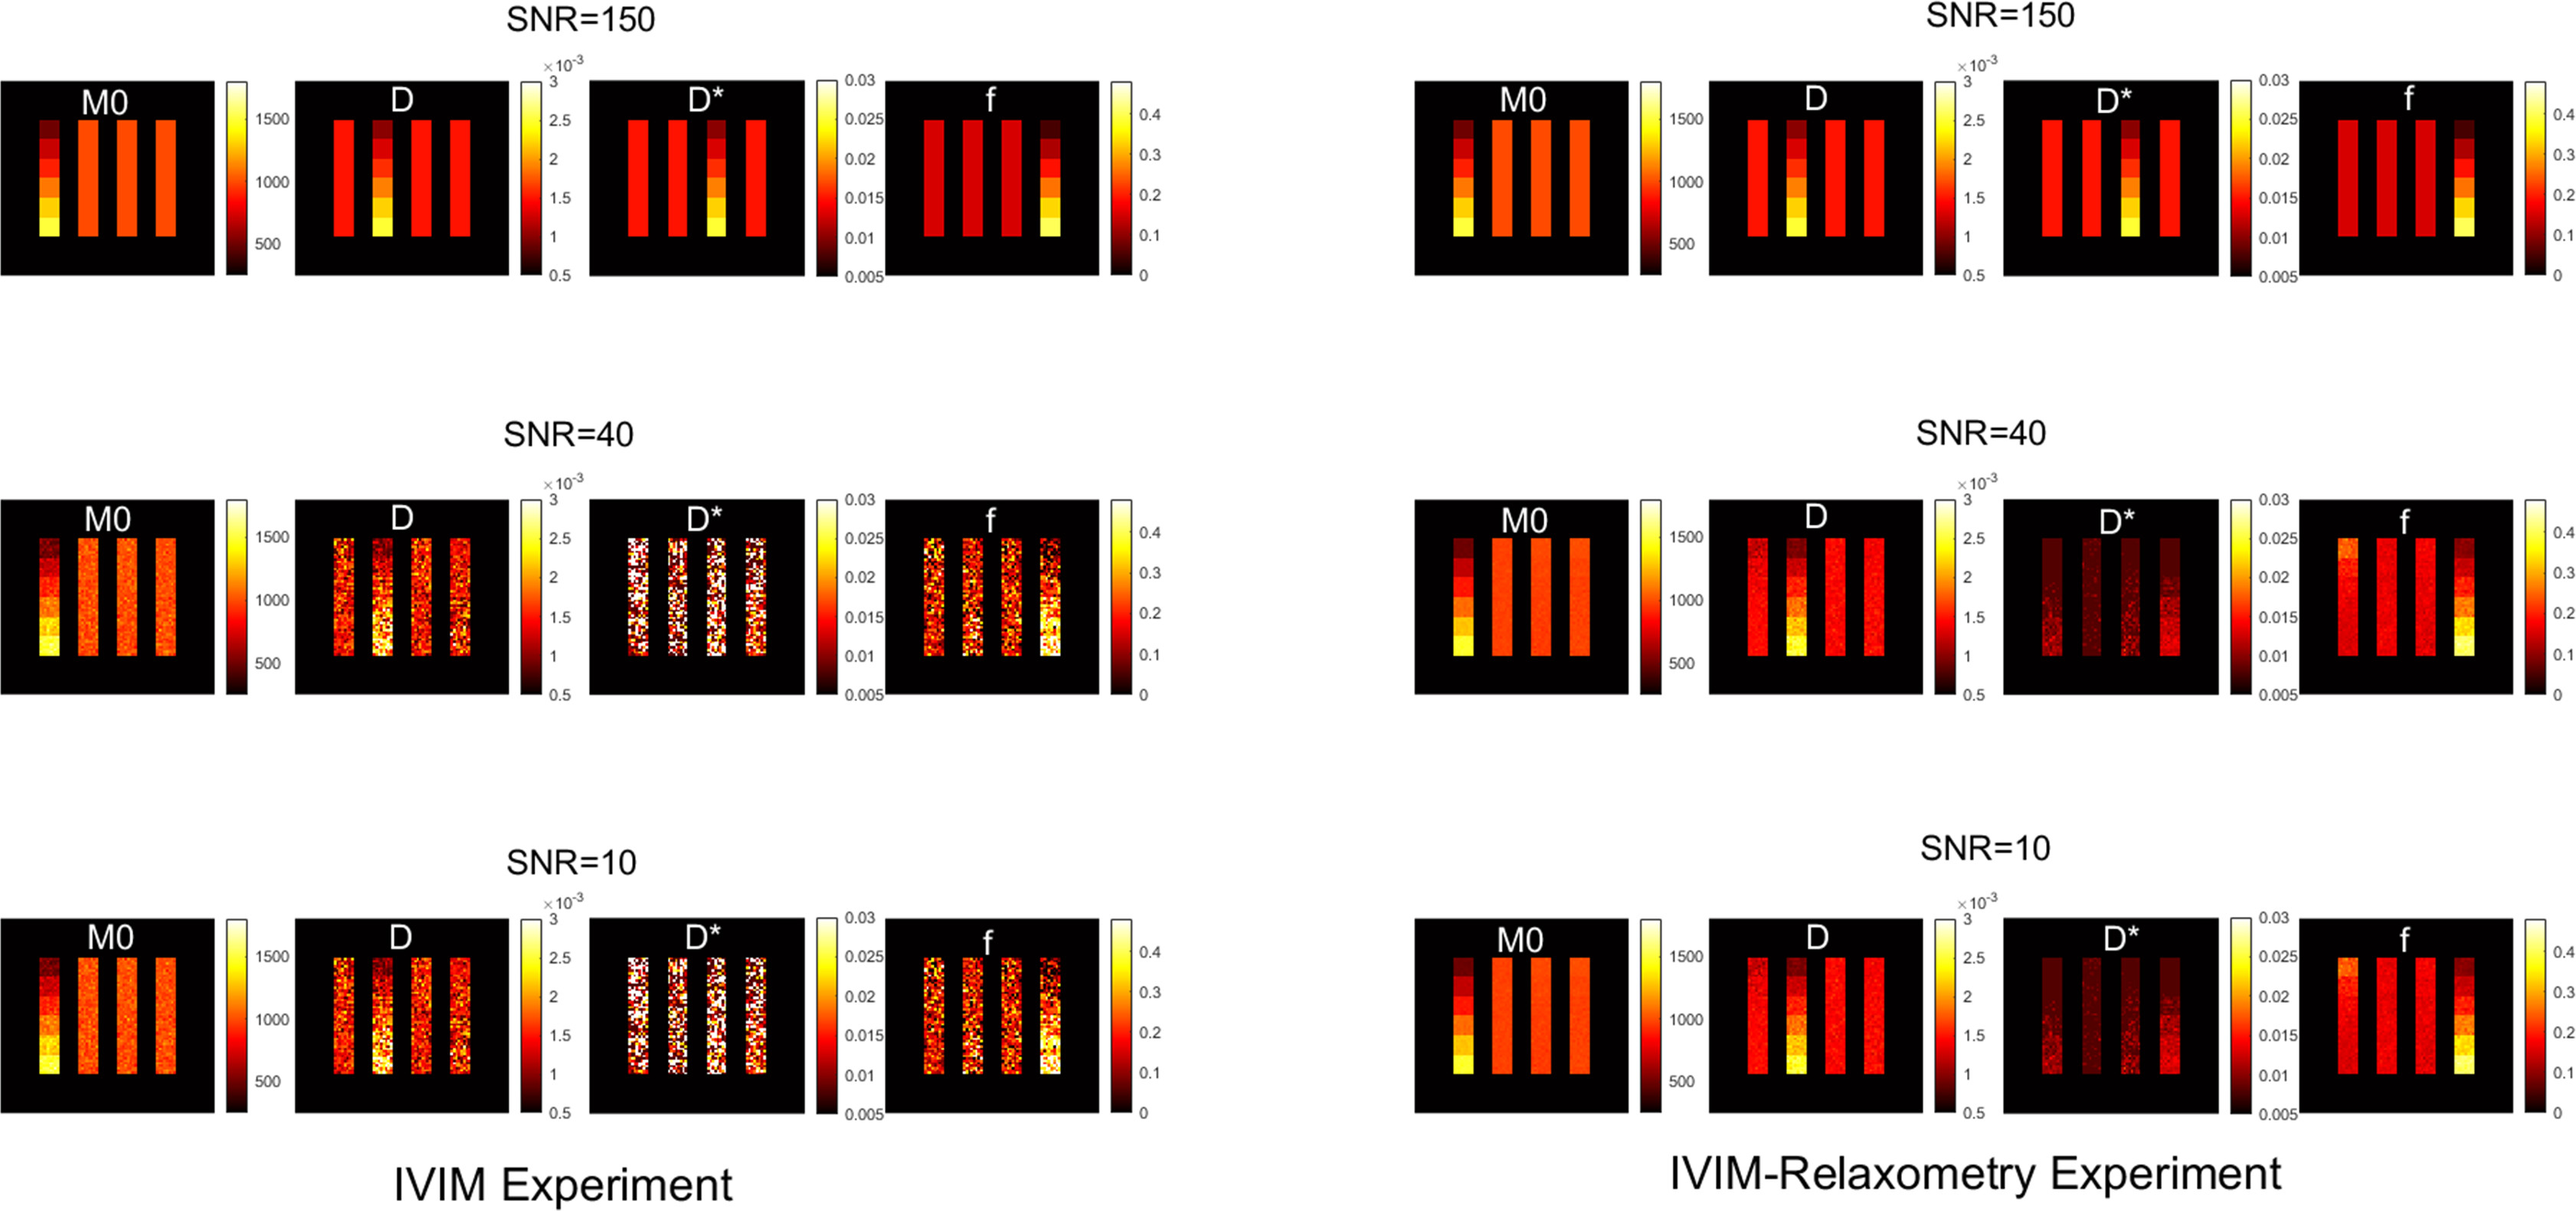
Figure
2. Maps of estimated parameters for SNR = 150 (top row), 40 (middle row) and 10 (bottom row) for standard
IVIM experiment (left) and IVIM-relaxometry experiment (right), respectively.
Figure
3. Comparison
of % Error of the parameters as a function of SNR for standard IVIM experiment (left)
and IVIM-relaxometry experiment (right).
DOI: https://doi.org/10.58530/2023/3973