3967
Investigation of motion probing gradient pulse for uniform collection of temporal and spatial diffusion information1Radiology Center, The University of Tokyo Hospital, Tokyo, Japan, 2Siemens Healthineers, Tokyo, Japan
Synopsis
Keywords: Data Acquisition, Diffusion/other diffusion imaging techniques
We examined the application order of MPG pulses (called reordered MPG) that can uniformly collect spatial diffusion information even if the examination is interrupted, compare it with the an electrostatic repulsion method (conventional method, called original MPG), and verify its usefulness. In conclusion, The reordered MPG, which was rearranged based on the MPG direction of the original, could collect diffusion information more uniformly than the original MPG even if the inspection examination was interrupted.Purpose
When acquiring diffusion-weighted image (DWI) such as diffusion tensor imaging and high angular resolution diffusion imaging (HARDI)1, an electrostatic repulsion method (conventional method)2 is one of the optimization methods of motion probing gradient (MPG) application direction. This MPG application method is widely used not only in the research field but also in clinical practice. Imaging time can be shortened using simultaneous multislice3, etc., but imaging time tends to be longer with DSI4 and Q-ball imaging5. If the MRI examination is interrupted in the middle, it cannot necessarily be said that the data acquired by the conventional method are spatially uniform diffusion information. Therefore, this study aimed to examine the application order of MPG pulses (called reordered) that can uniformly collect spatial diffusion information even if the examination is interrupted, compare it with the conventional method (called original), and verify its usefulness.Materials and methods
The study participants were 11 healthy men. DWI data used as reference were as follows: repetition time/echo time, 9000/109 ms; slice, 60 sections; matrix, 96*96, field of view, 240*240 mm2; b-value, 3000 s/mm2; MPG, 64 axes (plotted on a hemispherical surface), and data for 10.4 min of imaging time. In these data, the order of the MPG application axes was rearranged so that even if the scan was interrupted in the middle, the MPG application order also changes so that data could be acquired uniformly in a spatial and time-series manner. For these changes to occur, mathematical induction with electrostatic potential energy (cost function) was used. First, select the first axis of the conventional method. Then, from the remaining 63 axes, the one with the lowest potential energy was selected to determine the second axis. Similarly, for a given P-axis, the one with the lowest potential energy from the nonselected MPG (65-P) axes was adopted. We rearranged the order of all 64 axes in this way. Using the Voronoi diagram {Fig.1(a)}, the time-series variation of the area distribution on the sphere and the standard deviation of the Voronoi area on each MPG axis were obtained for the reordered and the original. We compared the potential energy ratio (PER). PER is the ratio of the potential energy when applying n-axis by the reordered and the potential energy of MPG optimized by the n-axis electronic repulsion method. Assuming that the scan was interrupted in 50% (32 axes) and 75% (48 axes) of the examination, we calculated the Fiber orientation distribution (FOD)6 and Orientation distribution function (ODF)4,5 by the original and the reorder, respectively, and calculated the similarity of the reference data to the FOD and ODF. MRtrix3 was used for FOD calculations, and the diffusion toolkit was used for ODF calculations. Similarity was calculated using Jensen-Shannon Divergence (JSD)6 for FOD and angular correlation coefficient (ACC)6 for ODF, and the region of interest was only the segmented white matter with 3D T1 weighted image. Wilcoxon’s signed-rank test was performed on the obtained results (p < 0.05).Results
The standard deviation of the Voronoi area was lower in the reordered than in the original in all application axes {Figs.1(b) and Fig.2}. The PER of the reordered was lower than that of the original in all the applied axes (Fig.3). The average JSD values were 0.00010629 for the original MPG 32 axes, 0.00007044 for the reordered 32 axes, 0.00003688 for the original 48 axes, and 0.00002295 for the reordered 48 axes. A significant difference was found between the original and reordered for both 32 axes and 48 axes (p = 0.0033) {Fig.4(a), (b) and Fig.5(a)}. The average ACC values were 0.95061 for the original MPG 32 axes, 0.95632 for the reordered 32 axes, 0.974489 for the original 48 axes, and 0.978542 for the reordered 48 axes. A significant difference was found between the original and reordered for the 32 axes and 48 axes (p = 0.0033) (Fig. 4(c), (d) and Fig.5(b)).Disscussion
The usefulness of the reordered MPG was suggested from the results of Voronoi cells and the comparison of JSD and ACC using actual DWI data. However, in this study, the MPG had 64 axes, and the interruption assumption was only two, i.e., 32 axes and 48 axes. Thus, future examinations under other conditions are necessary. Furthermore, verification in patients with brain disorders and neonate or pediatric are necessary.Conclusion
The reordered MPG, which was rearranged based on the MPG direction of the original, could collect diffusion information more uniformly than the original MPG even if the examination was interrupted.Acknowledgements
This work was supported by KAKENHI(20K08016) in JAPAN.References
1 David S Tuch, Timothy G Reese, Mette R Wiegell, et al. High angular resolution diffusion imaging reveals intravoxel white matter fiber heterogeneity. Magn Reson Med. 2002 Oct;48(4):577-82.
2 D K Jones, M A Horsfield, A Simmons. Optimal strategies for measuring diffusion in anisotropic systems by magnetic resonance imaging. Magn Reson Med. 1999 Sep;42(3):515-25.
3 K Setsompop, J Cohen-Adad, B A Gagoski, et al. Improving diffusion MRI using simultaneous multi-slice echo planar imaging. Neuroimage. 2012 Oct 15;63(1):569-80.
4 V J Wedeen, R P Wang, J D Schmahmann, et al. Diffusion spectrum magnetic resonance imaging (DSI) tractography of crossing fibers. Neuroimage. 2008 Jul 15;41(4):1267-77.
5 David S Touch. Q-ball imaging. Magn Reson Med. 2004 Dec;52(6):1358-72.
6 Kurt G Schilling, Vaibhav Janve, Yurui Gao. Histological validation of diffusion MRI fiber orientation distributions and dispersion. Neuroimage. 2018 Jan 15;165:200-221.
Figures
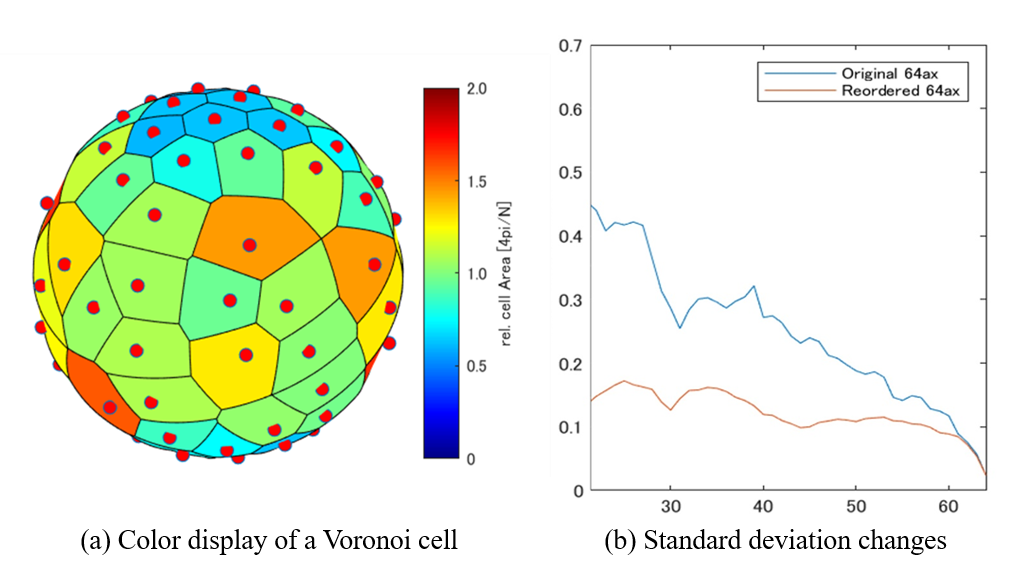
Fig. 1. Color display and standard deviation changes of a Voronoi cell
For (a), areas are color-coded by size. If 4𝜋/2𝑁 (𝑁: MPG, 𝑁 = 40 in the figure), yellowish green (1.0), smaller than that is cool, and larger is warmer.
For (b), the
standard deviation of Voronoi cells in all application axes is superior to that
of the proposed method. The X-axis represents MPG, and the Y-axis represents
the standard deviation against the reference (MPG64 axis) Voloroi cell area.
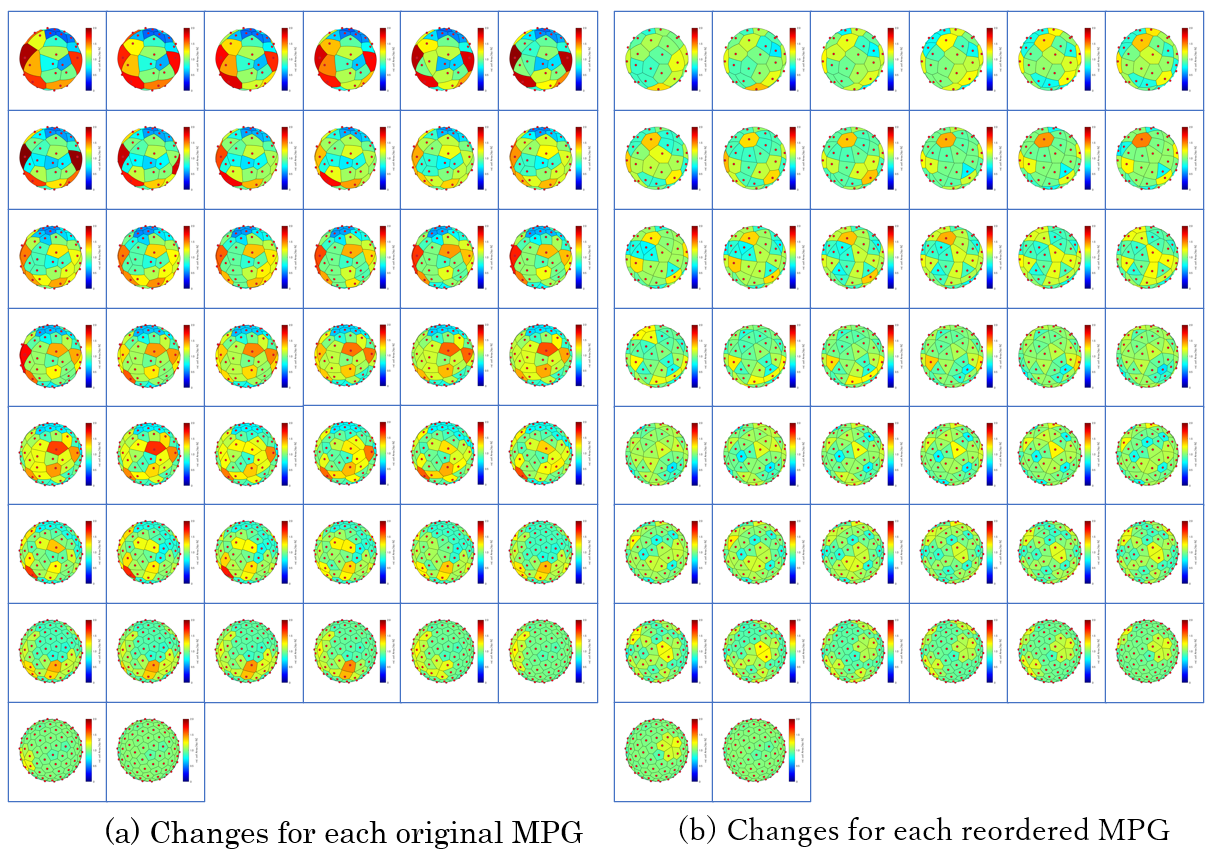
Fig.2. Voronoi cells for each MPG axis
The upper left is the MPG21 axis, and the lower right is the MPG64 axis. The original MPG has visually uneven diffusion direction acquisition.
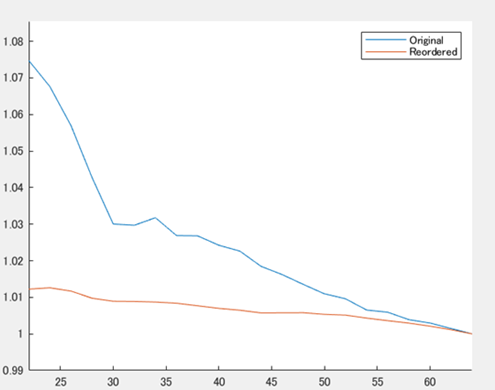
Fig.3. MPG and PER
The X-axis represents the number of MPG, whereas the Y-axis represents the potential energy ratio (PER) relative to the ideal MPG. The PER of the proposed method was lower than that of the conventional method in all the applied axes. PER means potential energy ratio.
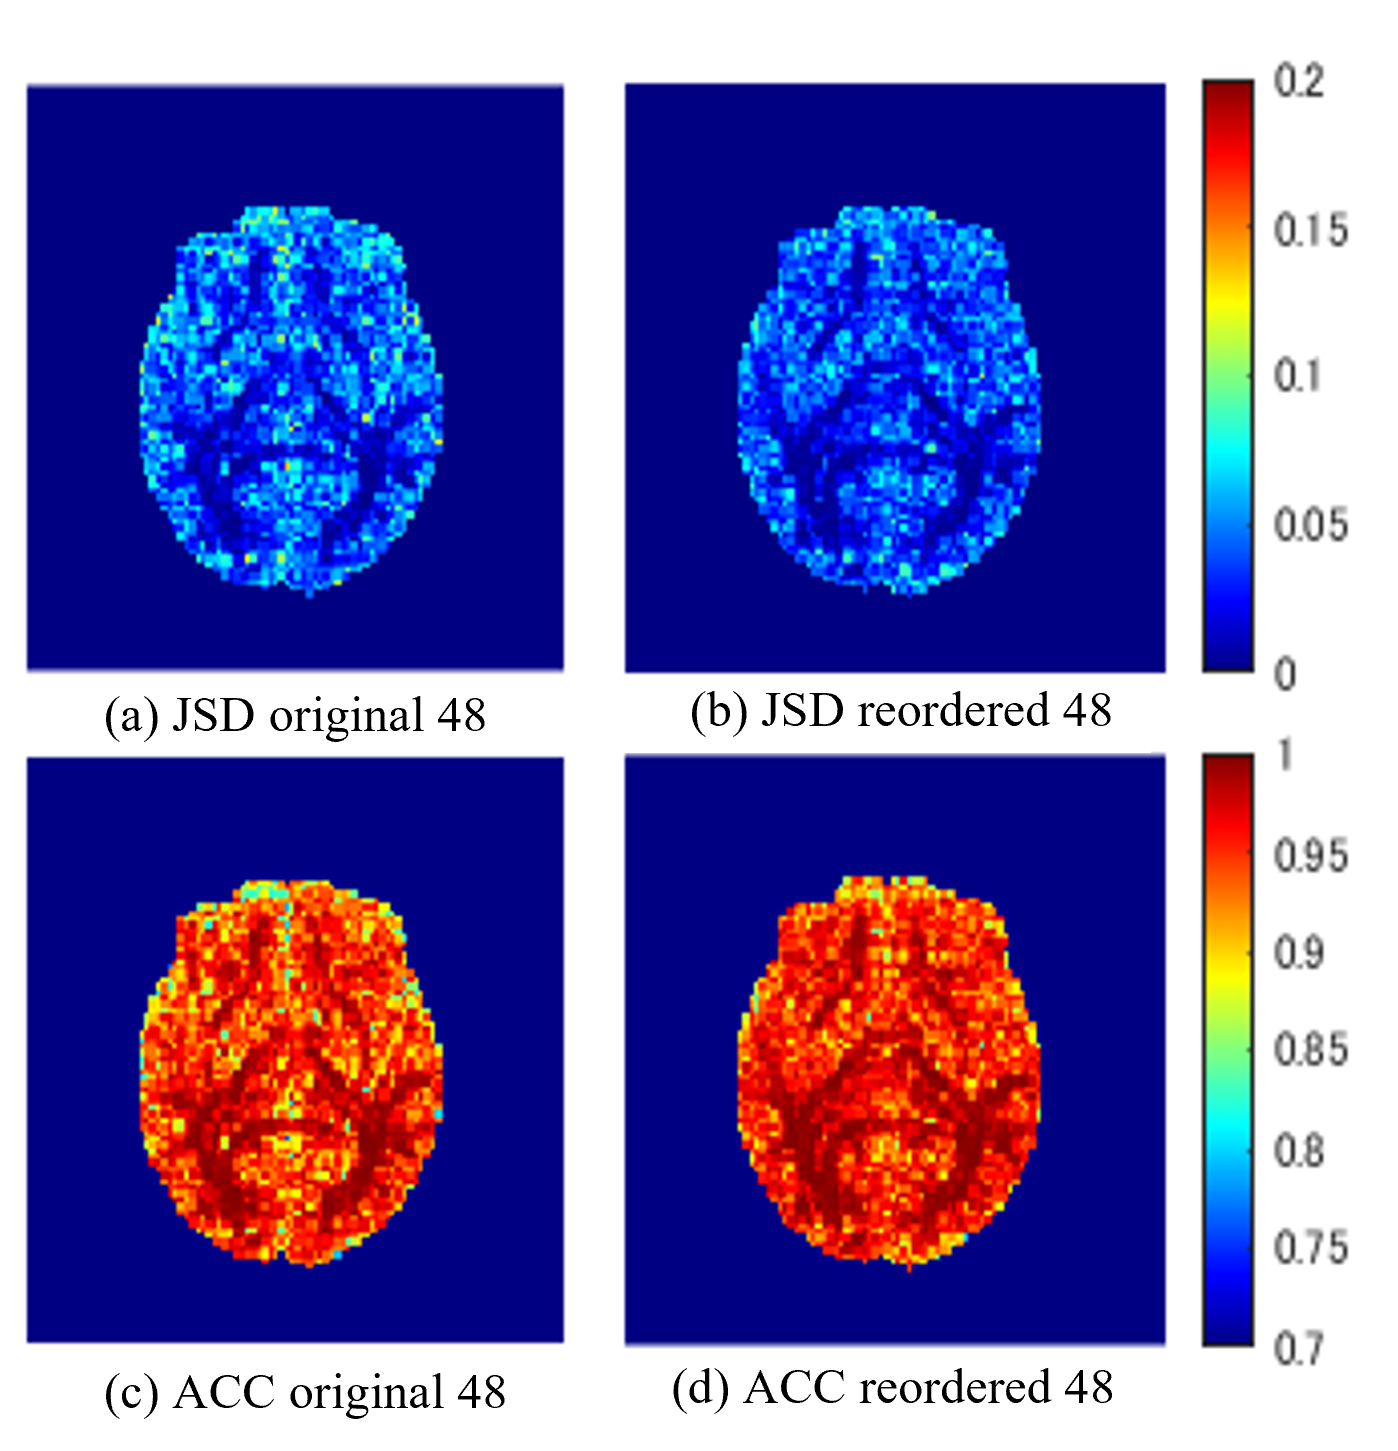
Fig.4. Result image of JSD and ACC
The images are a whole-brain display, but the JSD and ACC measurement are calculated using a white-matter mask.
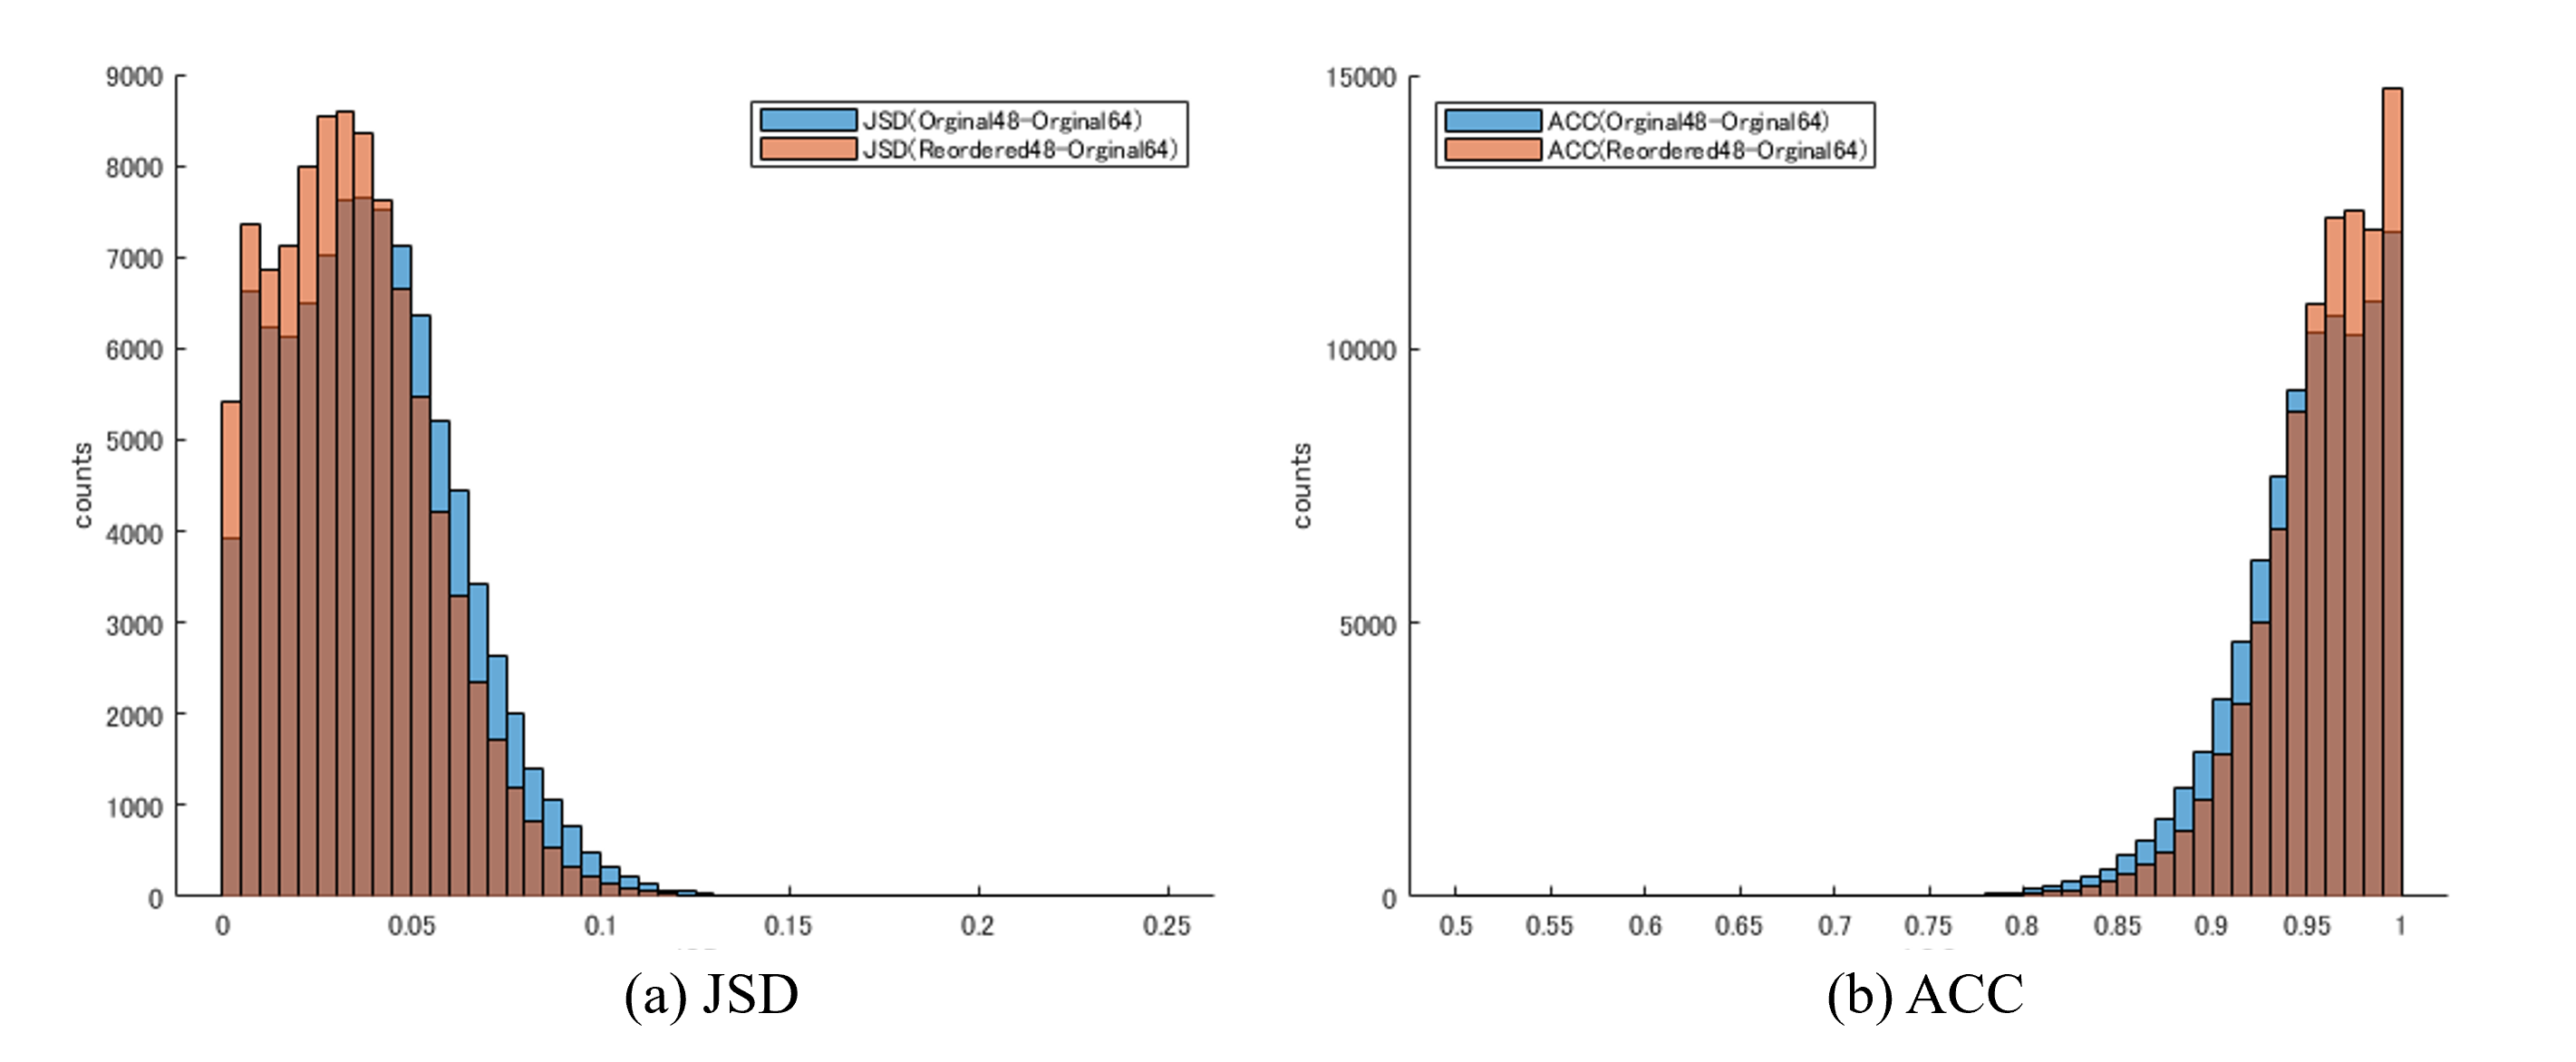
Fig.5. Example of JSD and ACC histogram results for the white matter in one participant (MPG = 48 axes).
For (a), the proposed method has improved JSD (approaching 0) compared with the conventional method.
For (b), the
proposed method has improved ACC (approaching 1) compared with the conventional
method.