3965
BUAN 2.0, streamlines as functions, nonlinear registration, and subdivision of bundles for advanced tractometry1Mark and Mary Stevens Neuroimaging and Informatics Institute, Keck School of Medicine, University of Southern California, Marina del Rey, CA, United States, 2Department of Intelligent Systems Engineering, Luddy School of Informatics, Computing, and Engineering, Indiana University Bloomington, Bloomington, IN, United States, 3Department of Epidemiology and Biostatistics, Indiana University Bloomington, Bloomington, IN, United States
Synopsis
Keywords: Software Tools, Diffusion/other diffusion imaging techniques, Tractography, tractometry, bundle segmentation, white matter tracts, group analysis
We propose BUAN 2.0, which adds new advancements to its predecessor BUAN. It sub-segments bundles with varying substructures in them. It uses nonlinear registration of bundles to find accurate correspondences among bundle segments across subjects. The number of horizontal segments is decided based on the bundle and data specifications. More importantly, in BUAN 2.0, instead of treating each point on the streamline as an independent observation, we treat each streamline as a complete entity, as a function. Streamlines are analyzed by deploying functional data analysis (FDA) methods for studying group differences in populations along the length of the tracts.Introduction
Tractometry methods aim to quantify microstructural differences in populations along the length of the tracts. Current tractometry methods do not consider substructures within bundles. An arbitrary number of nodes/segments are created along the length of the tracts. Furthermore, data per streamline node/segment coming from groups are analyzed independently without considering the neighborhood information on the streamlines. In BUAN 2.0, we address the above-mentioned limitations for advancing the tractometric analysis. BUAN 2.0 adds new advancements to its predecessor, BUAN1. BUAN 2.0 introduces an approach for the vertical sub-segmentation of those bundles with varying substructures. It uses nonlinear registration of bundles to find accurate correspondences among bundle segments across subjects. The number of horizontal segments is decided based on the average length of the bundle and the voxel size of the diffusion data. More importantly, in BUAN 2.0, we treat an entire streamline as a curve, a function. Streamlines are analyzed by deploying functional data analysis (FDA)2 methods for studying group differences in populations along the length of the tracts. Final statistical analysis always takes place in the subjects’ native diffusion space without any impact of linear or nonlinear registration on streamlines or microstructural measures. Results are presented using the publicly available Alzheimer’s Disease Neuroimaging Initiative phase 3 (ADNI3)3,4 dataset.Methods
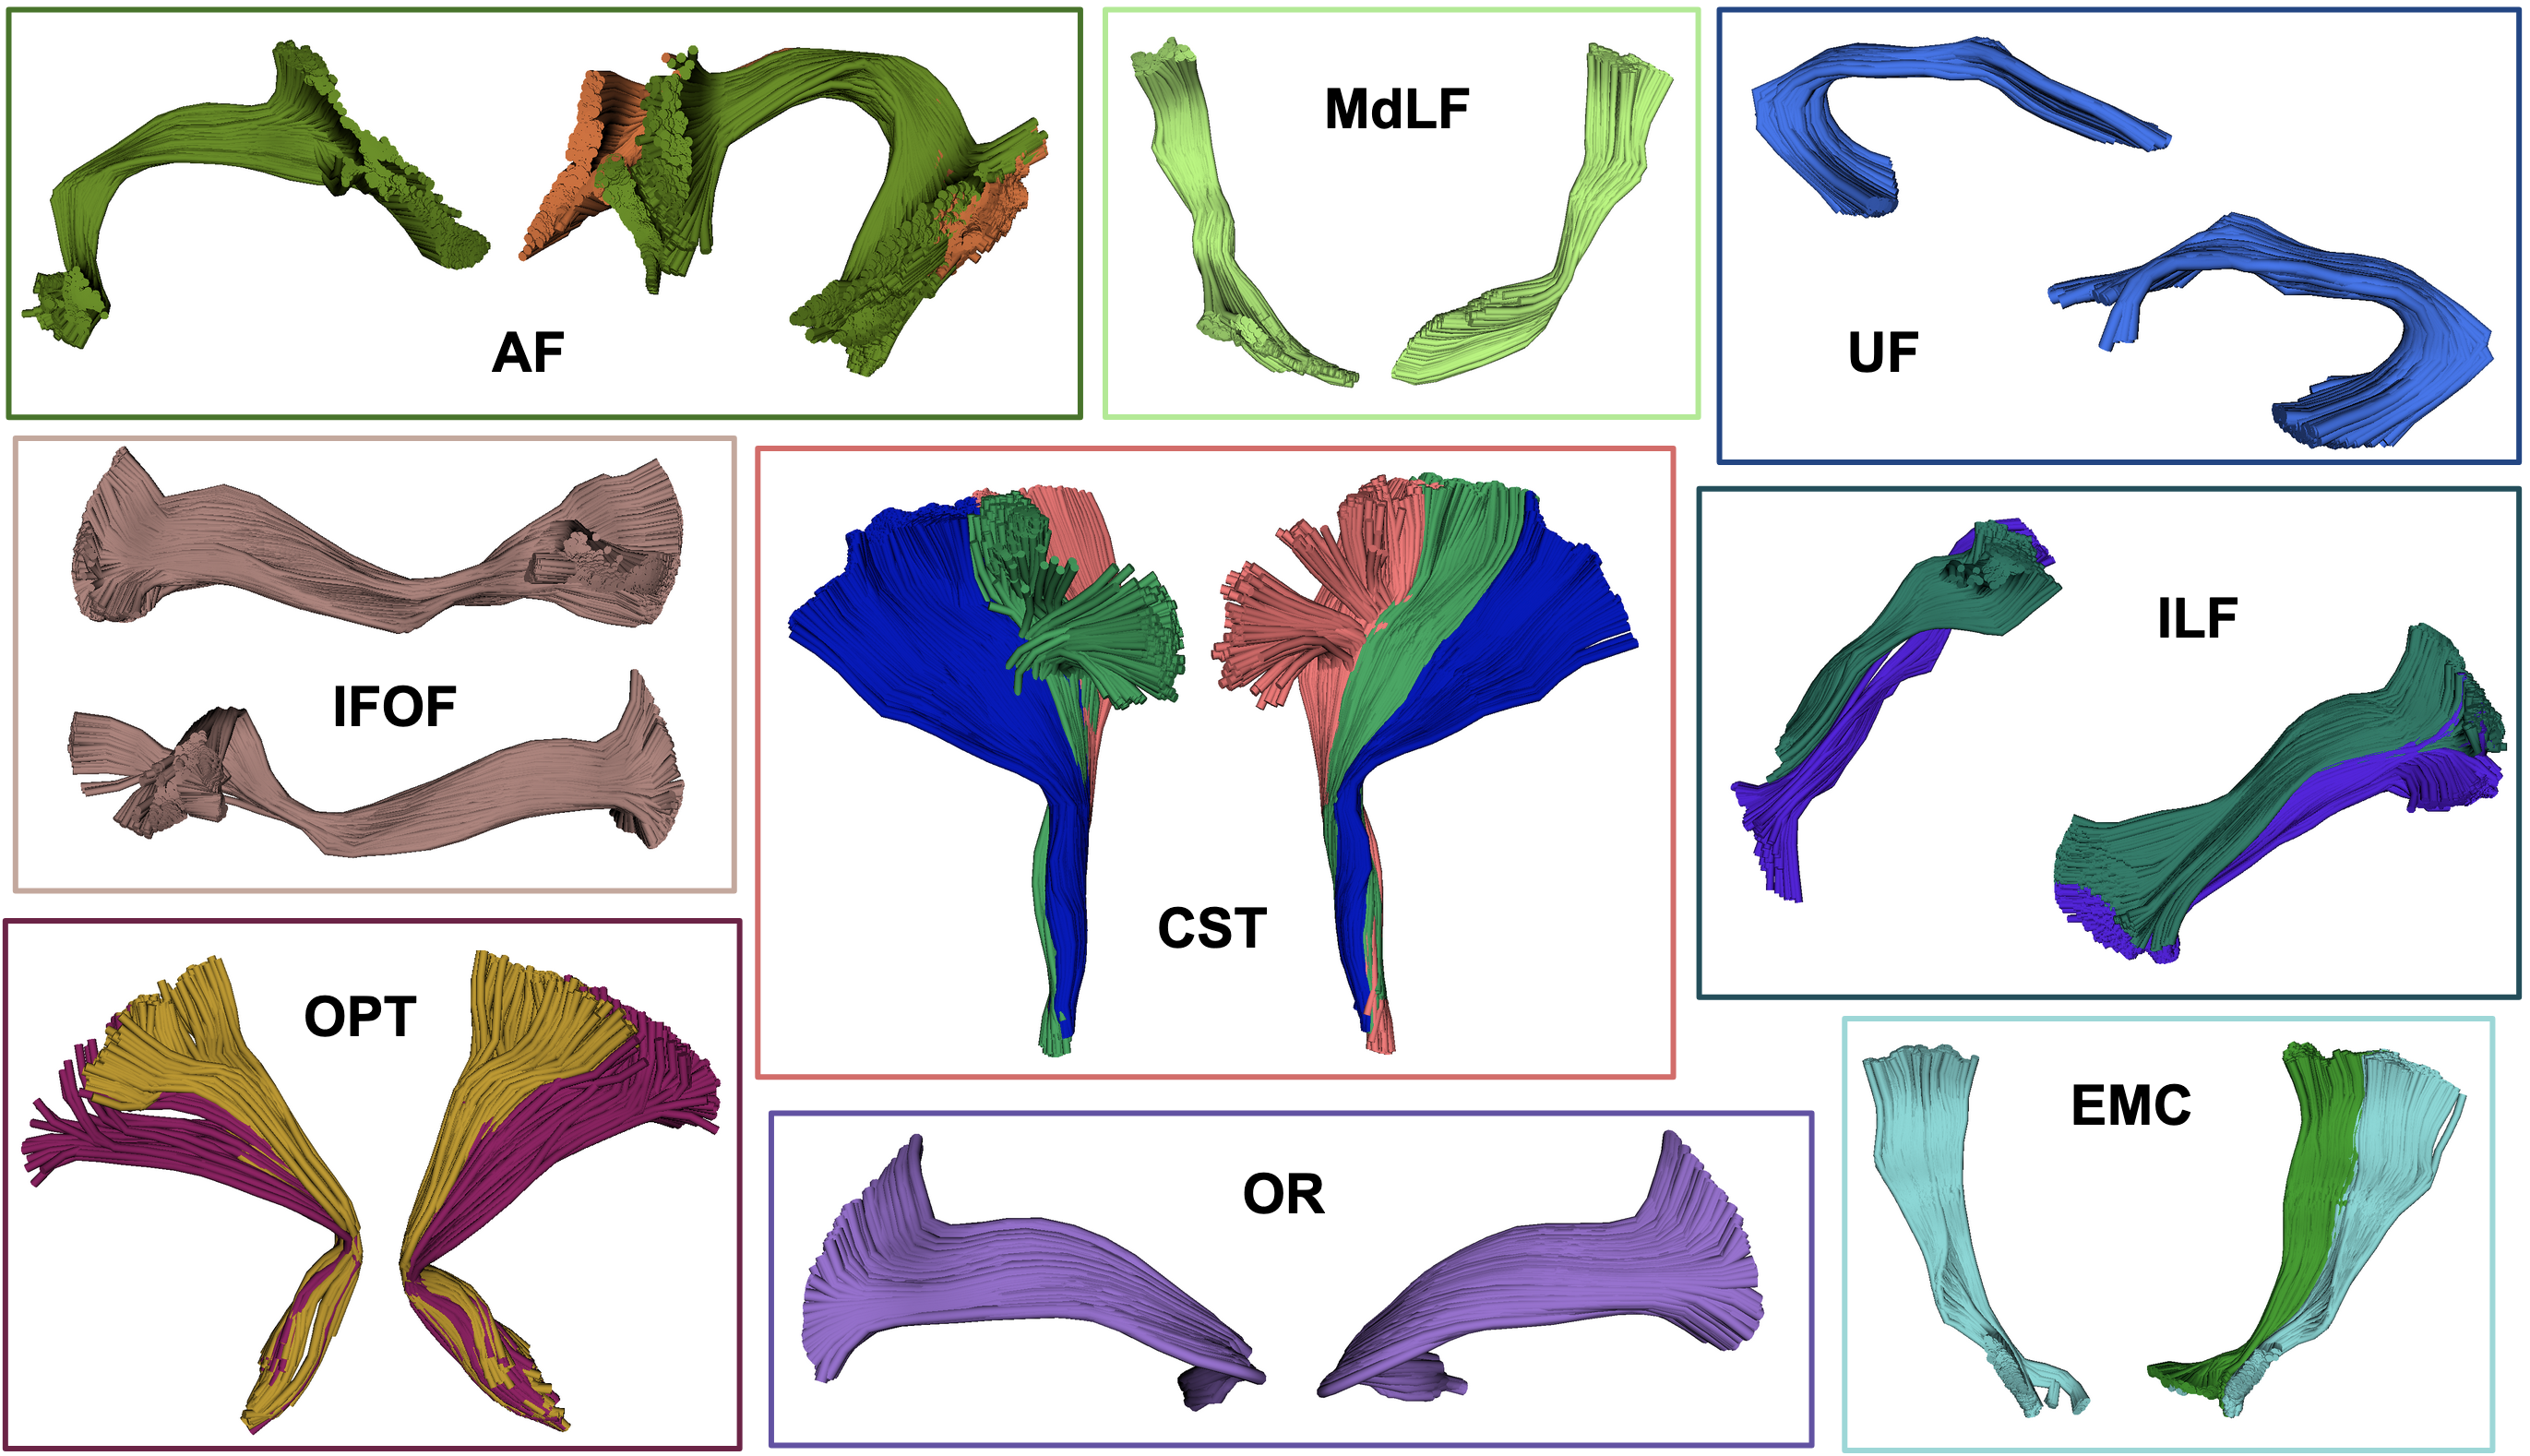
BUAN 2.0 adds four new additions/enhancements to BUAN1 after the bundle extraction step. Bundle extraction steps in BUAN 2.0 are the same as in BUAN. Briefly, we start by registering whole-brain tractograms of subjects to HCP-842 atlas tractogram in MNI space. Bundles are extracted from registered tractograms using auto-calibrated RecoBundles (aRB)1,6. aRB returns bundles in both native space and common space (i.e., MNI).Below is the summary of the new steps introduced in BUAN 2.0:
- Nonlinearly register subject's bundles to model bundles using deformable BundleWarp registration7,8.
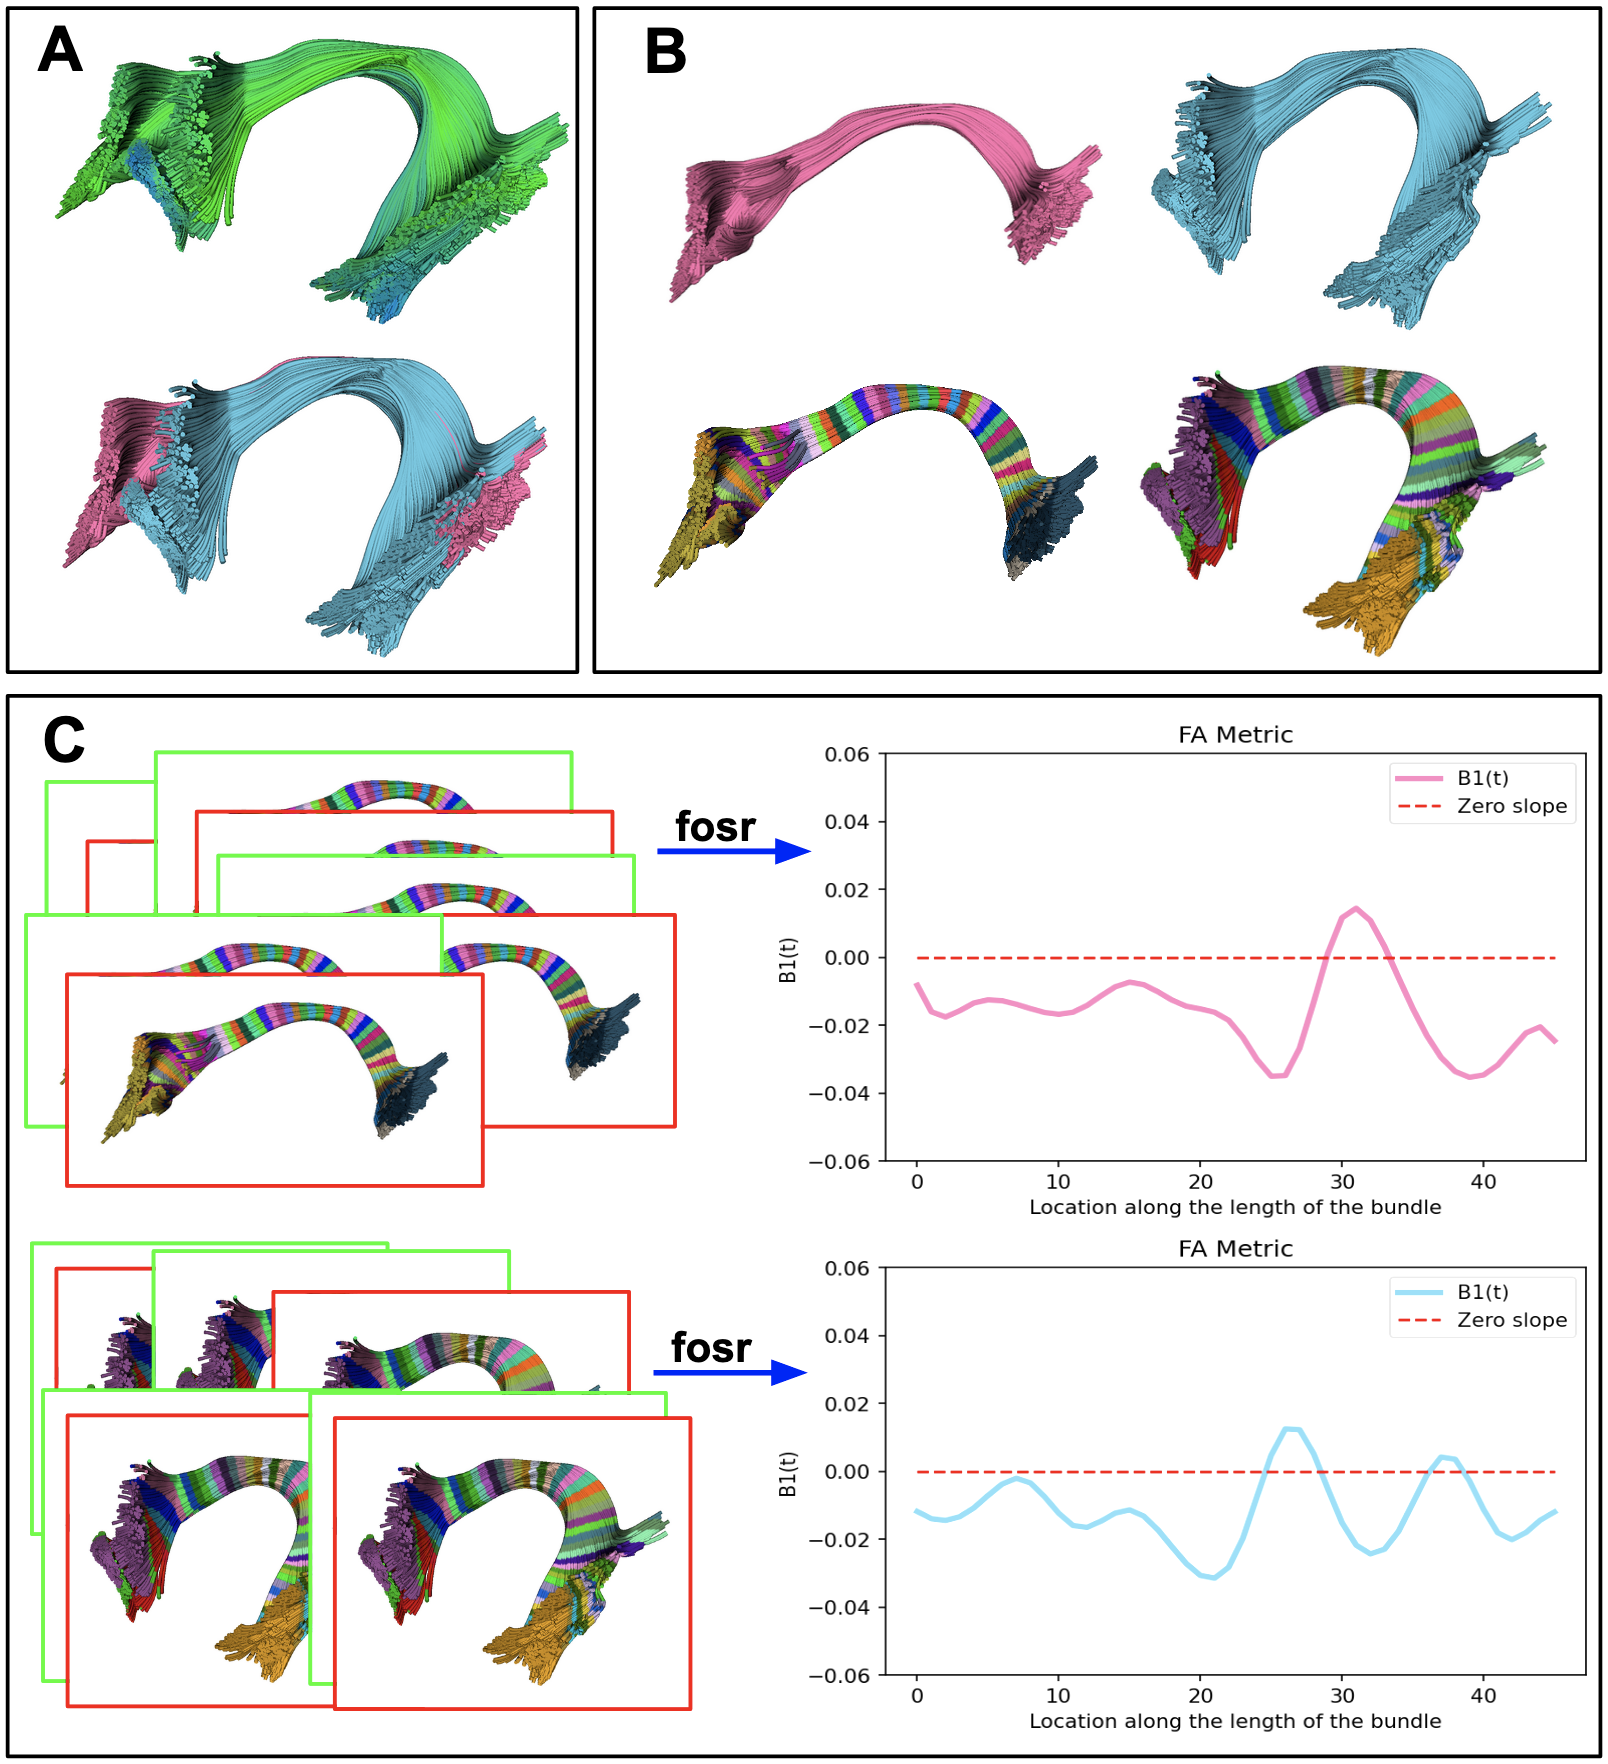
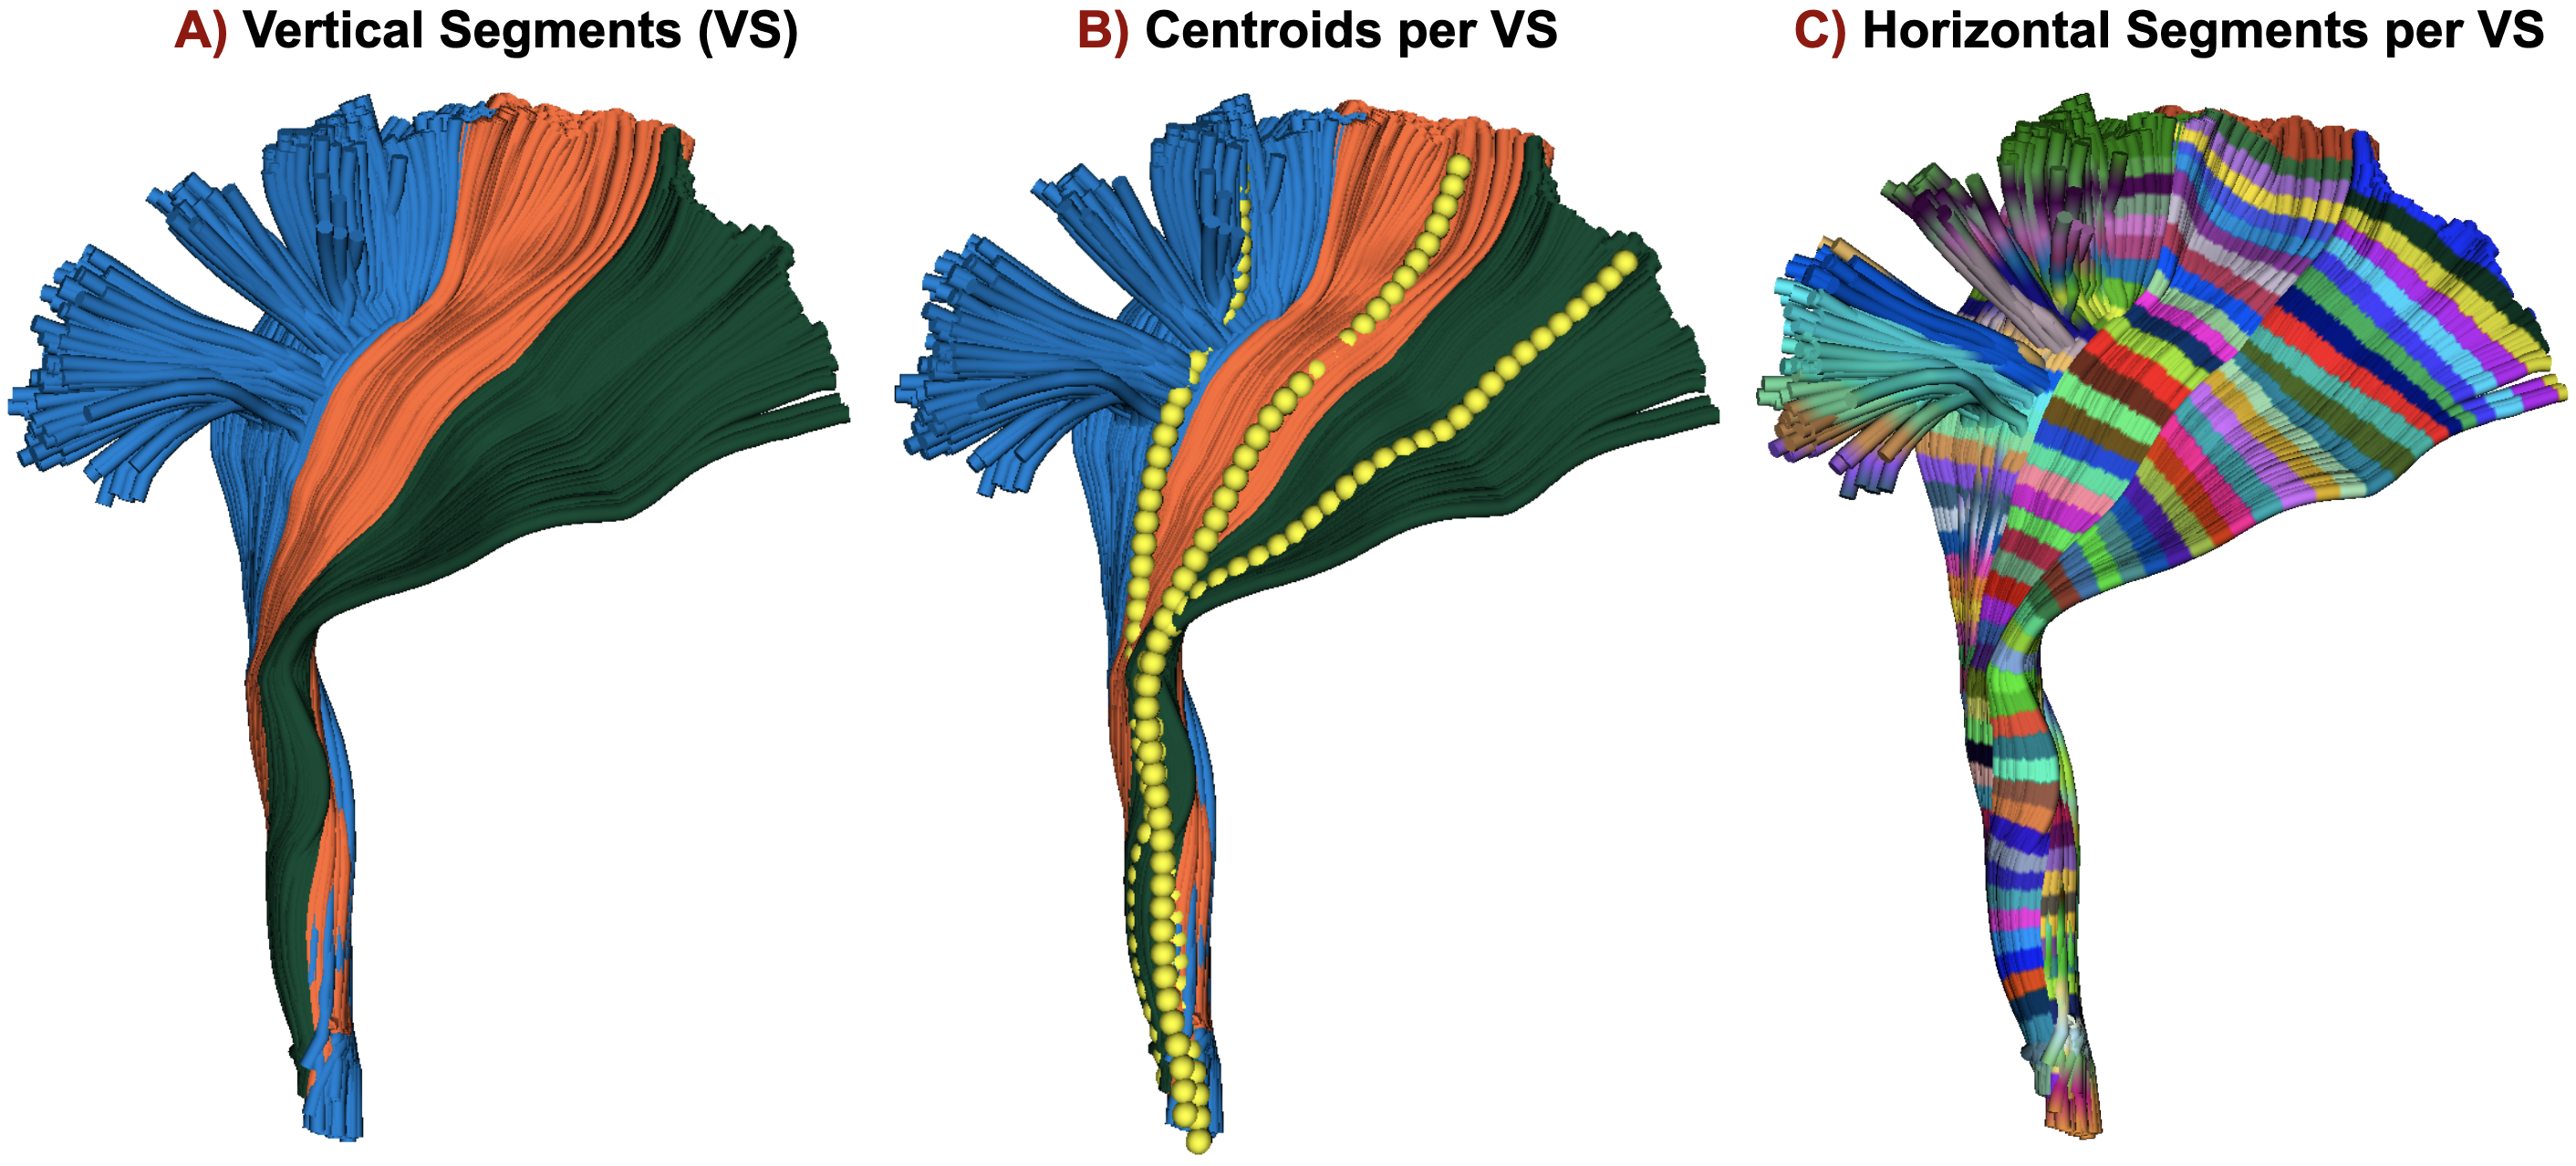
- Create vertical segments (sub-division) on bundles, if necessary (Fig.1.A). MDF9 distance is calculated among the subject’s streamlines and model bundle centroid streamlines, streamlines are assigned to the vertical segment based on the closest distance to the centroid streamline (Fig.3.B). Model bundle centroids are always kept the same for all subjects.
- Create n horizontal segments based on the length and voxel size of the diffusion data (Fig.1.B, Fig.3.C). Calculated by $$\text{Number of horizontal segments} = \frac{\text{Average Euclidean length of the bundle}}{voxel\_size+0.5}$$ Project microstructural measures onto segments in the native space.
- Run function-on-scalar (fosr) regression10 to find group differences along the length of the bundles (Fig.1.C). Functional responses are recorded for observations over time or location in our case. The functional regression method gives us a smooth functional response, Y(t), to known covariates, X, by a linear combination of parameter functions, β(t). β(t) are to be estimated. A linear function-on-scalar regression10 in a matrix form2 is given by:
- Y(t) = β(t)X +ε(t)
- Y(t)Nxm is a matrix of functional responses such as fractional anisotropy (FA) curves. N is the number of streamlines, and m is equal to the number of horizontal segments on a bundle.
- XNxq is a design matrix.
- β is a matrix of functions of t and characterizes the association between Y (e.g., FA) with covariate of interest such as group.
- ε(t) is an error term.
- Y(t)Nxm is a matrix of functional responses such as fractional anisotropy (FA) curves. N is the number of streamlines, and m is equal to the number of horizontal segments on a bundle.
- Y(t) = β(t)X +ε(t)
Results
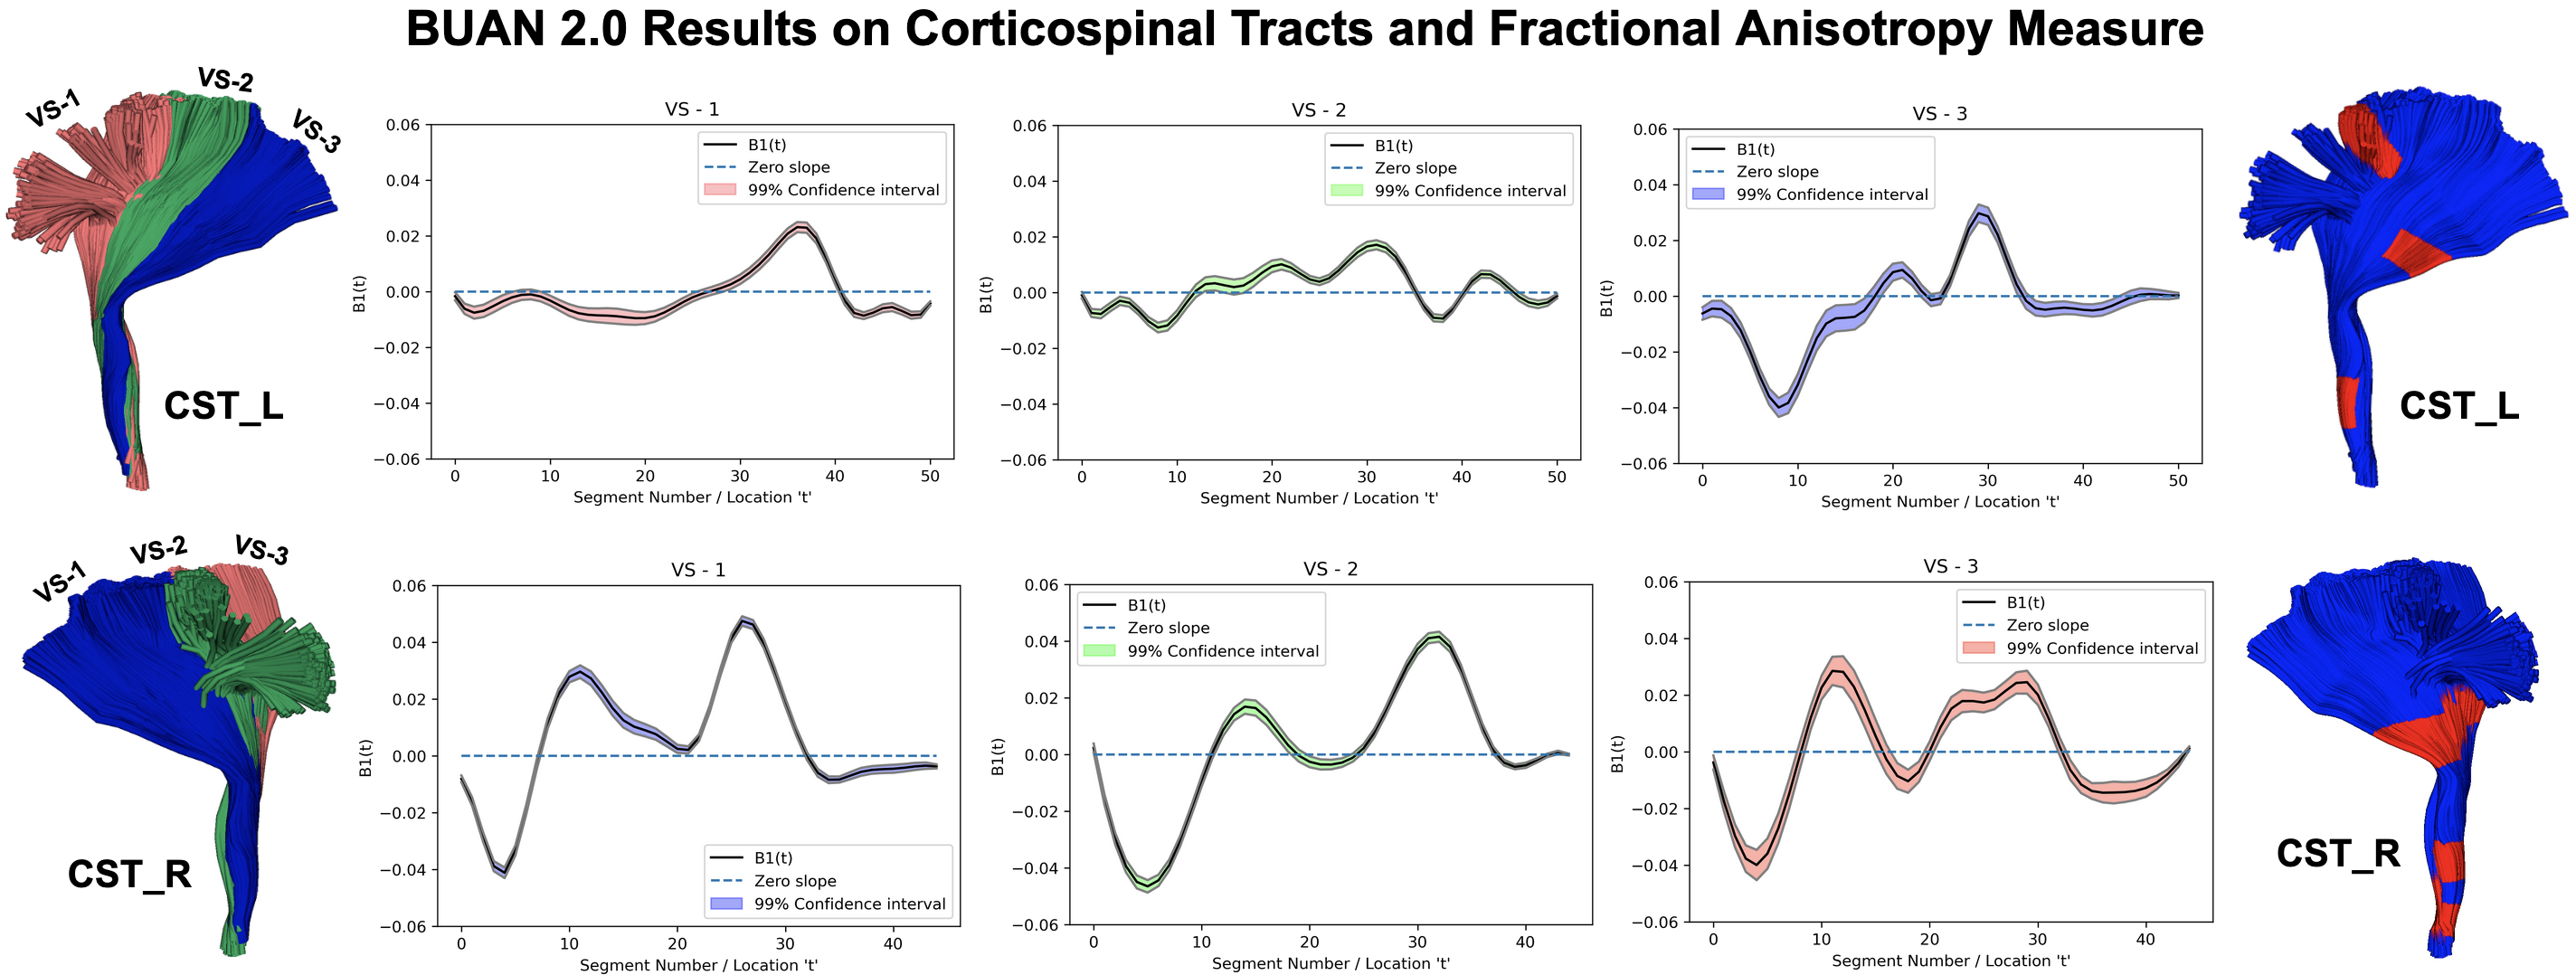
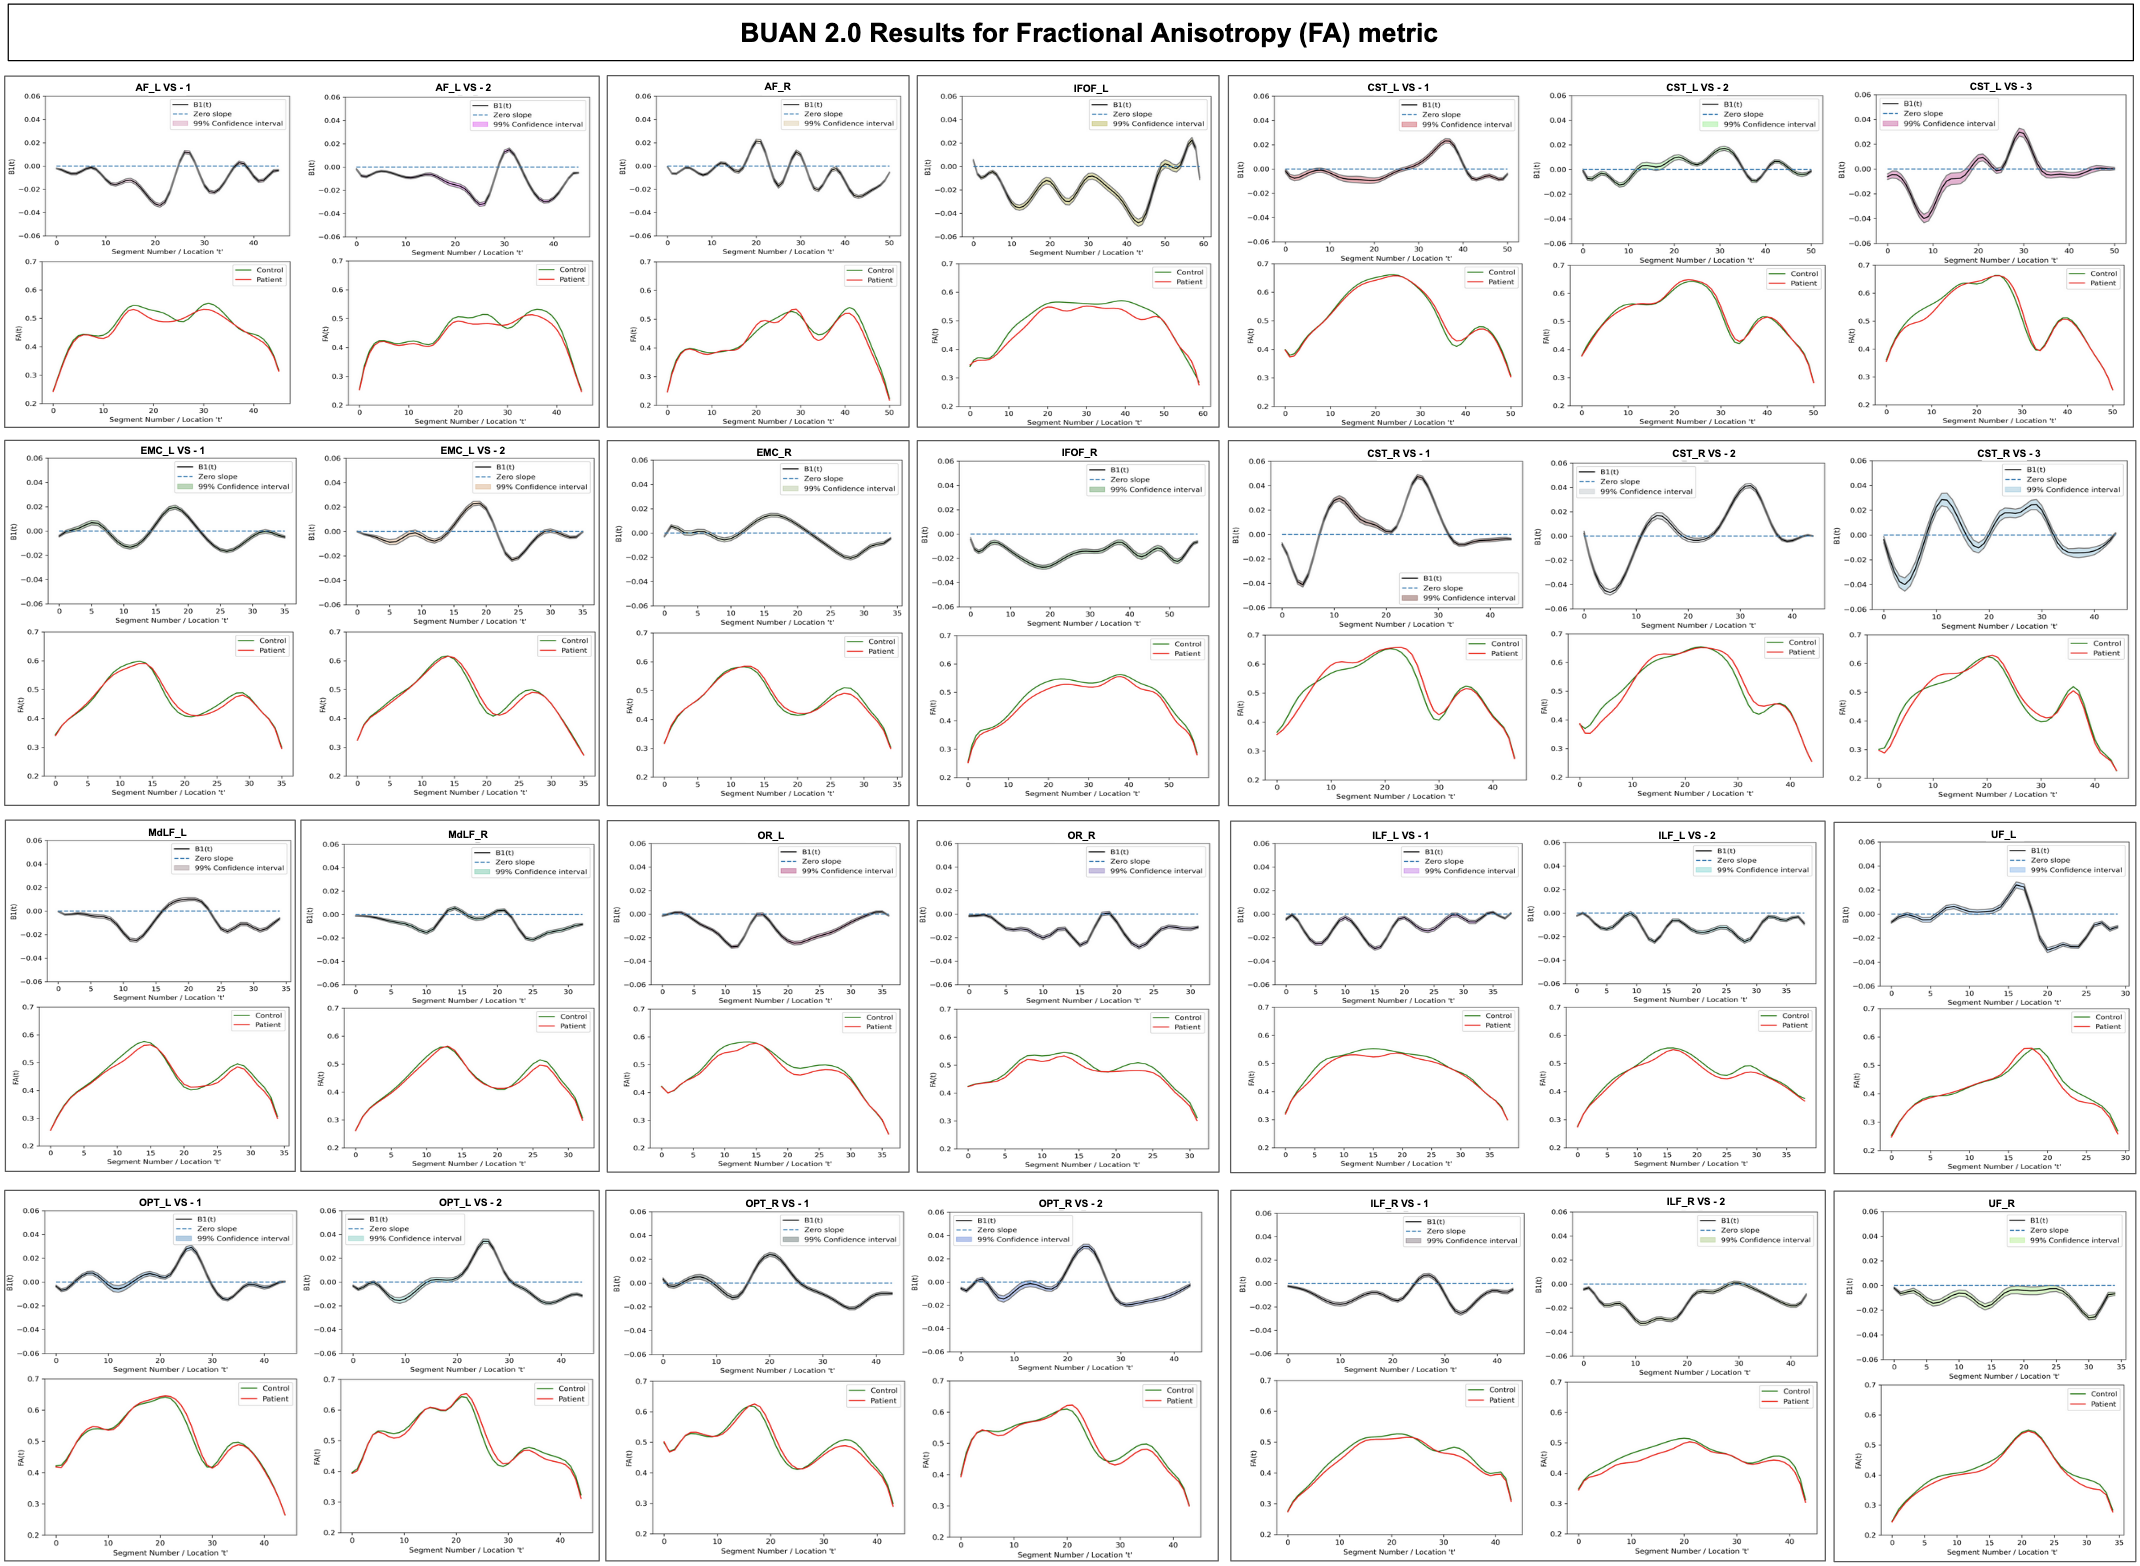
We multi-shell diffusion MRI (dMRI) data from 131 ADNI33 participants (age: 55-91 years, 74F, 57M) scanned on 3T Siemens scanners. dMRI consisted of 127 volumes; 13 b0, 48 b=1,000, 6 b=500 and 60 b=2,000 s/mm2 volumes with an isometric 2-mm voxel size. Participants included 44 with mild cognitive impairment (MCI) and 87 cognitively normal controls (CN). dMRI were pre-processed using the ADNI3 dMRI 4, correcting for artifacts including noise, Gibbs ringing, eddy currents, bias field inhomogeneity, and echo-planar imaging distortions. We applied multi-shell multi-tissue constrained spherical deconvolution11 and probabilistic particle filtering tracking12 to generate whole-brain tractograms using DIPY13. BUAN 2.0 was run to extract 18 bundles per subject and analyze them to find group differences on the FA metric.Group differences are considered significant if β1(t) diverges +/- 0.02 from zero slope. BUAN 2.0 generates smooth β1(t) curves incorporating neighborhood information on streamlines. Fig 4. Shows results on corticospinal tracts (CST). BUAN 2.0 is able to highlight specific regions on bundles that are significant. Fig 5. Shows results on all 18 tracts along with mean group FA differences plots. Overall, we see a similar trend of FA being lower in the MCI group for tracts with significant group differences.
Discussion and Conclusion
We introduce BUAN 2.0, which brings new advancements to the BUAN tractometry pipeline. BUAN 2.0 adds the vertical sub-segmentation of those bundles that have differing substructures within them. It uses BundleWarp nonlinear registration of bundles to find better correspondences among different subjects' bundles. The number of horizontal segments is decided based on the average length of the bundle and the voxel size of the diffusion data. BUAN 2.0 addresses the most significant limitation of current tractometry methods, where points on the streamlines are treated as independent variables in the statistical analysis step without considering that points are connected with neighboring points on a streamline. BUAN 2.0 treats each streamline as a function. It deploys FDA methods to study group differences in populations along the length of the tracts.Acknowledgements
This research was supported by the NIH National Institute of Biomedical Imaging and Bioengineering under award number R01EB027585 and the NIH (National Institutes of Health) 2R01EB017230-05A1 grant. It was also supported by the NIH under the AI4AD project grant U01 AG068057, grant numbers P41 EB015922, and RF1 AG057892.References
[1] Chandio, B.Q., Risacher, S.L., Pestilli, F., Bullock, D., Yeh, F.C., Koudoro, S., Rokem, A., Harezlak, J. and Garyfallidis, E., 2020. Bundle analytics, a computational framework for investigating the shapes and profiles of brain pathways across populations. Scientific reports, 10(1), pp.1-18.[2] Ramsay, JO., Functional data analysis. Encyclopedia of Statistical Sciences, 4, 2004.
[3] Zavaliangos-Petropulu, A., Nir, T.M., Thomopoulos, S.I., Reid, R.I., Bernstein, M.A., Borowski, B., Jack Jr, C.R., Weiner, M.W., Jahanshad, N. and Thompson, P.M., 2019. Diffusion MRI indices and their relation to cognitive impairment in brain aging: the updated multi-protocol approach in ADNI3. Frontiers in Neuroinformatics, 13, p.2.
[4] Thomopoulos, S.I., Nir, T.M., Villalon-Reina, J.E., Zavaliangos-Petropulu, A., Maiti, P., Zheng, H., Nourollahimoghadam, E., Jahanshad, N., Thompson, P.M., for the Alzheimer’s Disease Neuroimaging Initiative. Diffusion MRI Metrics and their Relation to Alzheimer’s Disease Severity: Effects of Harmonization Approaches. SIPAIM 2021, Campinas, Brazil. 2021.
[5] Yeh, F.C., Panesar, S., Fernandes, D., Meola, A., Yoshino, M., Fernandez-Miranda, J.C., Vettel, J.M. and Verstynen, T., 2018. Population-averaged atlas of the macroscale human structural connectome and its network topology. NeuroImage, 178, pp.57-68.
[6] Garyfallidis, E., Côté, M.A., Rheault, F., Sidhu, J., Hau, J., Petit, L., Fortin, D., Cunanne, S. and Descoteaux, M., 2018. Recognition of white matter bundles using local and global streamline-based registration and clustering. NeuroImage, 170, pp.283-295.
[7] Chandio, B.Q. and Garyfallidis, E., 2020. StND: Streamline-based non-rigid partial-deformation tractography registration. Medical Imaging Meets NeurIPS.
[8] Chandio, B.Q., 2022. Advancing White Matter Tractometry of the Brain Using Diffusion MRI and Machine Learning, PhD thesis, Indiana University.
[9] Garyfallidis, E., Brett, M., Correia, M.M., Williams, G.B. and Nimmo-Smith, I., 2012. Quickbundles, a method for tractography simplification. Frontiers in Neuroscience, 6, p.175.
[10] Reiss, P.T., Huang, L. and Mennes, M., 2010. Fast function-on-scalar regression with penalized basis expansions. The International Journal of Biostatistics, 6(1).
[11] Tournier, J.-D., Calamante, F. & Connelly, A. Robust determination of the fibre orientation distribution in diffusion MRI: non-negativity constrained super-resolved spherical deconvolution. NeuroImage 35, 1459–1472 (2007).
[12] Girard, G., Whittingstall, K., Deriche, R., & Descoteaux, M. Towards quantitative connectivity analysis: reducing tractography biases. NeuroImage, 98, 266-278, 2014.
[13] Garyfallidis, E., Brett, M., Amirbekian, B., Rokem, A., van der Walt, S., Descoteaux, M. and Nimmo-Smith, I., “Dipy, a library for the analysis of diffusion MRI data,” Front. Neuroinform. 8, 8 (2014).
Figures