3964
Whole Brain Simultaneous MultiSlice Filter EXchange Imaging in less than 15 minutes: Initial Results1Siemens Healthcare AB, Malmö, Sweden, 2Department of Medical Radiation Physics, Lund University, Lund, Sweden
Synopsis
Keywords: Data Acquisition, Diffusion/other diffusion imaging techniques, Neuro, Microstructure
Filter EXchange Imaging (FEXI) is sensitive to the rate of diffusional water exchange, which depends among other factors on the cell membrane permeability. FEXI maps the so-called apparent exchange rate (AXR), however, previous FEXI protocols were limited to few slices because of very long acquisition times. In this proof-of-concept work, Simultaneous MultiSlice was included in the FEXI sequence and with protocol optimization allowed for a 12-minute whole-brain scan. FEXI accelerated with or without SMS showed similar AXR values.Introduction
Filter EXchange Imaging (FEXI)1,2 is a diffusion MRI technique that provides estimates of the so-called apparent exchange rate (AXR). This parameter depends among other factors on the cell membrane permeability3 which might be a marker for tumor grading and a faster treatment response marker compared to ADC4. FEXI is based on a double diffusion encoding sequence5, where the two encoding blocks are separated by a mixing period tmix which can be several hundred milliseconds long. A FEXI experiment for one slice and one diffusion direction thus takes up to half a second, which limits its use in clinical research where many slices, diffusion directions and mixing times are acquired. It is therefore only natural to combine FEXI with Simultaneous MultiSlice (SMS)6 as it allows the simultaneous acquisition of two or more slices. This proof-of-concept study, to our knowledge, presents the first results ever acquired with SMS-FEXI in a phantom and the in vivo brain.Methods
The proposed FEXI research sequence from Lasič et al.2 was adapted to allow for using excitation and refocusing pulses for SMS acceleration (schematic diagram shown in Figure 1). The mixing period is characterized by a duration tmix and includes a spoiler gradient. At the end of the pulsed gradient spin-echo (PGSE) filter block and the beginning of the PGSE detection block are equally sized spoilers. All experiments were performed on a MAGNETOM Prisma with a 64-channel head coil (Siemens Healthcare, Erlangen, Germany) using a research sequence to perform FEXI experiments. Image analysis and AXR estimation were performed in Matlab (The Mathworks, Natick, MA, USA). The data were processed by a software package for diffusion MRI7,8.The FEXI experiments consisted of three acquisitions (I), (II), (III) to estimate the AXR. Sequence parameters are summarized in Table 1. FEXI measurement with acceleration factor 2 (GRAPPA) and 4 (GRAPPA and SMS), referred to as FEXI and SMS-FEXI, respectively, were performed in a phantom with a yeast suspension and in one healthy volunteer. Test-retest experiments were performed in the phantom. The post-processing of the FEXI images consisted of denoising using Marchenko-Pastur principal component analysis9, correction for motion and eddy currents in Elastix10 using an extrapolation-based reference volume11. The AXR was estimated from FEXI and SMS-FEXI in one region of interest (ROI) within the phantom. AXR test-retest evaluation was performed over the complete middle slice by linear regression and modified Bland-Altman analysis. FEXI AXR and SMS-FEXI AXR were estimated in the volunteer’s brain in several ROIs in four slices.Results
S0, ADC and AXR maps are presented for the middle slice of the phantom in Figure 2. For the selected ROI, the AXR values were similar for the regular FEXI and SMS-FEXI, but a variation of AXR is visible across the slice for both. Test–retest of AXR showed good agreement (Figure 3). Higher AXR values seemed to be obtained in the phantom with SMS-FEXI compared to FEXI (Figure 3e and 3f).In vivo AXR maps are shown for four slices in Figure 4 illustrating the whole brain coverage. Mean and standard deviation of both FEXI and SMS-FEXI ADC and AXR values are reported for the ROIs.
Head motion occurred between the two experiments leading to different slices being acquired. Therefore, ROIs were place in similar brain regions to compare AXR values.
Chemical shift artifact of the fat signal are visible when the PGSE filter is ON (data not shown here). The resulting error is visible in the FEXI AXR maps, cf. yellow arrow in Figure 4. The fat artefacts in the FEXI AXR maps could be mitigated by using a different fat saturation as used for SMS-FEXI (cf. Table 1).
Discussion
Variations across the AXR maps are visible for both FEXI and SMS-FEXI (Figure 2d and 2h) but are not visible in the corresponding ADC maps (Figure 2b and 2f). These might be due to small vibrations within the phantom during the FEXI and SMS-FEXI experiments. In addition, the spoilers within the sequence could be too weak resulting in signal variations from spurious echoes. The test-retest analysis (Figure 3) showed that both FEXI and SMS-FEXI are stable.Qualitatively, the image quality of the FEXI and SMS-FEXI was satisfactory. Chemical shift artefacts were observed in the FEXI acquisitions. Similar ADC and AXR values were found within the ROIs shown in Figure 4. Higher AXRs are present in the frontal cortex (Figure 4c, 4d, 4e and 4f) compared to other regions of the brain which was previously reported2,4.
Conlcusion
In this proof-of-concept work, SMS-FEXI was introduced and compared to FEXI . Both set of experiments resulted in similar AXR values in the phantom and no strong bias or variation in the test-retest was detected. Similarly, AXR values in several ROIs within brain regions were similar. In conclusion, whole brain FEXI experiment could be performed in less than 12 minutes using SMS which makes it feasible to be included for clinical research.Acknowledgements
No acknowledgement found.References
1. Lasič S, Nilsson M, Lätt J, Ståhlberg F, Topgaard D. Apparent exchange rate mapping with diffusion MRI. Magn Reson Med. 2011;66(2):356-365. doi:10.1002/mrm.22782
2. Nilsson M, Lätt J, Van Westen D, et al. Noninvasive mapping of water diffusional exchange in the human brain using filter-exchange imaging. Magn Reson Med. 2013;69(6):1572-1580. doi:10.1002/mrm.24395
3. Khateri M, Reisert M, Sierra A, Tohka J, Kiselev VG. What does FEXI measure? NMR Biomed. 2022;(July):1-9. doi:10.1002/nbm.4804
4. Lampinen B, Szczepankiewicz F, van Westen D, et al. Optimal experimental design for filter exchange imaging: Apparent exchange rate measurements in the healthy brain and in intracranial tumors. Magn Reson Med. 2017;77(3):1104-1114. doi:10.1002/mrm.26195
5. Mitra PP. Multiple wave-vector extensions of the NMR pulsed-field-gradient spin-echo diffusion measurement. Phys Rev B. 1995;51(21):74-78.
6. Setsompop K, Gagoski BA, Polimeni JR, Witzel T, Wedeen VJ, Wald LL. Blipped-controlled aliasing in parallel imaging for simultaneous multislice echo planar imaging with reduced g-factor penalty. Magn Reson Med. 2012;67(5):1210-1224. doi:10.1002/mrm.23097
7. Nilsson M, Szczepankiewicz F, Lampinen B, et al. An open-source framework for analysis of multidimensional diffusion MRI data implemented in MATLAB. In: In Proc Intl Soc Mag Reson Med. Paris, France; 2018:5355.
8. https://github.com/markus-nilsson/md-dmri.
9. Veraart J, Fieremans E, Novikov DS. Diffusion MRI noise mapping using random matrix theory. Magn Reson Med. 2016;76(5):1582-1593. doi:10.1002/mrm.26059
10. Klein S, Staring M, Murphy K, Viergever MA, Pluim JPW. Elastix: A toolbox for intensity-based medical image registration. IEEE Trans Med Imaging. 2010;29(1):196-205. doi:10.1109/TMI.2009.2035616
11. Nilsson M, Szczepankiewicz F, Van Westen D, Hansson O. Extrapolation-based references improve motion and eddy-current correction of high B-value DWI data: Application in Parkinson’s disease dementia. PLoS One. 2015;10(11):1-22. doi:10.1371/journal.pone.0141825
Figures
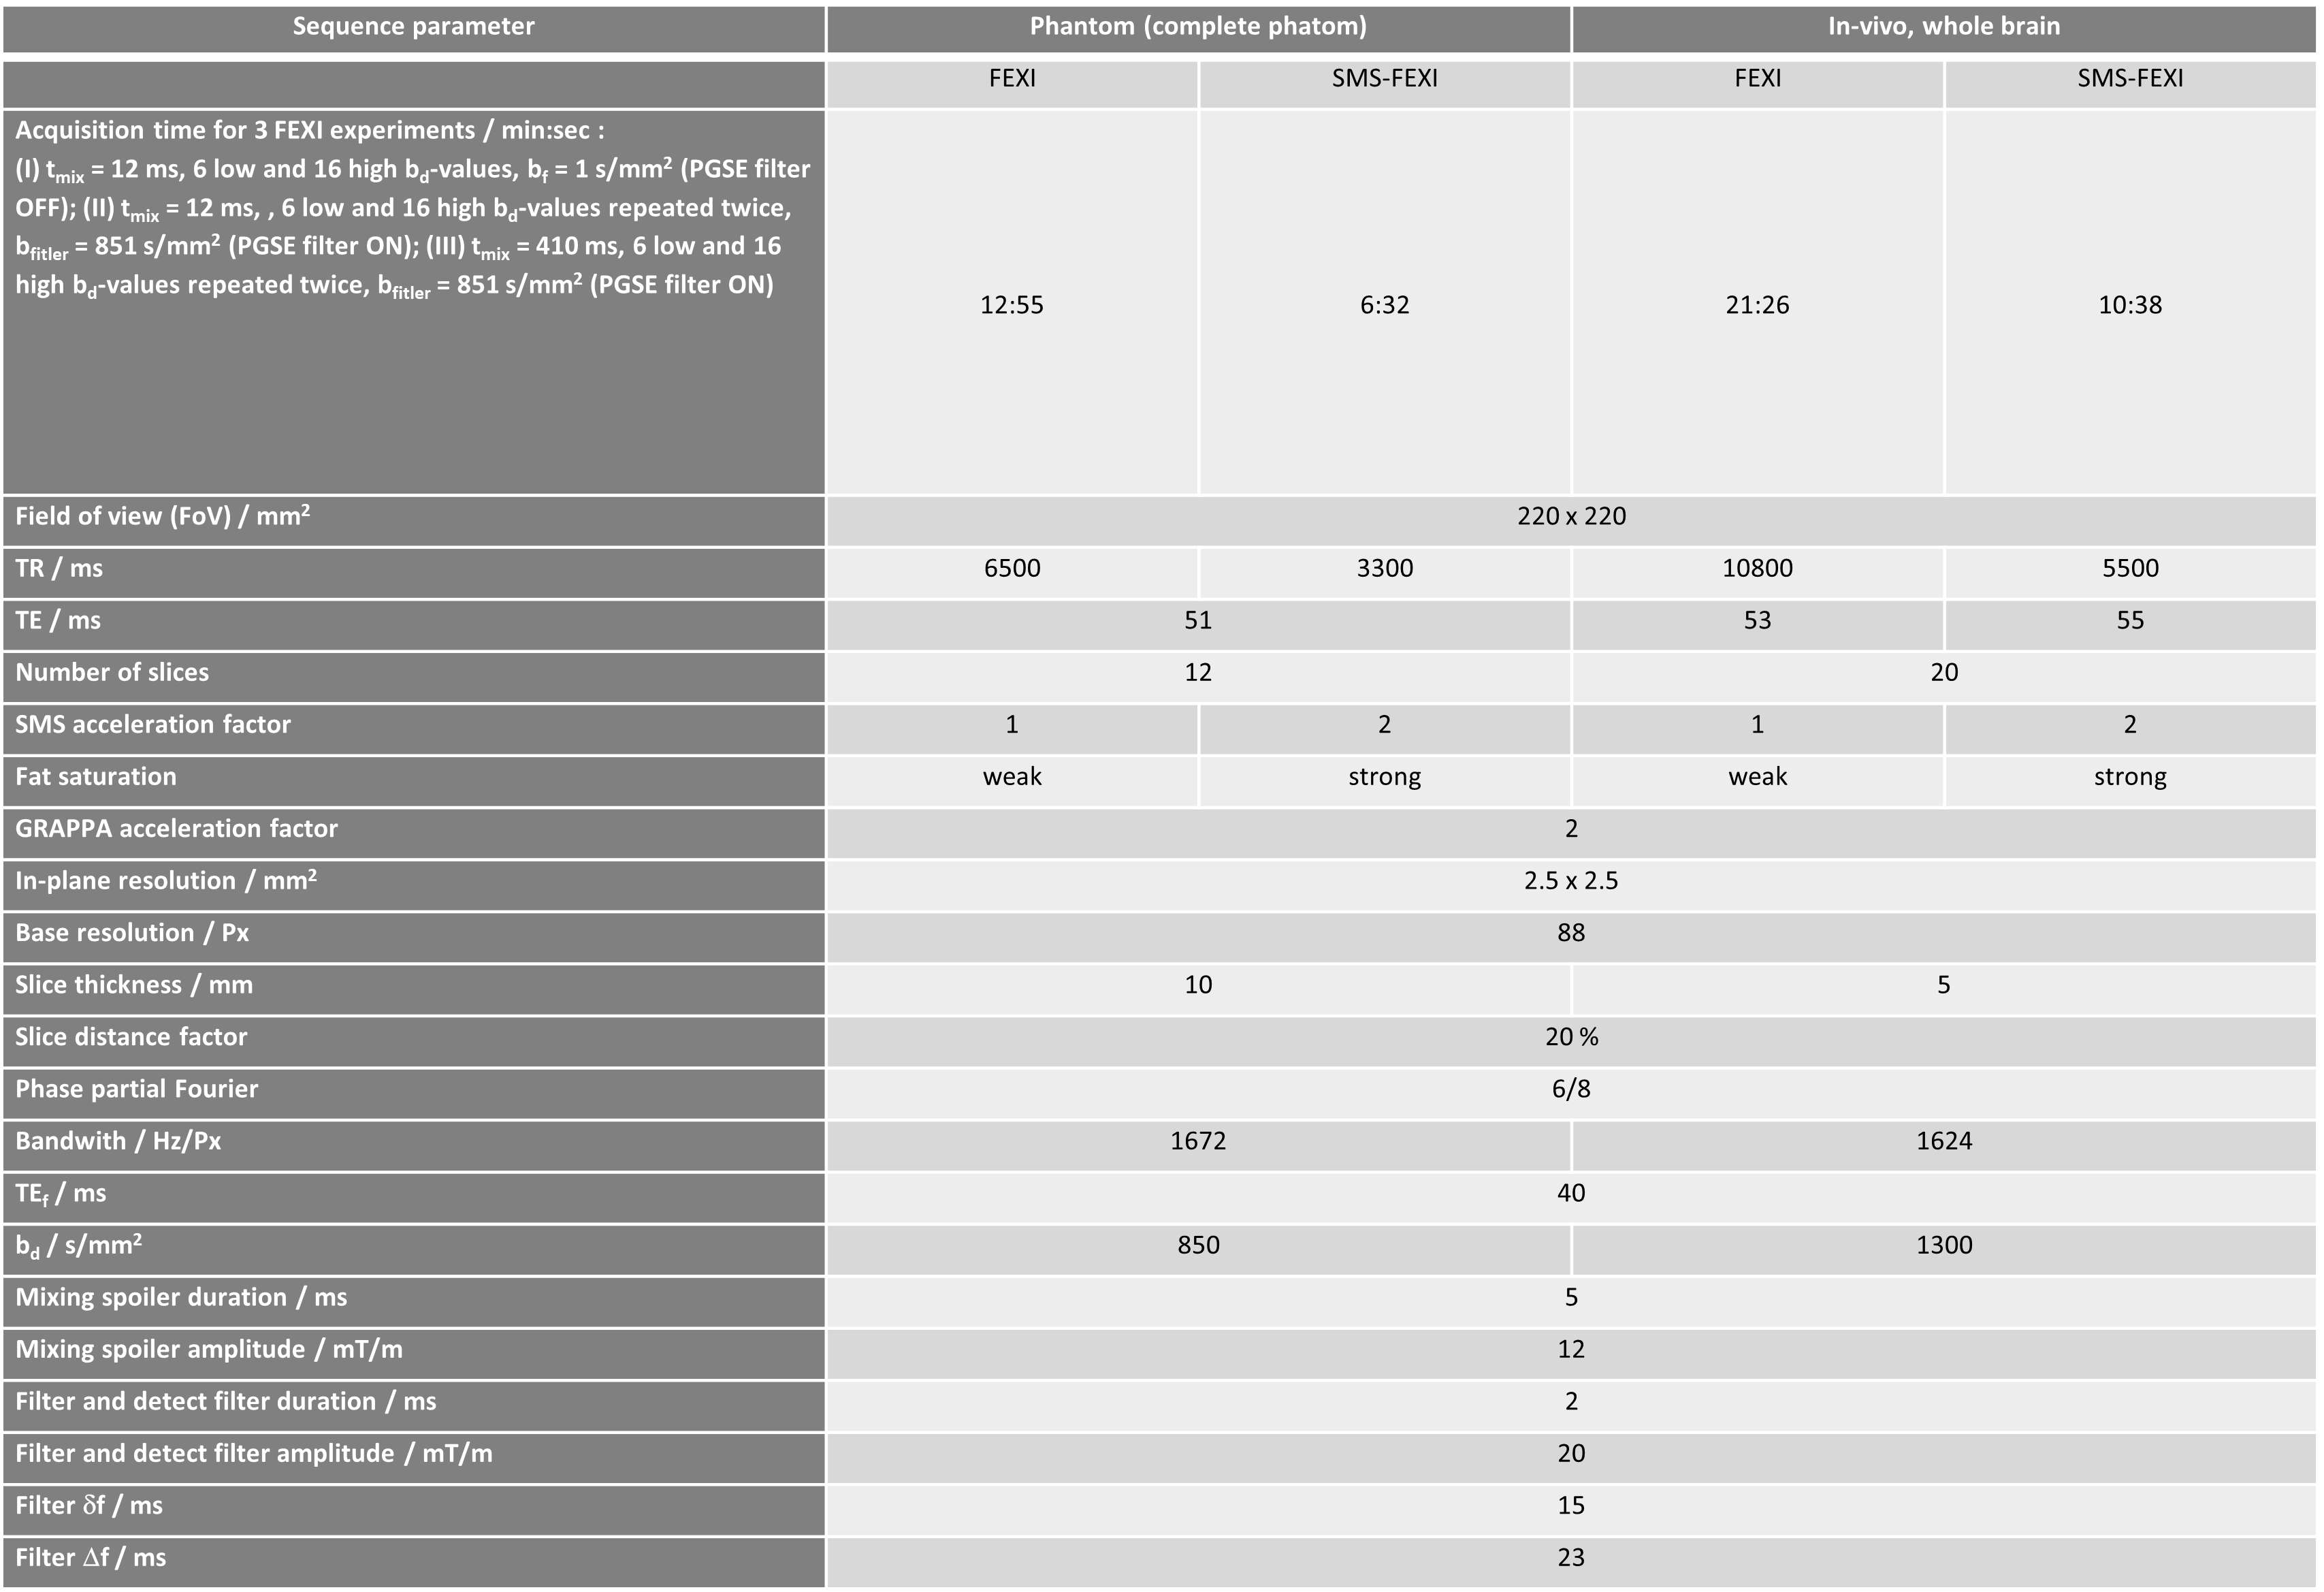
Table 1: Sequence Parameters. List of relevant sequence parameters for the phantom and the in vivo experiments. The sequence parameters and the number of FEXI experiments were chosen to be close to the optimal sequence parameters proposed in Lampinen et al.4.
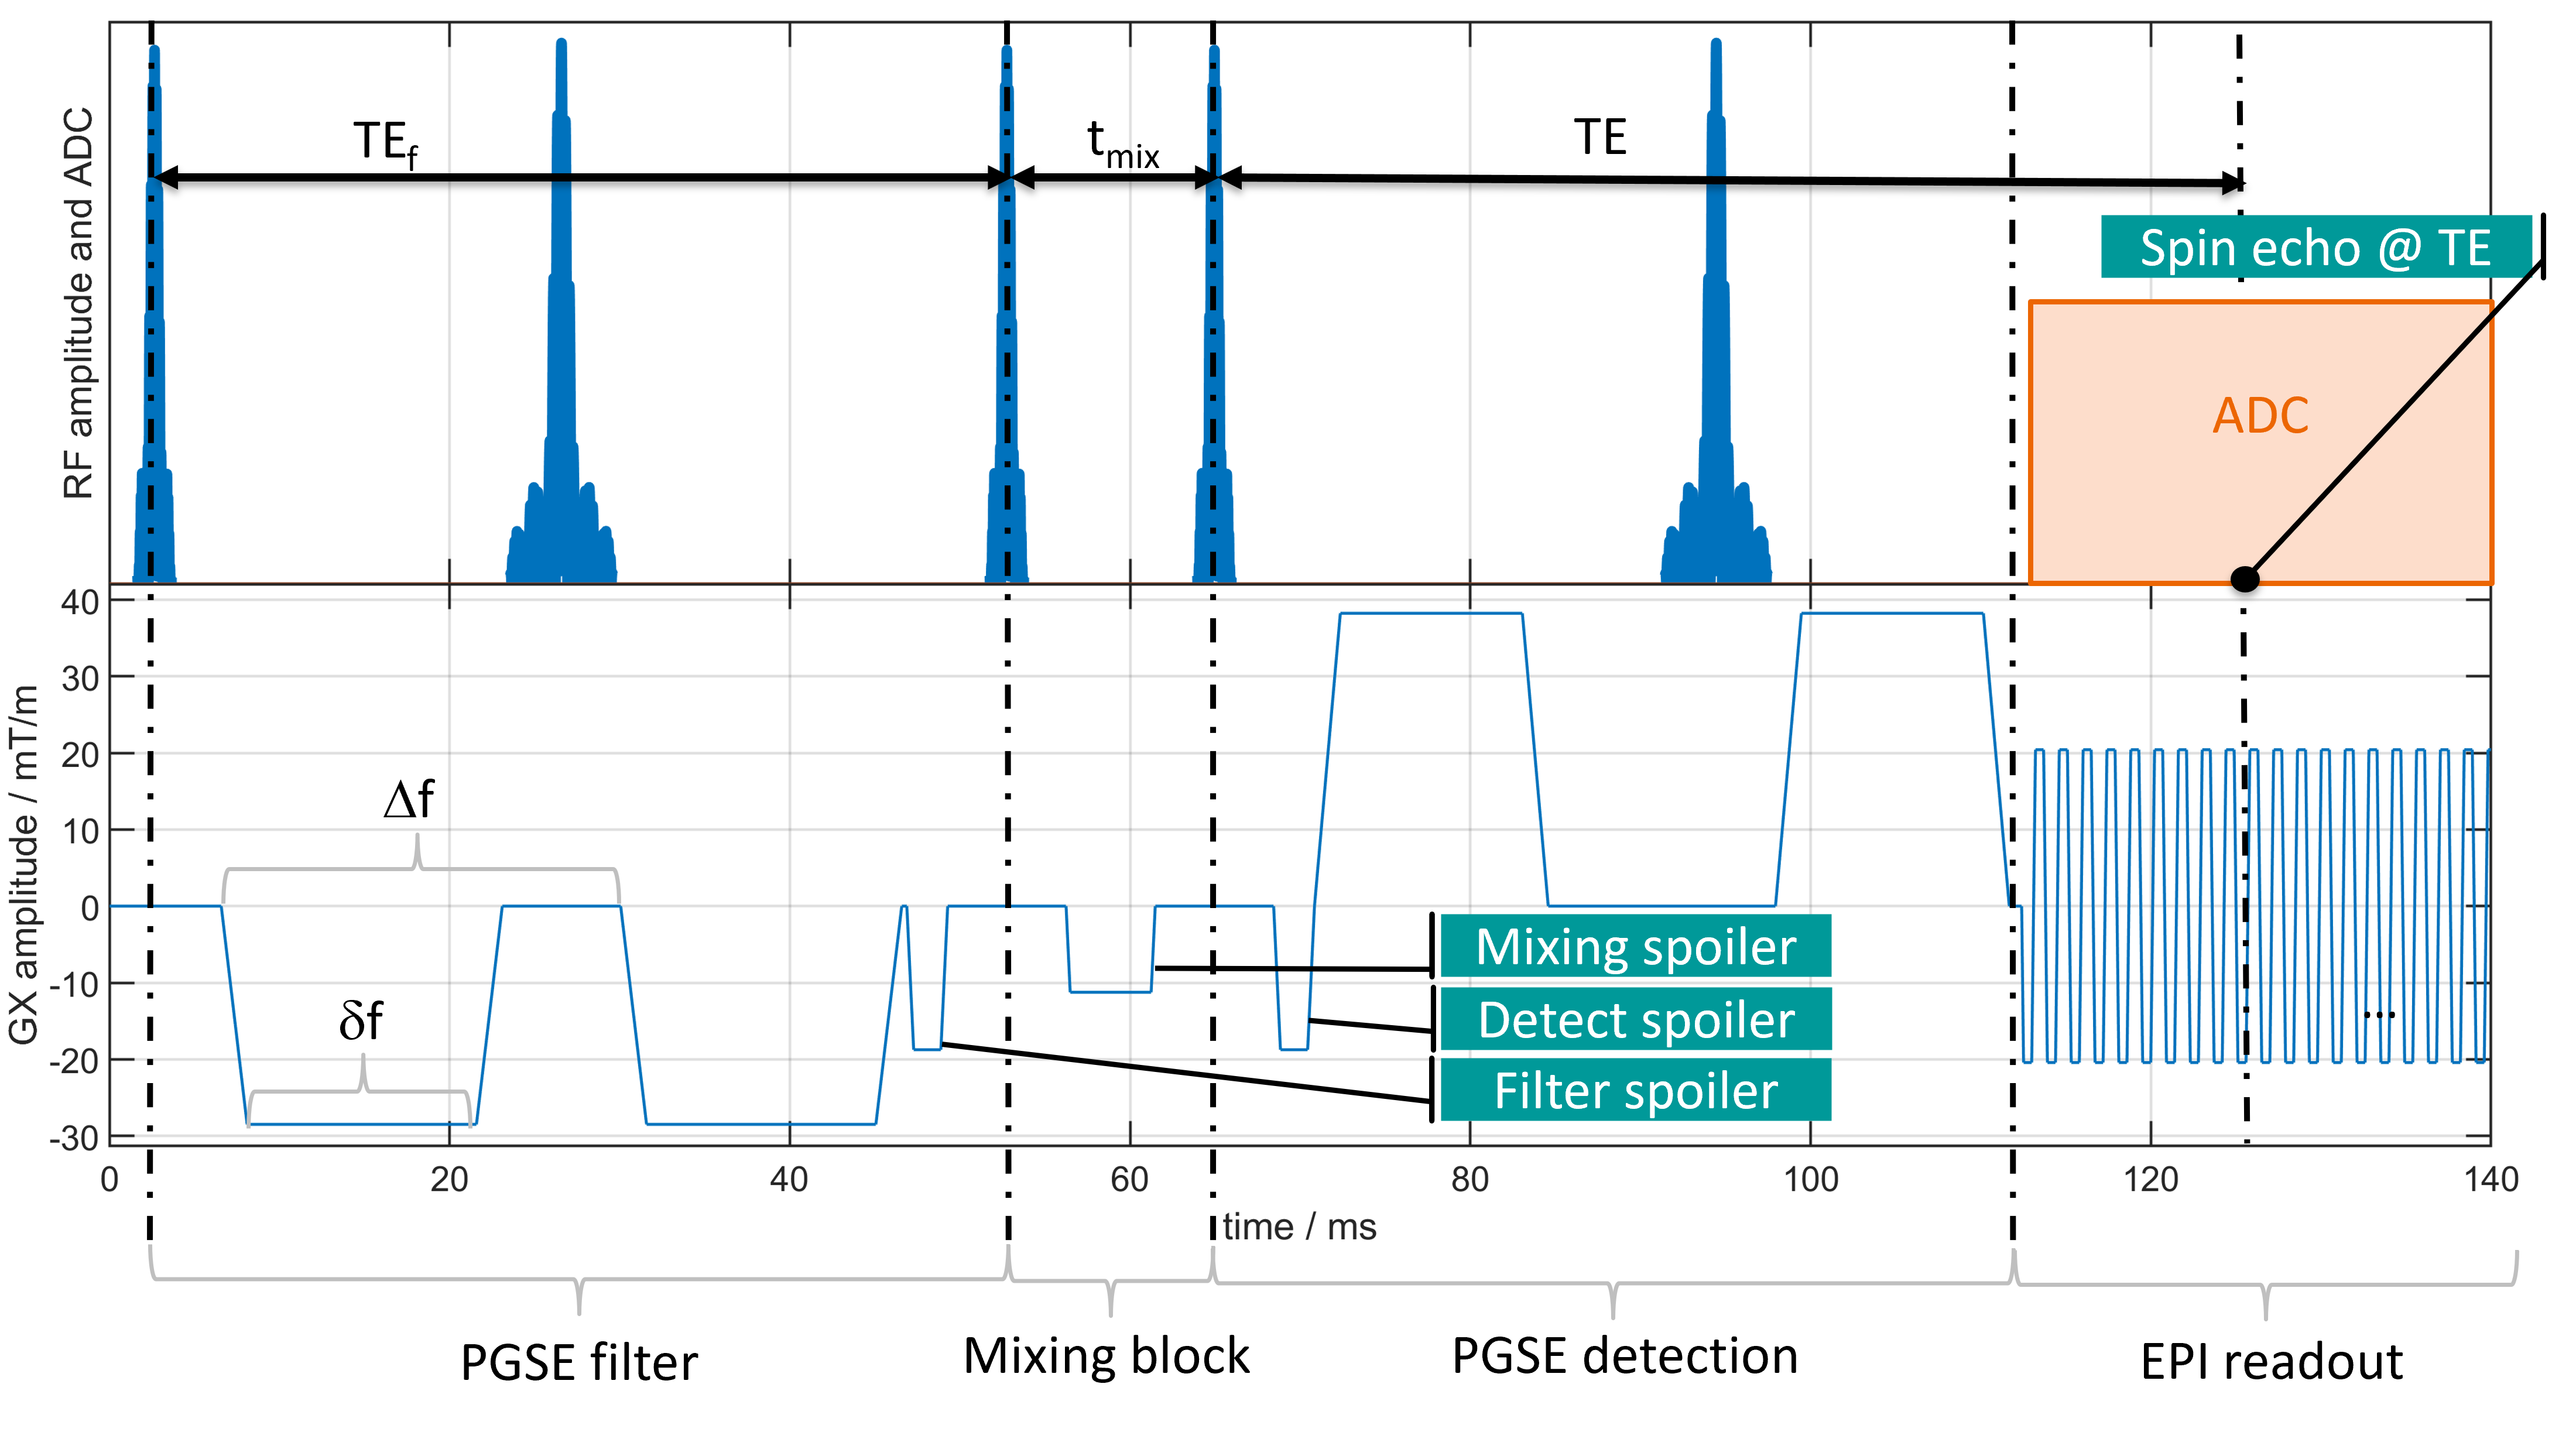
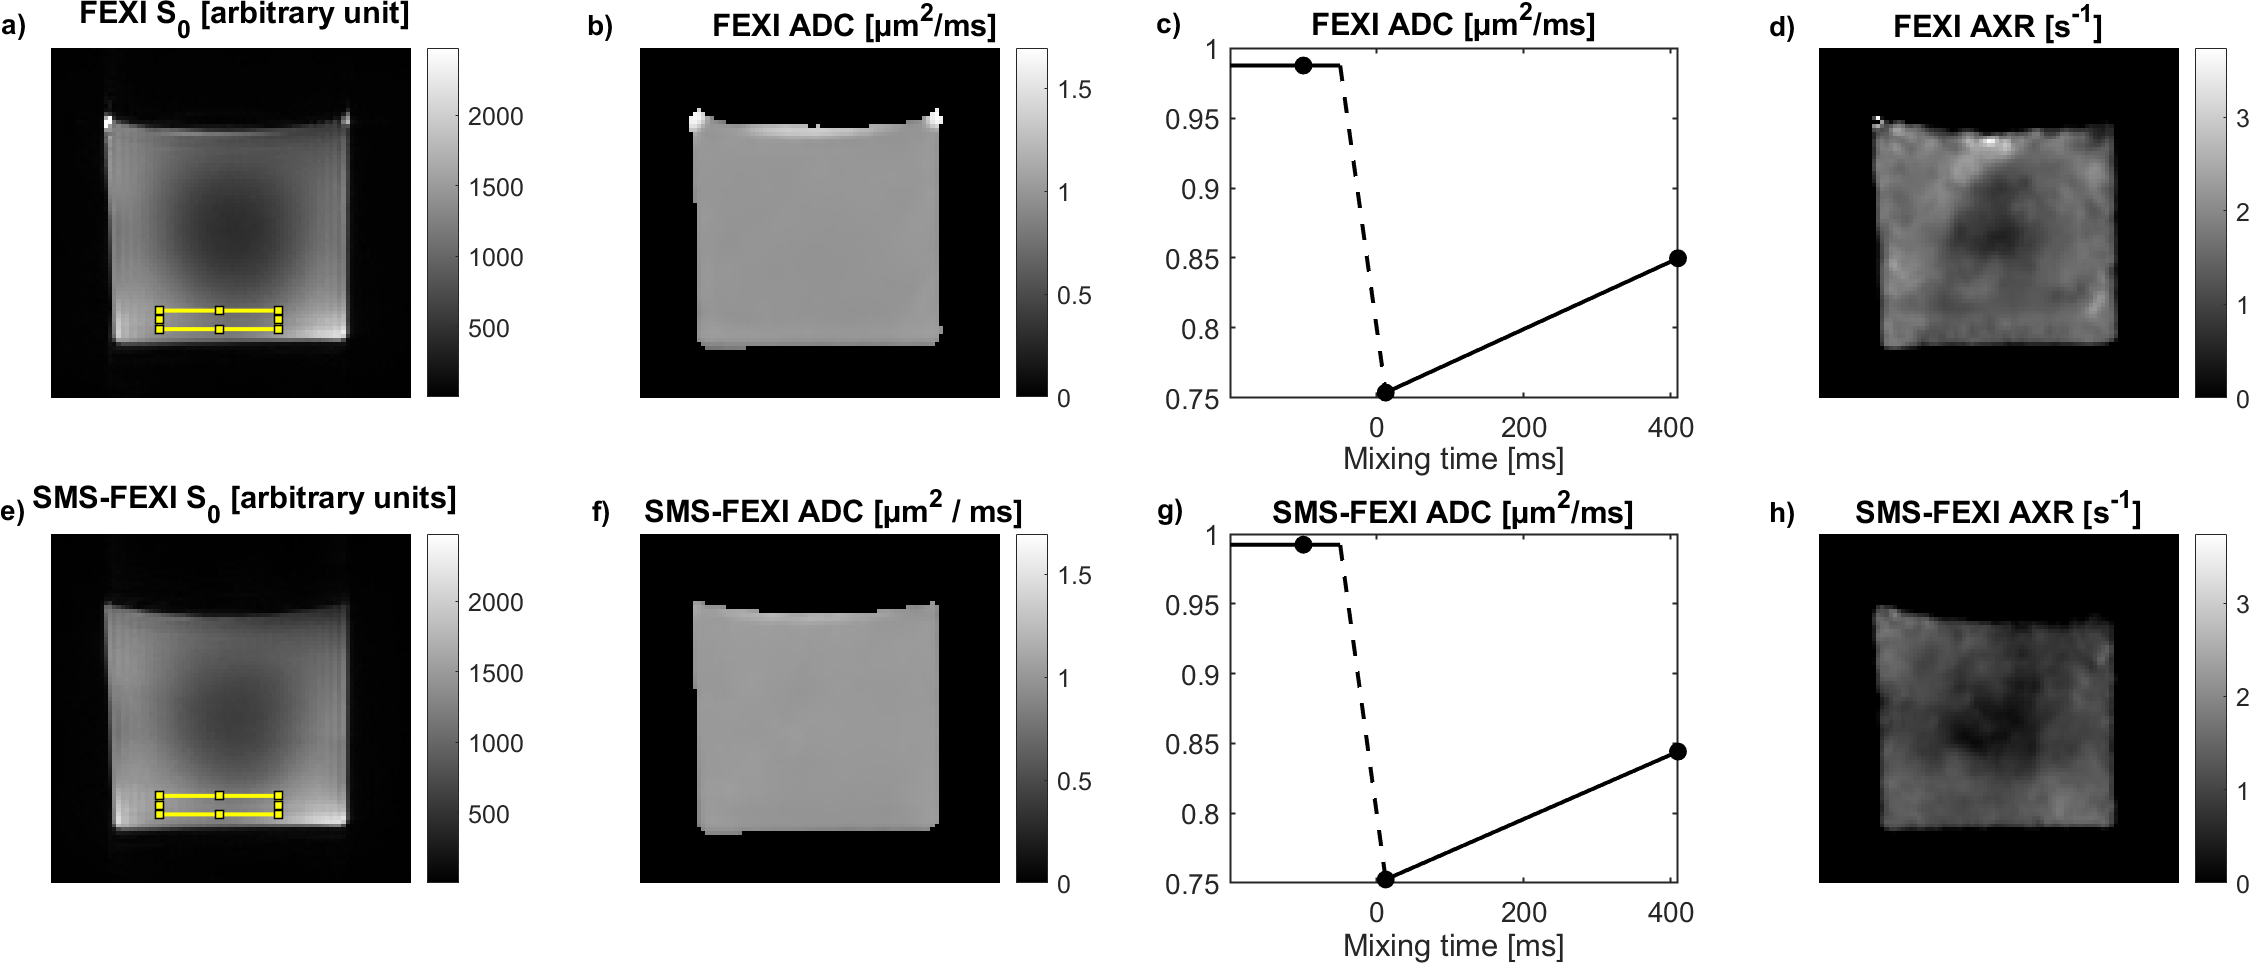
Figure 2: Results in phantom. FEXI S0, ADC and AXR of the middle slice are shown in a), b) and e), respectively. FEXI ADC in dependence of tmix for the ROI visible in a) is shown in c). SMS-FEXI S0, ADC and AXR of the middle slice are shown in e), f) and h), respectively. SMS-FEXI ADC in dependence of tmix for the ROI visible in e) (same position as ROI in Figure 2a)) is shown in g). Variations of the AXR values are visible across the slice for both FEXI and SMS-FEXI.
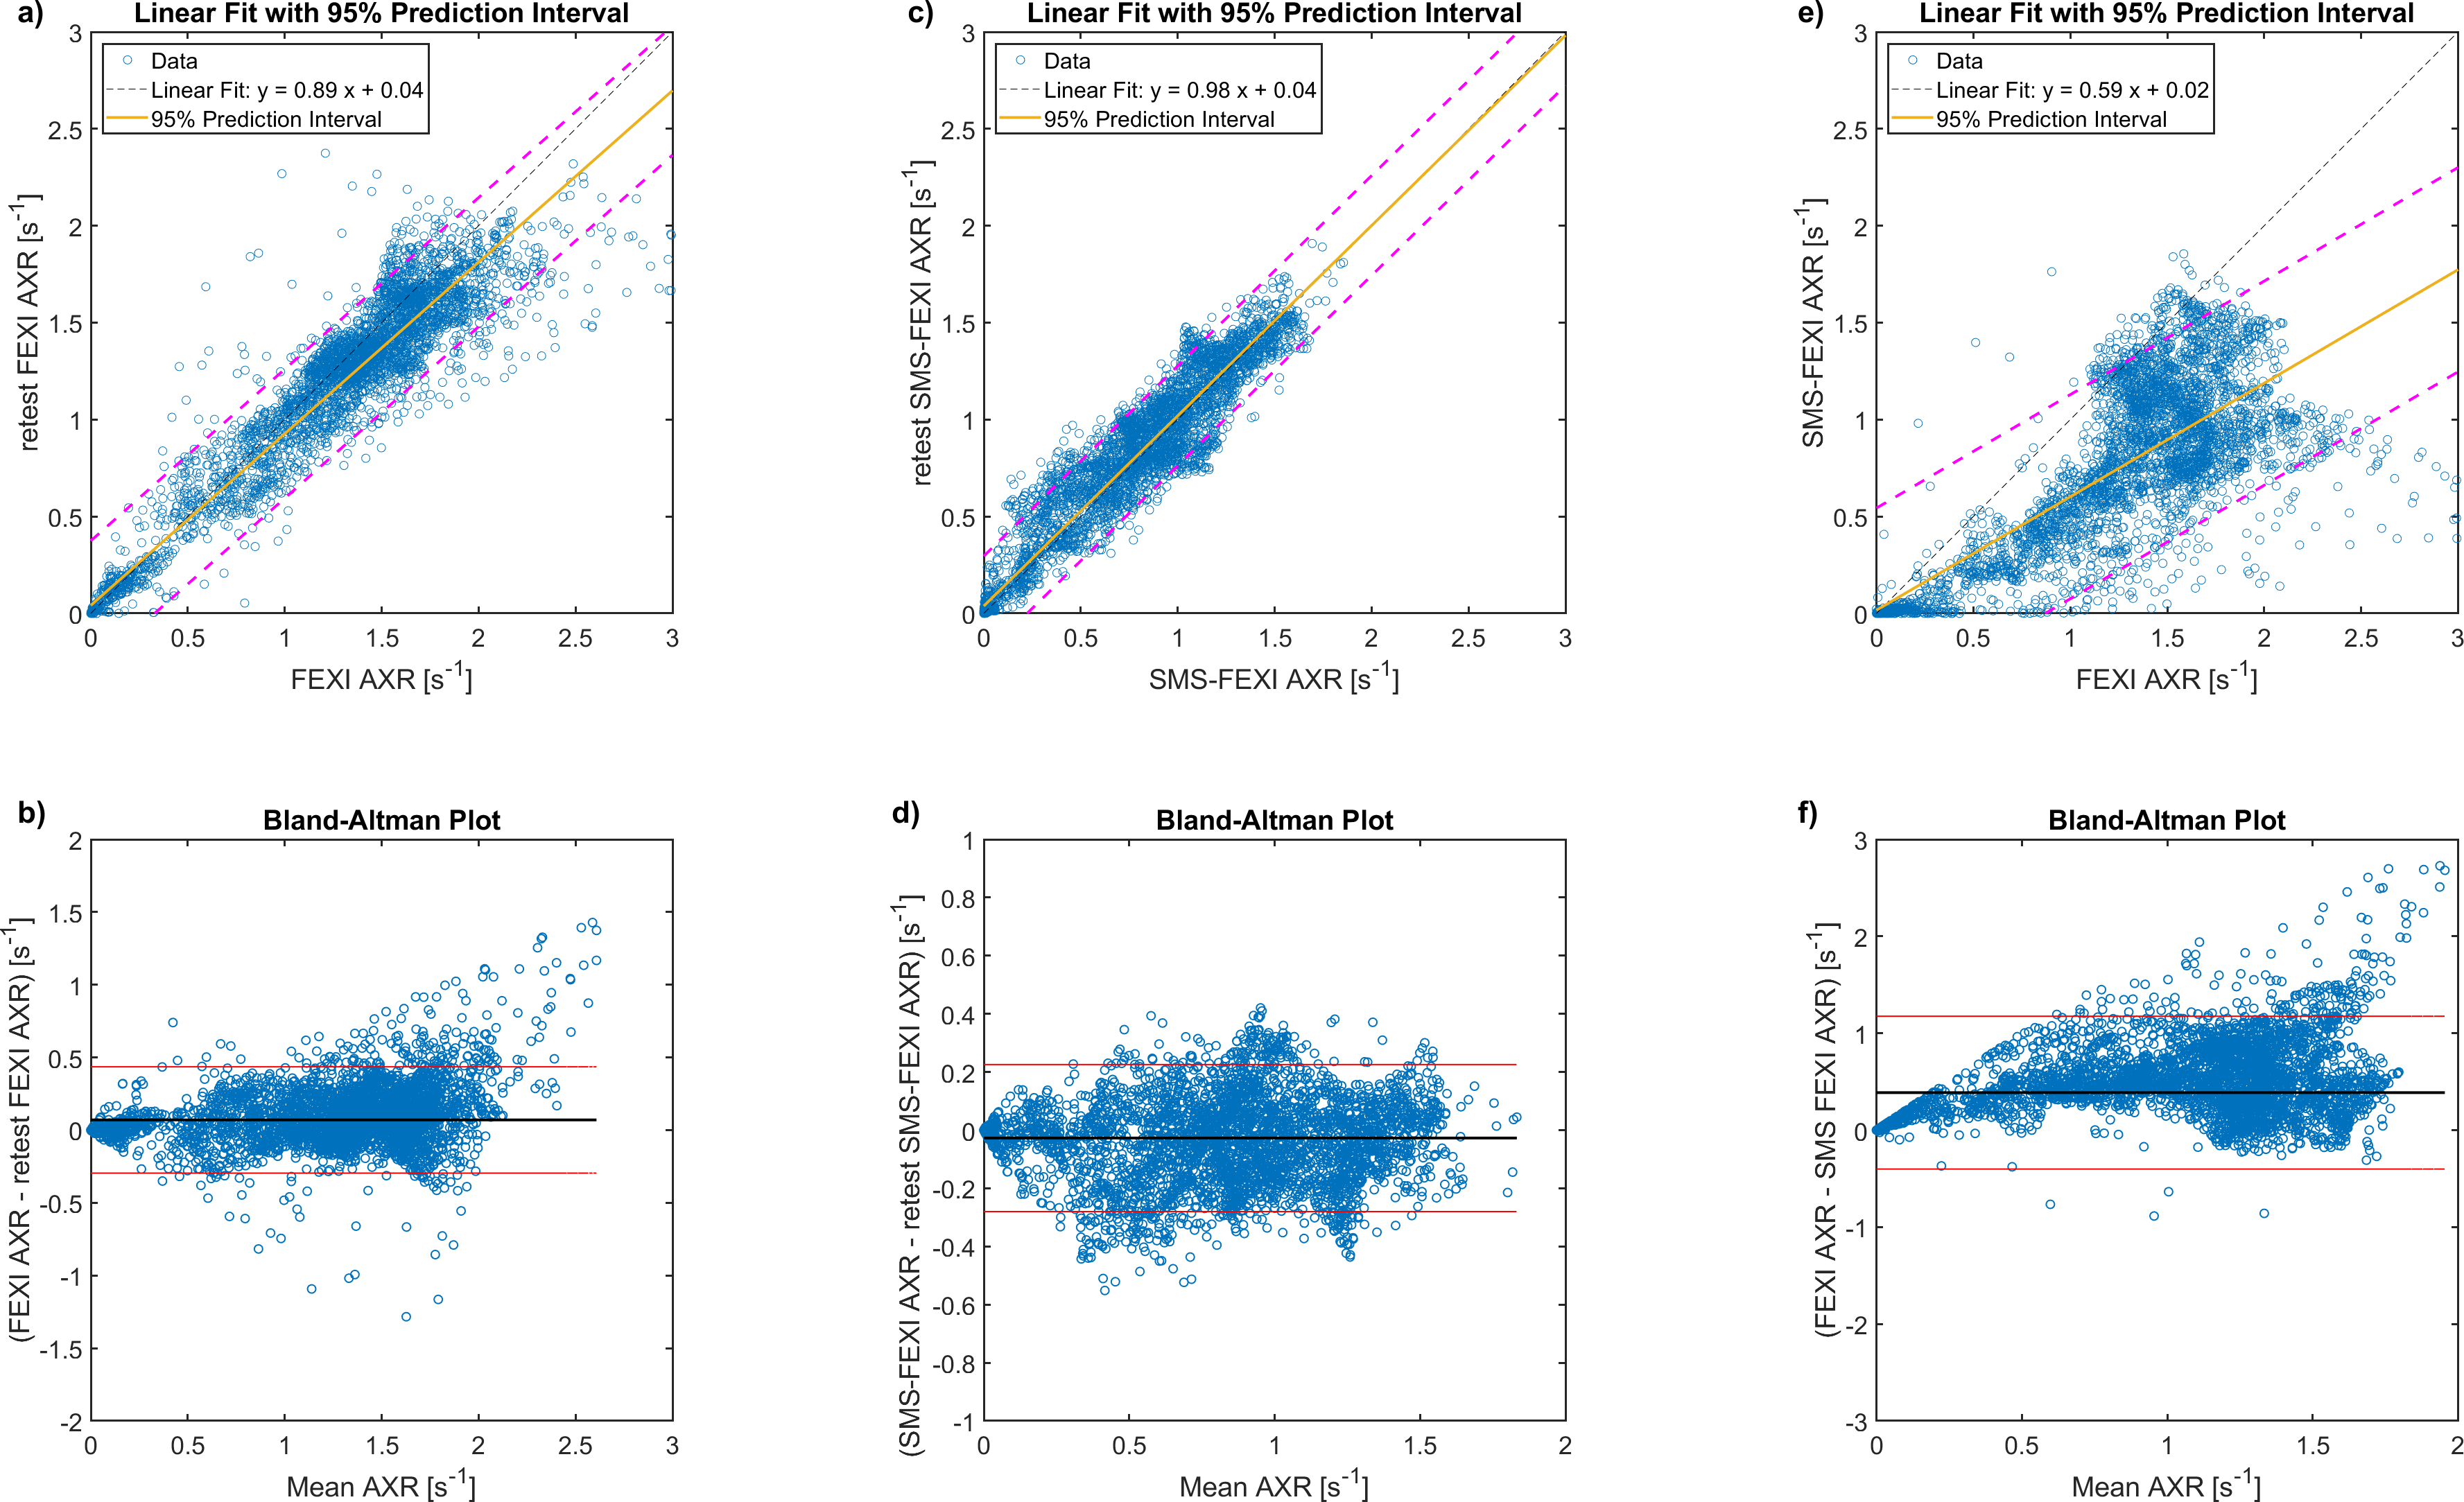
Figure 3: Test–retest Analysis of the middle slice of the phantom. Linear regression and modified Bland Altman plots for test–retest for FEXI AXR and SMS-FEXI AXR are shown in a), b) and c), d), respectively. Linear regression and modified Bland Altman for FEXI AXR versus SMS-FEXI AXR over the same slice is shown in e) and f).
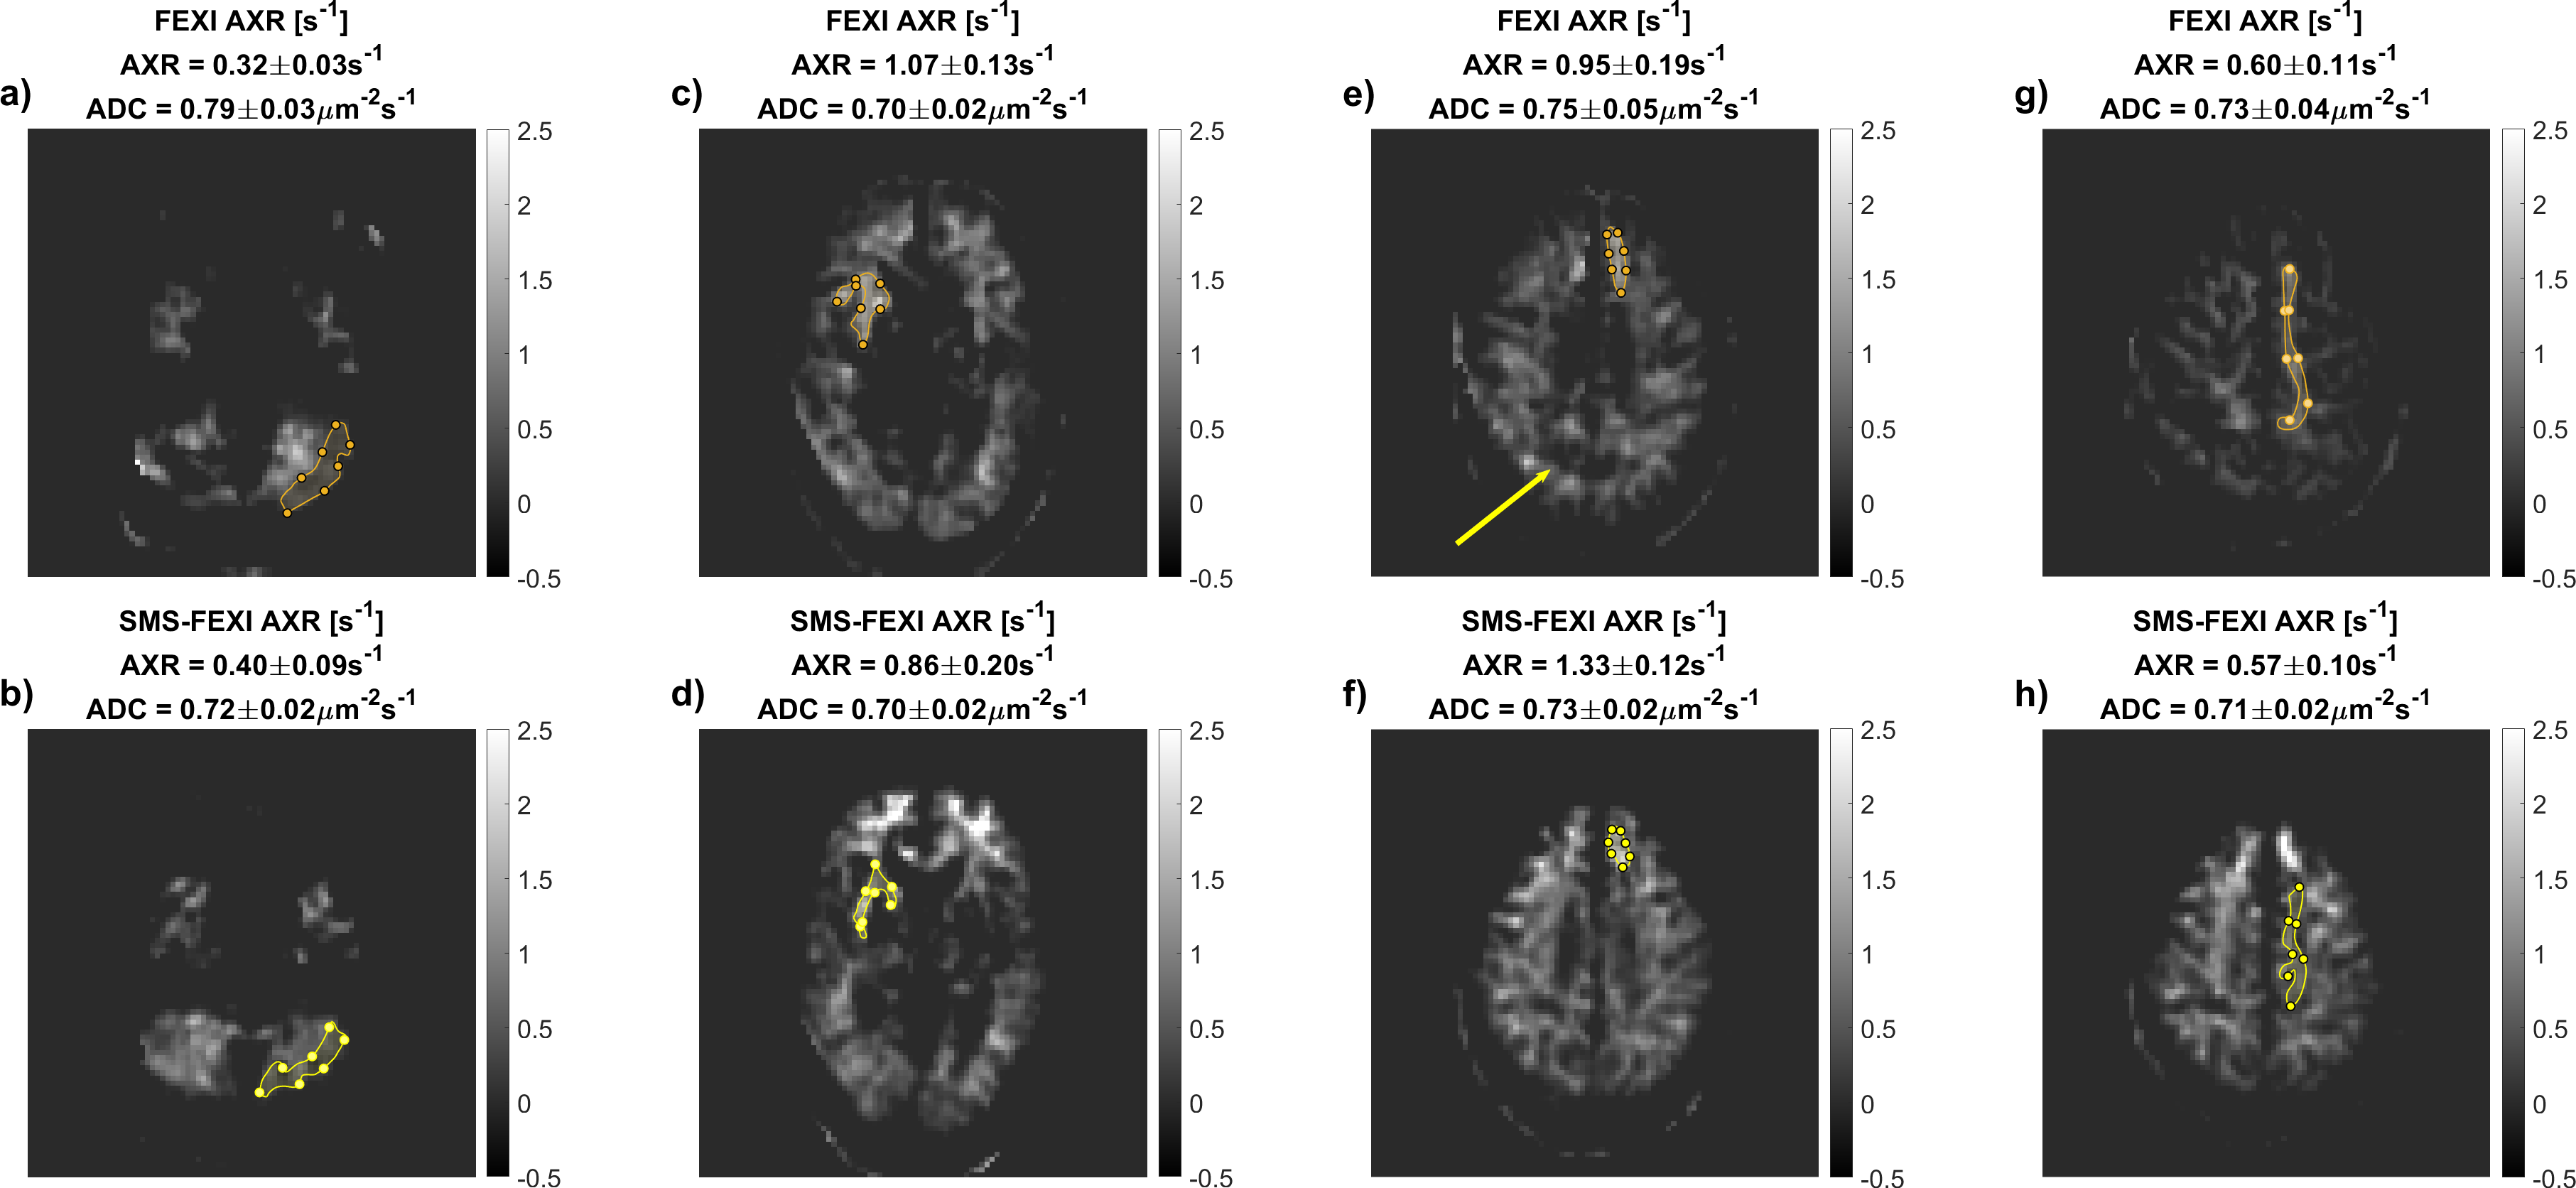
Figure 4: In vivo AXR. FEXI AXR and SMS-FEXI AXR maps are presented in a), c) e), g), and b), d), f) h), respectively, for four slices. Comparable slices and ROIs in similar regions were selected and drawn for comparing estimated AXR values because of large head motion which occurred between both acquisitions. The ROI outlined in orange and yellow were drawn within the FEXI AXR and SMS-FEXI AXR maps, respectively. The ADC of the same ROIs is provided for completeness. The yellow arrow points to a chemical shift artefact.