3956
A comparison of navigator-free multi-shot spiral and EPI in high-resolution DWI1Center for Biomedical Imaging Research, Department of Biomedical Engineering, School of Medicine, Tsinghua University, Beijing, China
Synopsis
Keywords: Data Acquisition, Diffusion/other diffusion imaging techniques
Navigator-free multi-shot spiral and EPI acquisitions have been developed to achieve 2D high-resolution diffusion imaging. In this study, we investigated the off-resonance effects of spiral and iEPI samplings with different partial Fourier factors based on a signal model. Moreover, the SNR performances of the two multi-shot acquisitions at different resolutions and TEs were also explored. In summary, compared with iEPI, spiral provides superior SNR in multi-shot navigator-free DWI at various resolutions and TEs, even when the TE of spiral acquisition is slightly longer than that of iEPI. However, off-resonance correction for spiral sampling with ultra-long readout durations is more challenging.Introduction
Diffusion-weighted imaging (DWI) can provide information of tissue microstructures by probing the Brownian motion of water molecules 1. To achieve high-resolution diffusion imaging, various multi-shot techniques have been developed 2-8. The primary issue of multi-shot DWI is to correct shot-to-shot phase variations using either navigators or navigator-free acquisitions, while the latter having the highest data acquisition efficiency. Both multi-shot spiral and interleaved EPI (iEPI) have been developed to achieve navigator-free diffusion imaging 9,10. Previous studies have investigated the signal-to-noise (SNR) differences between single-shot spiral and EPI DWI 11,12. However, the performance difference on image quality and scan efficiency for multi-shot spiral and EPI DWI has not been compared. In this study, we investigated the off-resonance performances of spiral and EPI acquisitions with different partial Fourier (PF) factors based on a generalized signal model. Moreover, their SNR performances at different resolutions with different TEs were also investigated.Methods
1. Theoretical analysis of off-resonance effectsThe off-resonance effects of spiral and EPI were analyzed based on a signal model:
$$s(\overrightarrow{k})=\int \rho (\overrightarrow{r}) \cdot e^{j2\pi\overrightarrow{k}\cdot\overrightarrow{r}} \cdot e^{j2\pi∆f_0 (\overrightarrow{r}) \cdot t(\overrightarrow{k})}dr$$
where $$$∆f_0(\overrightarrow{r})$$$denotes the off-resonance frequency, and $$$t(\overrightarrow{k})$$$ is the time map of spiral and EPI samplings in k-space. $$$H(\overrightarrow{k})=e^{j2\pi∆f_0 (\overrightarrow{r})\cdot \overrightarrow{k}} $$$ is the spatially varying phase term. The corresponding PSF $$$h(\overrightarrow{k})=FFT[H(\overrightarrow{k})]$$$can reflect the off-resonance effects for spiral and EPI acquisitions.
2. Data acquisition
All experiments were performed on a Philips Ingenia CX 3.0T scanner using a 32-channel head coil. The gradient system was operated at a maximum gradient strength of 31 mT/m and with a maximum slew rate of 200 mT/m/ms. The detailed acquisition parameters are listed in Table 1. Pre-emphasis was used to correct the uniform-density spiral gradient waveforms. For iEPI acquisitions, the shortest TE was used. Moreover, diffusion images were acquired with a single phase-encoding (PE) polarity. For b=0, a pair of images were acquired with opposite PE directions such that the topup method was used to perform distortion correction for iEPI images. In all experiments, SPIR technique was used to suppress fat signals.
Experiment 1, multi-shot spiral DWI and iEPI DWI with different PF-factors. FOV=210×210mm2, resolution=0.99×0.99mm2, matrix=212×212, b-value=1000 s/mm2, 12 diffusion directions. The PF-factors for iEPI are set to 1.0, 0.7 and 0.6, respectively.
Experiment 2, multi-shot spiral and iEPI DWI with different resolutions. FOV=210×210mm2, b-value=1000 s/mm2, 3 diffusion directions.
Experiment 3, multi-shot spiral DWI at different TEs. FOV=210×210mm2, b-value=1000 s/mm2, 3 diffusion directions.
3. Image reconstruction and processing
For iEPI data, N/2 ghost correction was implemented using a SVD-based method 13. The POCS algorithm 14 was used to calculate partial Fourier iEPI k-space data. Then, the spiral and iEPI diffusion images were off-line reconstructed using POCS-ICE 10. Particularly, for the spiral images, CPR method was used for off-resonance correction 15. FSL topup was used to correct distortions in the iEPI images 16,17. The SNR analysis was conducted using the Monte Carlo-based pseudo multiple replica method 18. $$$SNR gain [\%]=\frac{(SNR_{spiral}-SNR_{EPI})}{SNR_{EPI}}\times 100\%$$$. Moreover, the spatial encoding efficiency ratio $$$\eta [\%]=\frac{( AQ_{EPI}-AQ_{spiral} )}{AQ_{spiral}} \times 100\%$$$. AQ is the readout duration.
Results and Discussion
1. Spatial encoding efficiencyThe spiral readout duration is shorter than the iEPI readout when using the same matrix and shot number. The related parameters are listed in Table 1. Even with PF=0.6 for iEPI, spiral samplings still show 11.5% higher spatial encoding efficiency for a 212×212 matrix. This value can be even larger with increased resolution.
2. Off-resonance effects
For the impacts of field inhomogeneity on spiral and iEPI acquisitions, the results of theoretical analysis are shown in Figure 1. Specifically, the off-resonance effects only cause PSF shifts along the phase-encoding dimension in iEPI. This one-dimensional distortion induced by field inhomogeneity can be mitigated by PF. In contrast, for the spiral acquisition, PSF is broadened and exhibits ringing across the entire two-dimensional plane. This indicates that the off-resonance effects for spiral sampling is more severe. Figure 2 shows two representative slices without and with off-resonance correction. There is a little blurring in the iEPI (PF=0.6) DWI. For spiral DWI, residual artifacts are visible at the frontal lobe.
3. SNR performance with different PF-factors
Figure 3 shows the SNR maps of DWI acquired by spiral and iEPI (with PF-factors of 1.0, 0.7 and 0.6). Spiral DWI shows the SNR benefits over the counterparts.
4. SNR performance with different resolutions
Figure 4A shows the SNR maps of DWI acquired by spiral and iEPI (PF=0.6) DWI with different resolutions. The SNR gain is marked at the bottom of the image. As expected, for higher-resolution DWI, the SNR benefits of spiral imaging is further increased. However, the off-resonance correction for spiral images is more challenging due to ultra-long spiral readouts.
5. SNR performance with different TEs
Figure 4B shows the SNR maps of DWI. Generally, the spiral acquisition provides higher SNR even when the TE of spiral readouts is equal to or slightly longer than that of iEPI with PF=0.6. The results indicate that PF would cause the SNR loss due to the incomplete k-space samplings. Experiment 1 demonstrates that the SNR benefits from PF for iEPI is obvious, whereas slight SNR loss occurs due to the reduced readout window.
Acknowledgements
No acknowledgement found.References
1. Le Bihan D, Breton E, Lallemand D, et al. MR imaging of intravoxel incoherent motions: application to diffusion and perfusion in neurologic disorders. Radiology 1986;161:401–407.
2. Atkinson D, Counsell S, Hajnal JV, et al. Nonlinear phase correction of navigated multi-coil diffusion images. Magn Reson Med 2006;56:1135–1139.
3. Butts K, de Crespigny A, Pauly JM, Moseley M. Diffusion-weighted interleaved echo-planar imaging with a pair of orthogonal navigator echoes. Magn Reson Med 1996;35:763–770.
4. Butts K, Pauly J, de Crespigny A, Moseley M. Isotropic diffusion-weighted and spiral-navigated interleaved EPI for routine imaging of acute stroke. Magn Reson Med 1997;38:741–749.
5. Holdsworth SJ, Skare S, Newbould RD, et al. Readout-segmented EPI for rapid high resolution diffusion imaging at 3 T. Eur J Radiol 2008;65:36–46.
6. Chen NK, Guidon A, Chang HC, Song AW. A robust multi-shot scan strategy for high-resolution diffusion weighted MRI enabled by multiplexed sensitivity-encoding (MUSE). Neuroimage 2013;72:41–47. 7. Liu C, Bammer R, Kim Dh, Moseley ME. Self-navigated interleaved spiral (SNAILS): application to high-resolution diffusion tensor imaging. Magn Reson Med 2004;52:1388–1396.
8. Liu C, Moseley ME, Bammer R. Simultaneous phase correction and SENSE reconstruction for navigated multi-shot DWI with non-cartesian k-space sampling. Magn Reson Med 2005;54:1412–1422.
9. Zhang Z, Huang F, Ma X, et al. Self-feeding MUSE: a robust method for high resolution diffusion imaging using interleaved EPI. Neuroimage 2015;105:552–560.
10. Guo H, Ma X, Zhang Z, et al. POCS-enhanced inherent correction of motion-induced phase errors (POCS-ICE) for high-resolution multishot diffusion MRI. Magn Reson Med 2016;75:169–180.
11. Lee Y, Wilm BJ, Brunner DO, et al. On the signal-to-noise ratio benefit of spiral acquisition in diffusion MRI. Magn Reson Med. 2021;85:1924-1937.
12. Lee Y, Wilm BJ, Zoltan N, and Klaas P. High-Resolution Diffusion MRI: In-Vivo Demonstration of the SNR Benefit of Single-Shot Spiral Acquisition vs. EPI. On the signal-to-noise ratio benefit of spiral acquisition in diffusion MRI. In Proceedings of the 27th Annual Meeting of ISMRM. 2019; 0767.
13. Peterson E, Aksoy M, MacKinley J, Bammer R. Acquisition-free Nyquist ghost correction for parallel imaging accelerated EPI. In Proceedings of the 23rd Annual Meeting of ISMRM. Toronto, Ontario, Canada, 2015. p. 0075.
14. Haacke E, Lindskog ED, Lin W. A fast, iterative, partial-fourier technique capable of local phase recovery. Journal of Magnetic Resonance 1991;92(1):126-145.
15. Noll DC, Pauly JM, Meyer CH, et al. Deblurring for non-2D fourier transform magnetic resonance imaging. Magn Reson Med. 1992; 25: 319- 333.
16. Andersson JL, Skare S, Ashburner J. How to correct susceptibility distortions in spin-echo echo-planar images: application to diffusion tensor imaging. Neuroimage 2003;20(2):870-888.
17. Jenkinson M, Beckmann CF, Behrens TE, et al. FSL. Neuroimage 2012;62(2):782-790.
18. Robson PM, Grant AK, Madhuranthakam AJ, et al. Comprehensive quantification of signal-to-noise ratio and g-factor for image-based and k-space-based parallel imaging reconstructions. Magnetic resonance in medicine 2008;60(4):895-907.
Figures
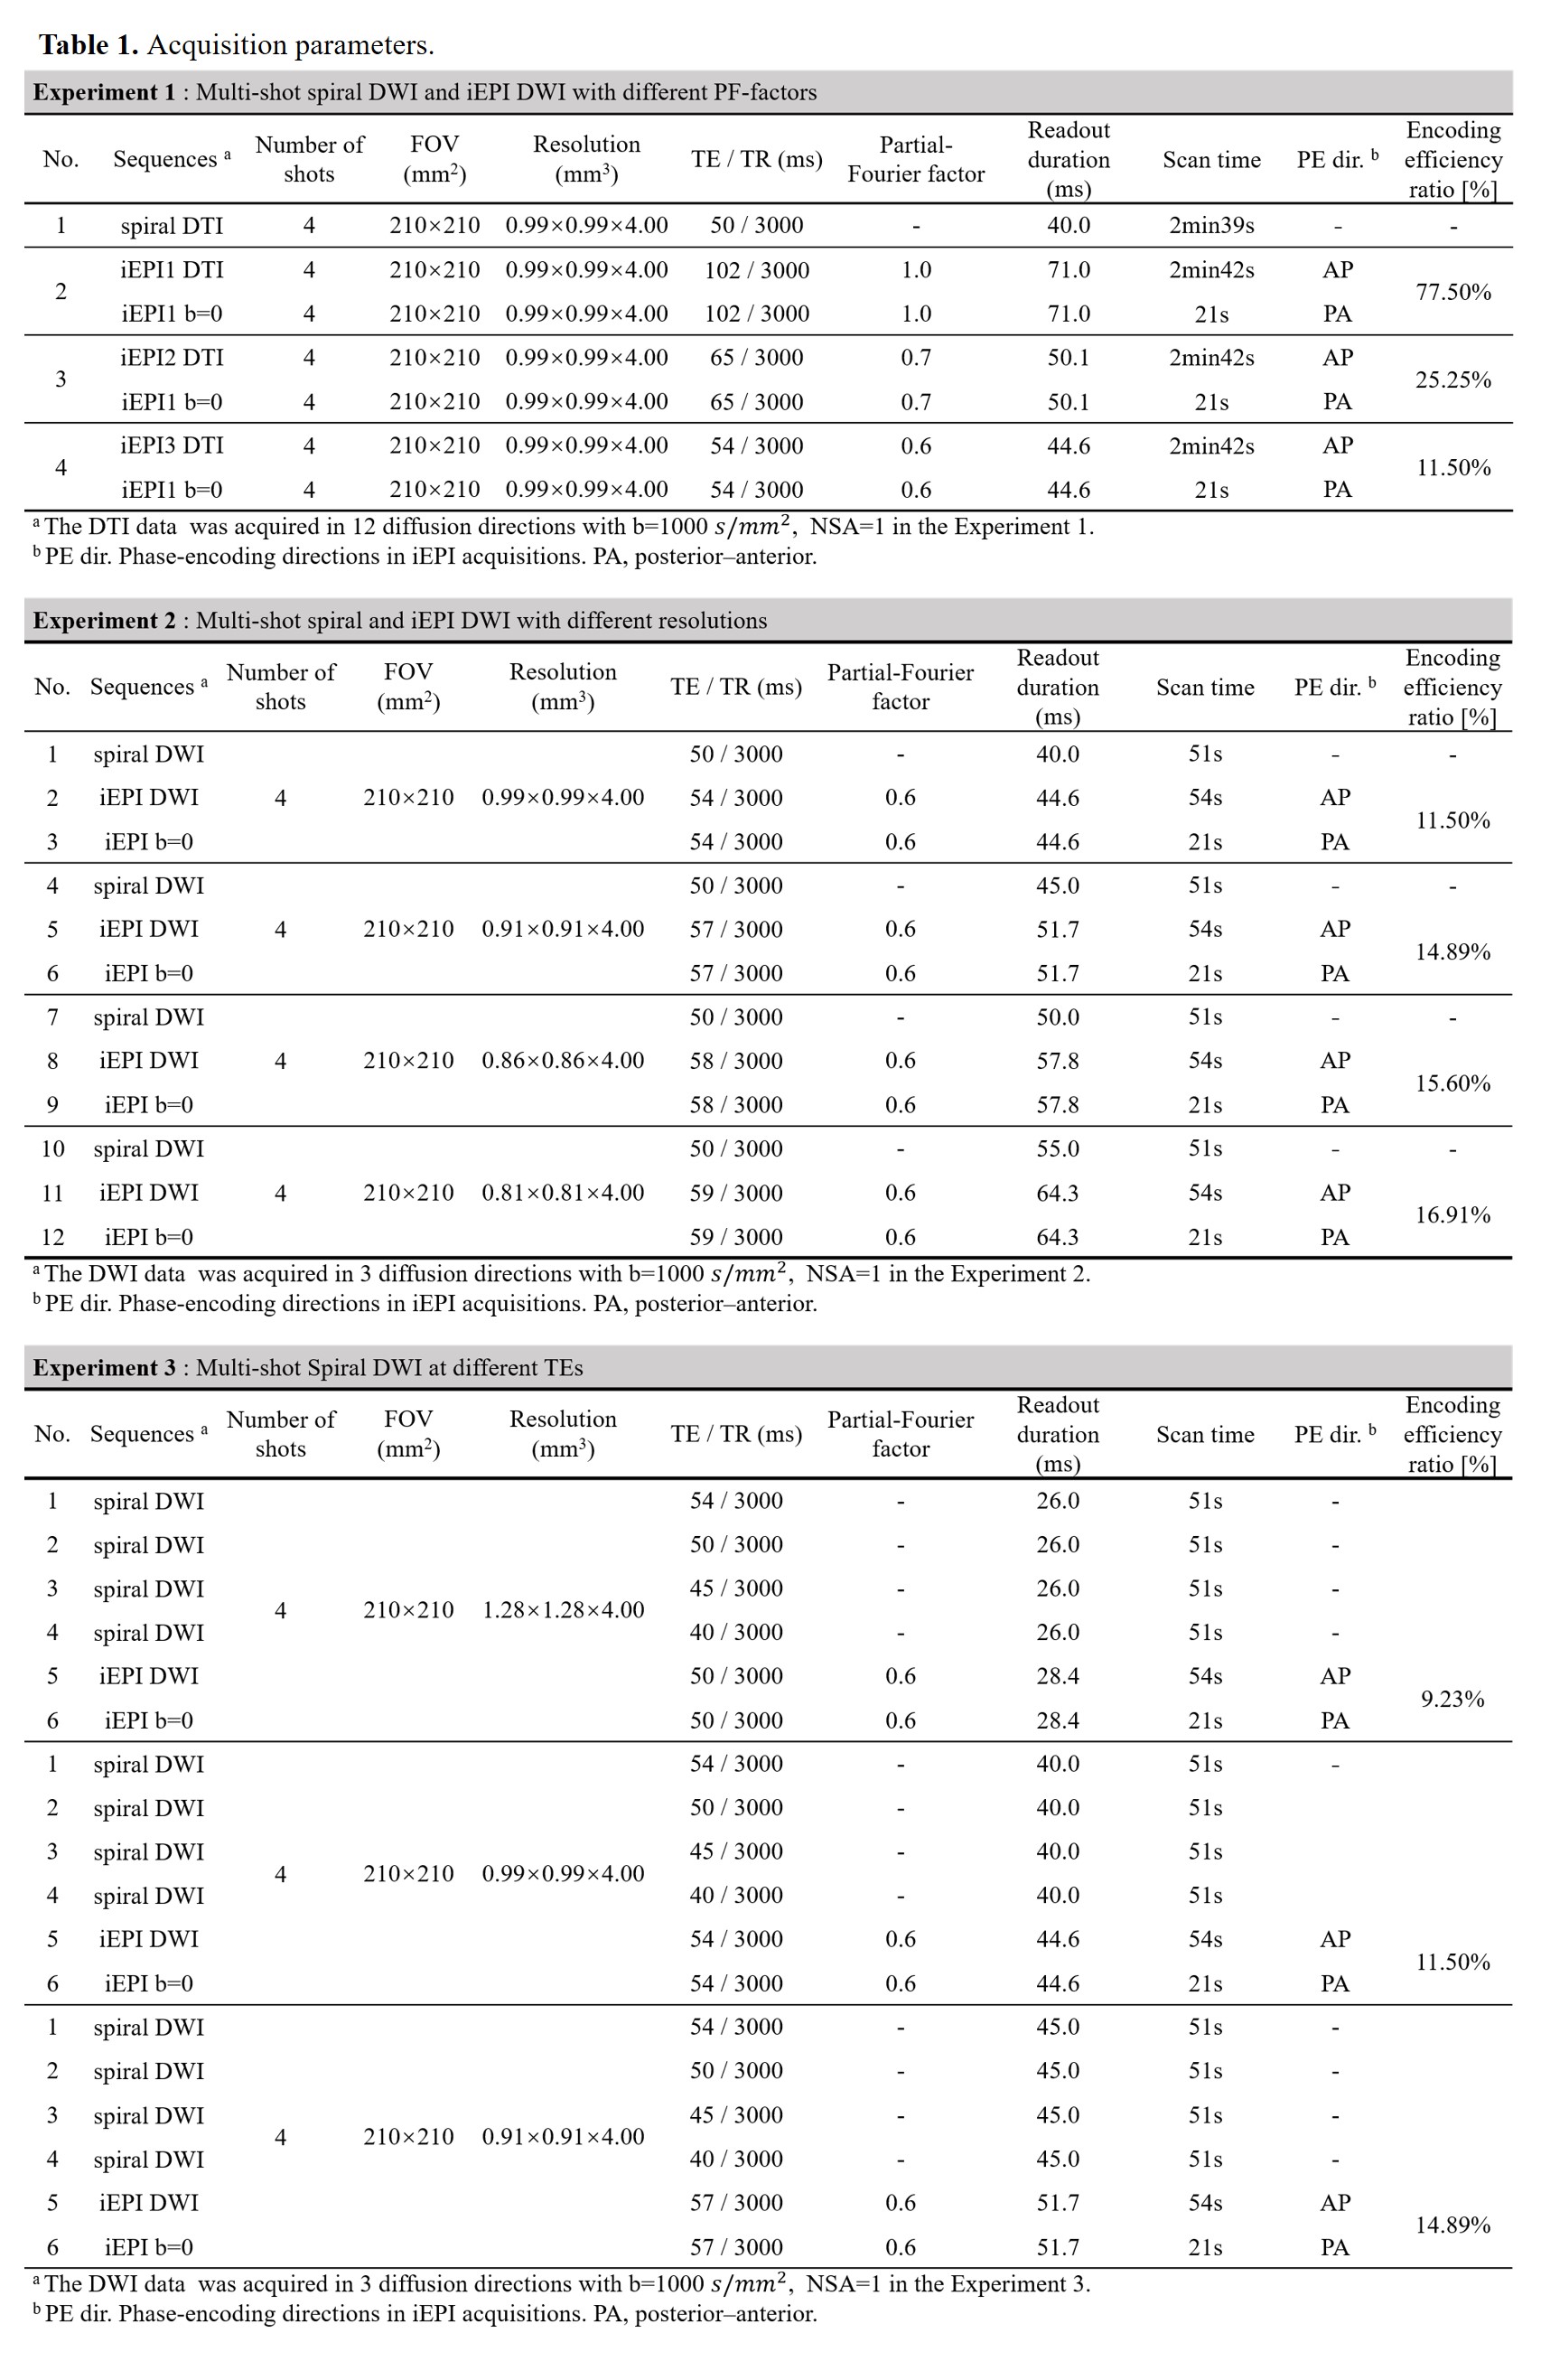
Table 1: The detailed acquisition parameters.
(I) The comparison of multi-shot spiral DWI and iEPI DWI with different PF-factors.
(II) Multi-shot Spiral and iEPI DWI with different resolutions.
(III) Multi-shot Spiral DWI at different TEs. Note that the value of spatial encoding efficiency ratio is listed in the Table.
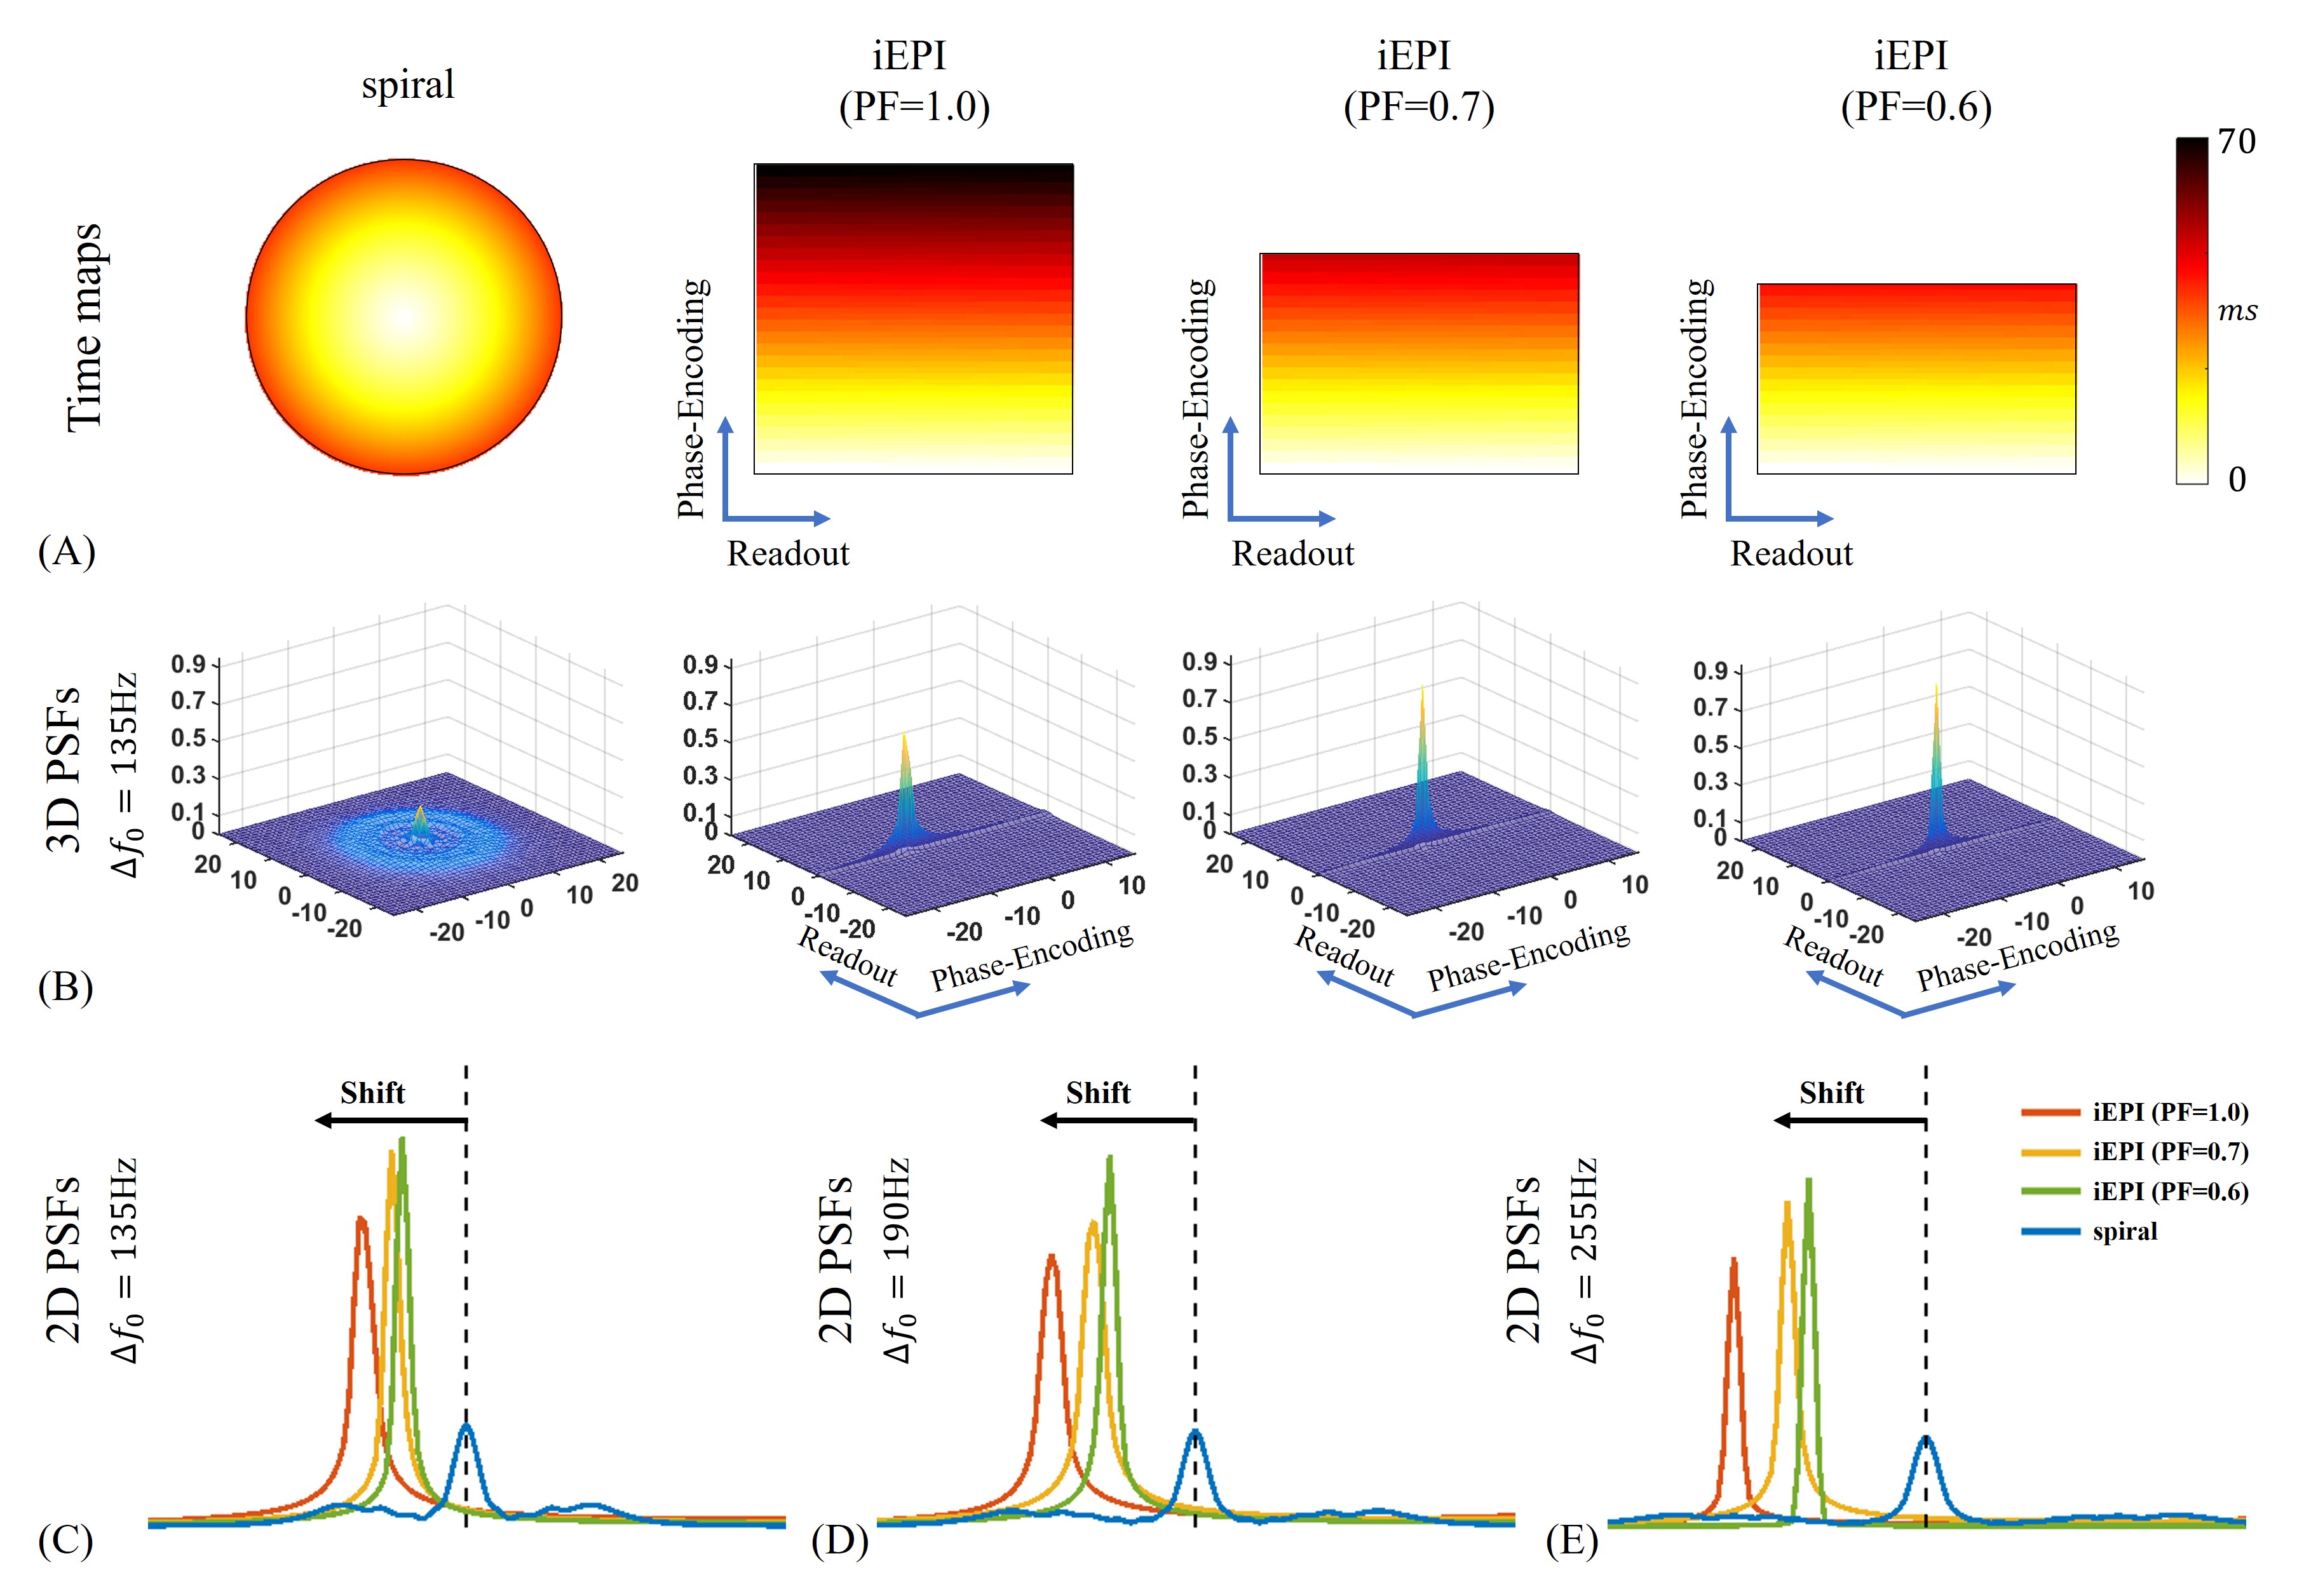
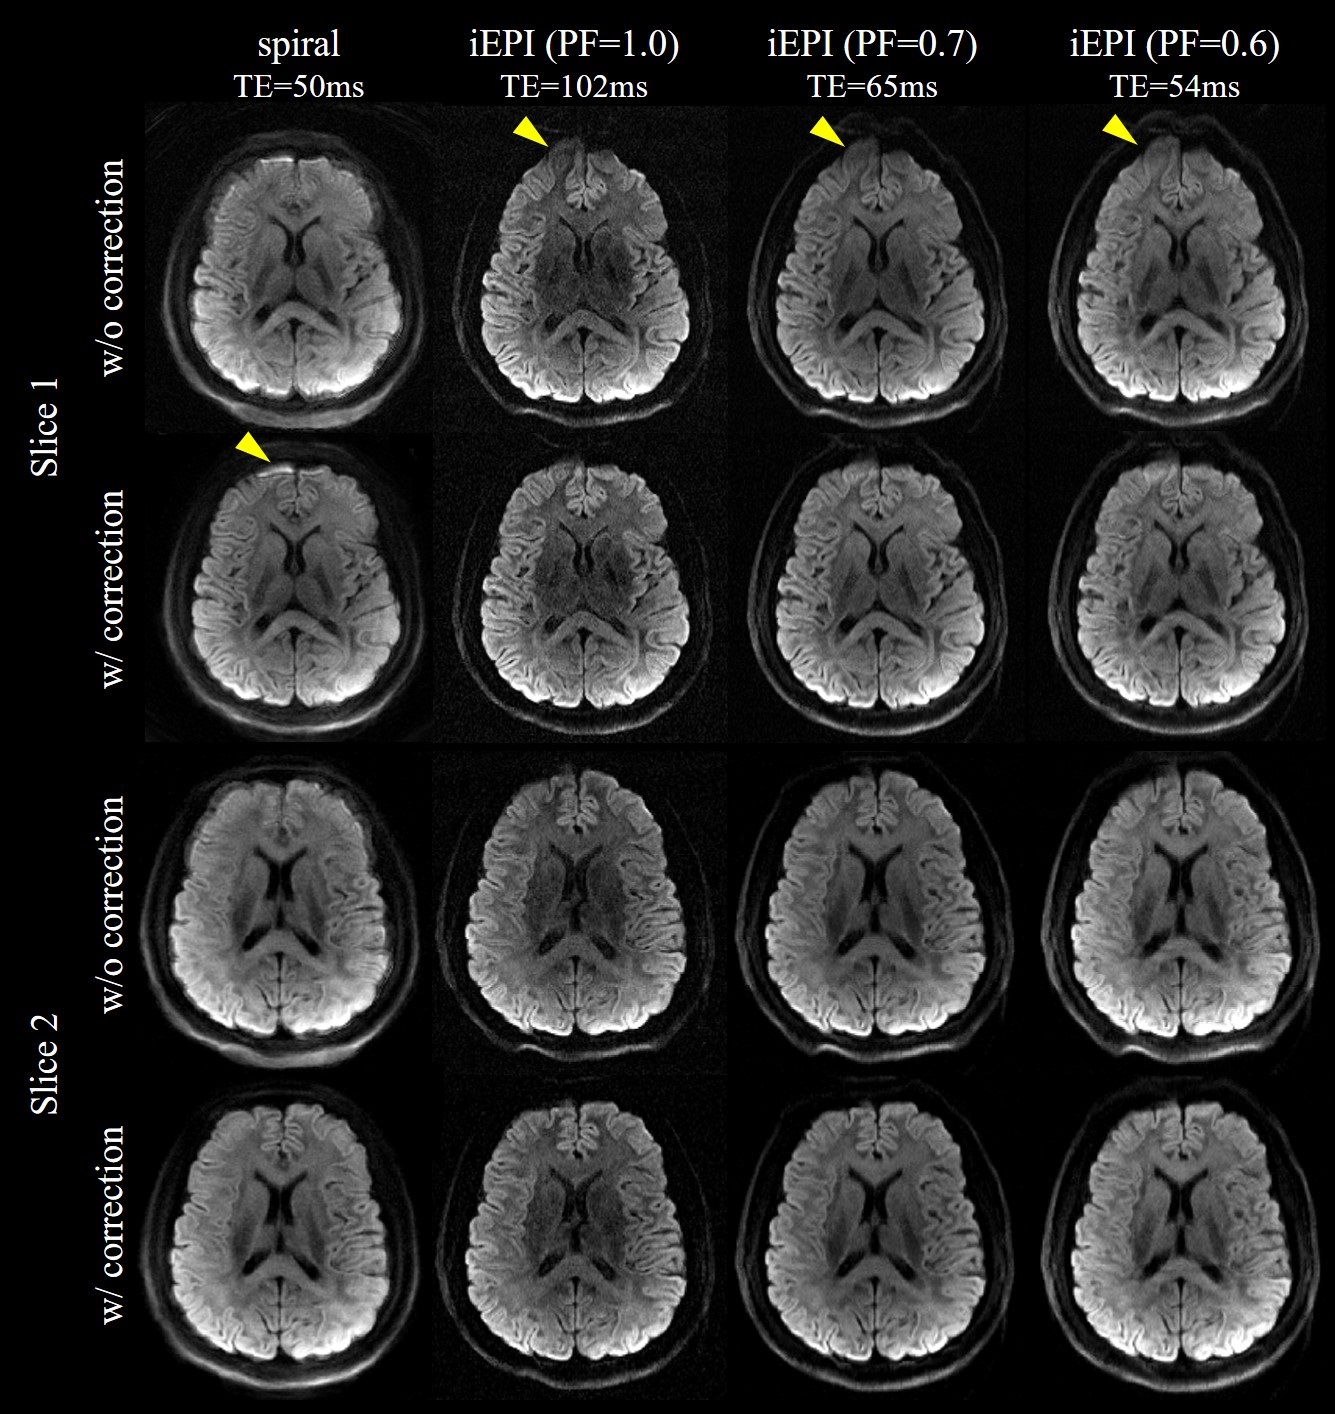
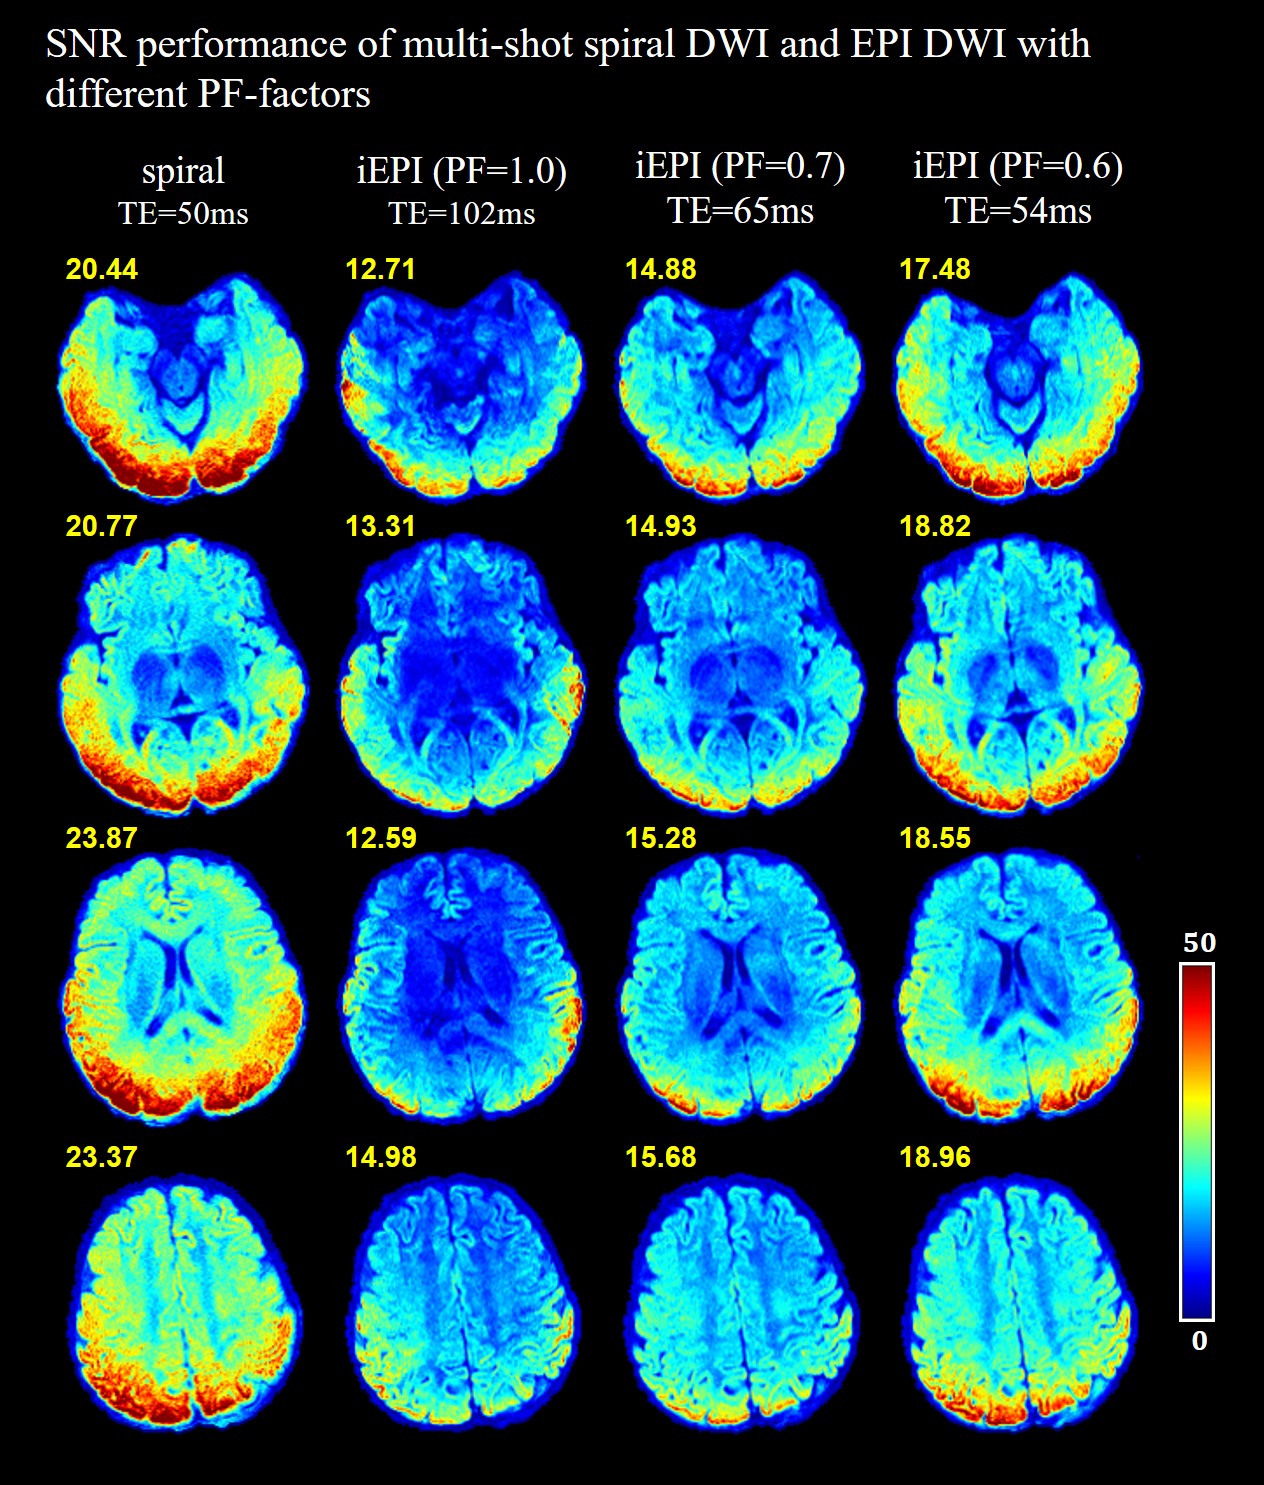
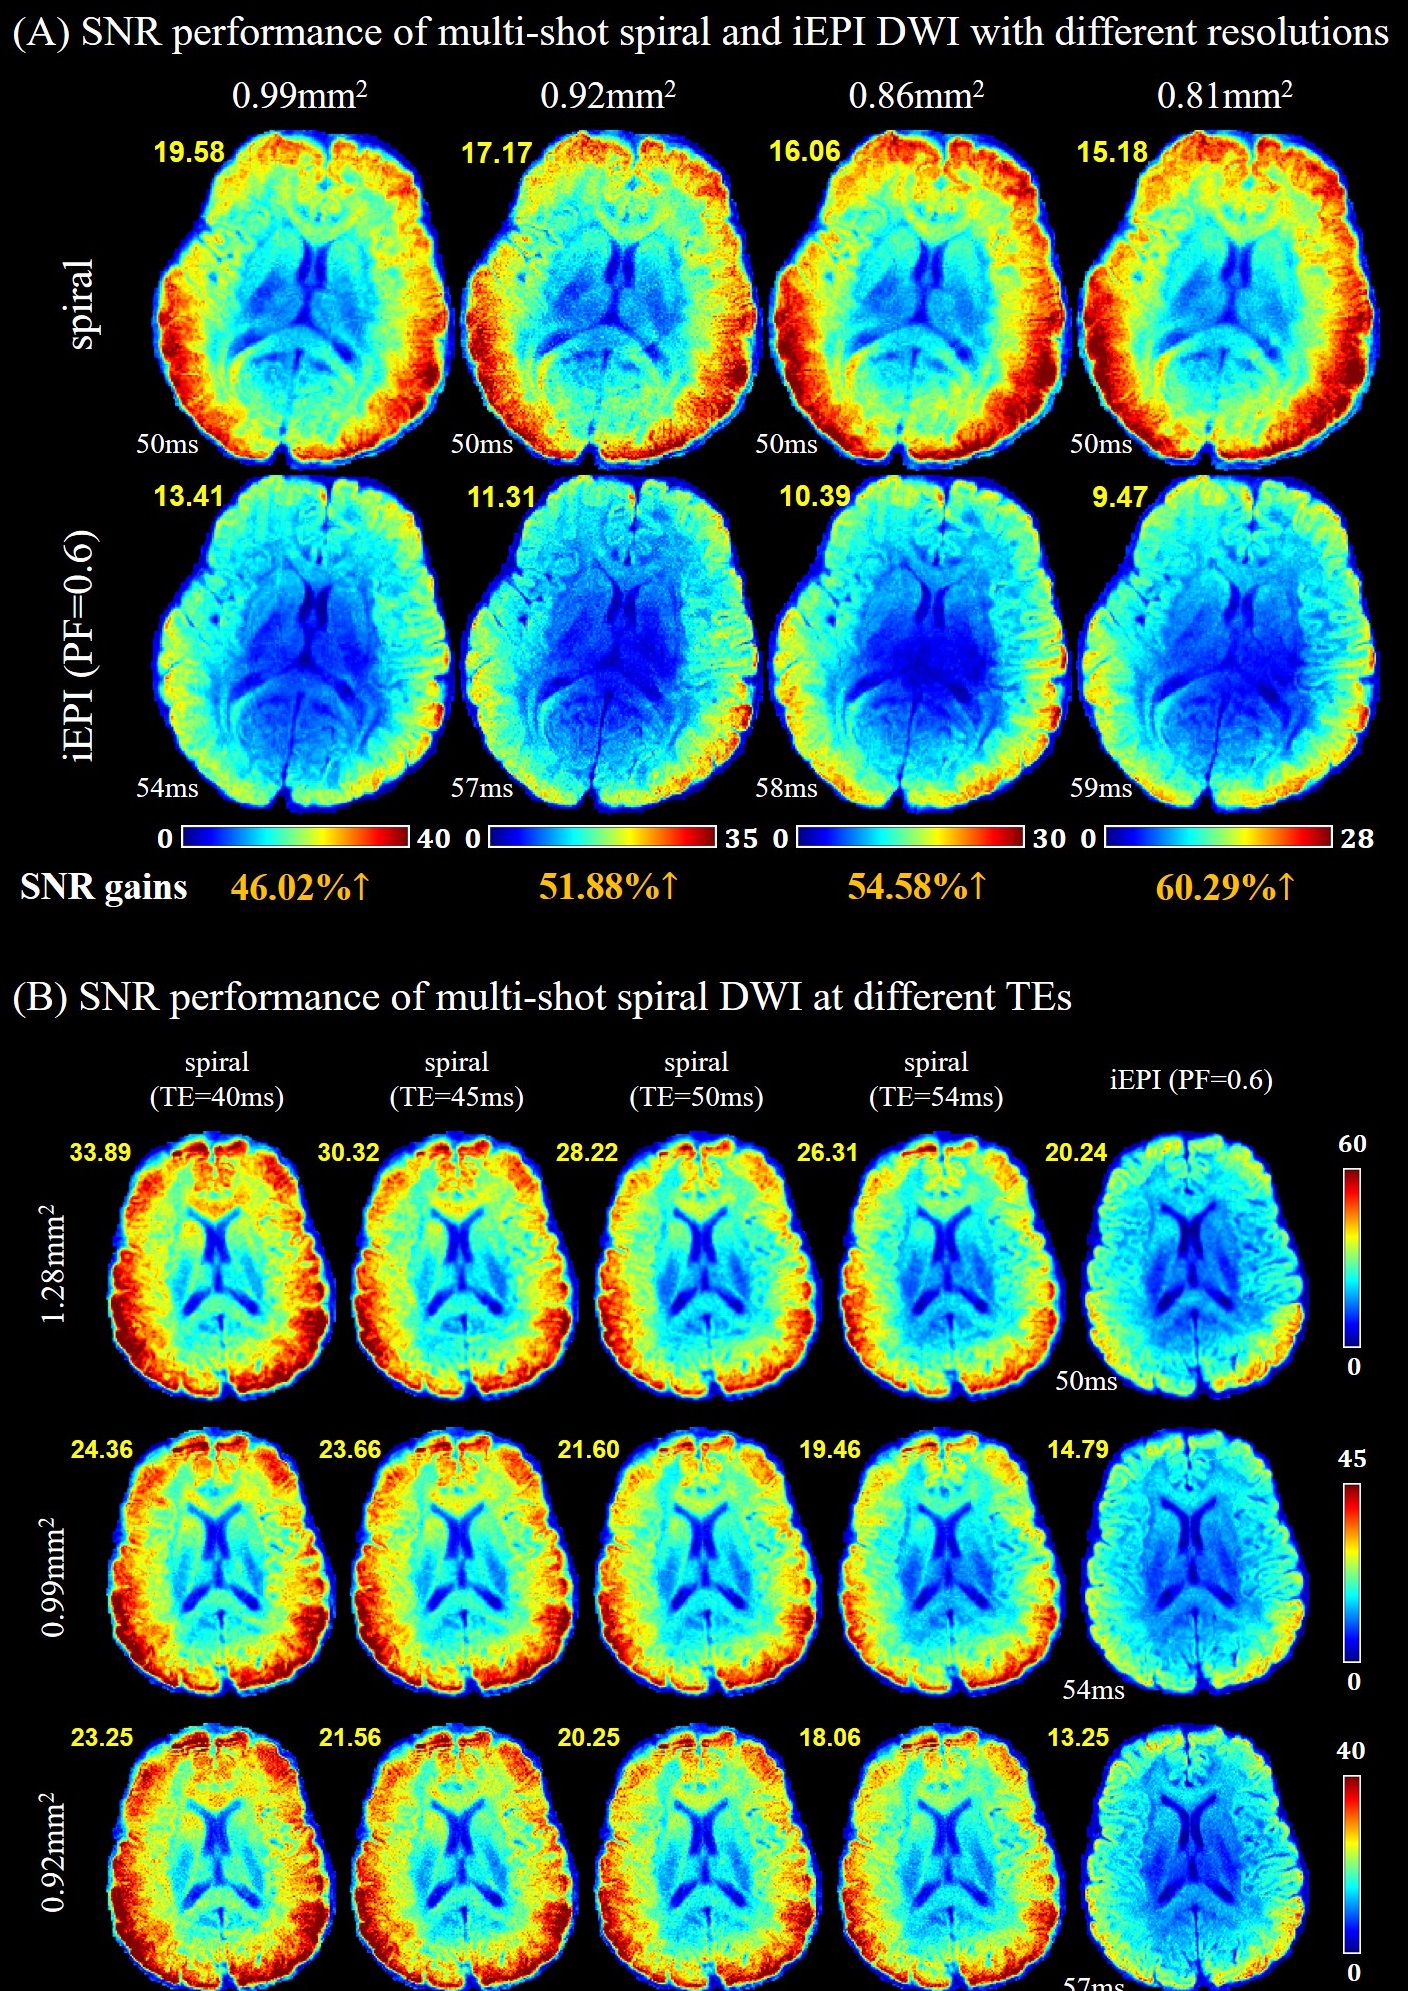
Figure 4: (A) SNR maps of DWI acquired at different resolutions. Mean SNR value is marked in the upper left corner. TE value is marked in the lower left corner. SNR gain value is marked at the bottom. For higher resolution DWI, the SNR benefits of spiral is further increased.
(B) SNR maps of DWI acquired at different TEs. Mean SNR value is marked in upper left corner. TE value of EPI is marked in lower left corner. Spiral provides higher SNR even when the TE of spiral is equal to or slightly longer than that of EPI (PF=0.6), indicating that PF would cause SNR loss due to the incomplete k-space samplings.