3953
Accelerated Rosette Spectroscopic Imaging with semi-LASER Localization1Radiological Sciences, University of California, Los Angeles, Los Angeles, CA, United States, 2School of Health Sciences, Purdue University, West Lafayette, IN, United States, 3Weldon School of Biomedical Engineering, Purdue University, West Lafayette, IN, United States, 4School of Nursing and Brain Research Institute, University of California, Los Angeles, Los Angeles, CA, United States
Synopsis
Keywords: Data Processing, Brain
Limiting the total data acquisition time to a clinically feasible runtime has been a major challenge in MR spectroscopic imaging. Recently rosette based non-cartesian encoding of k-space has been used for spectroscopic imaging due to their fast encoding speed and lower gradient/slew rate requirements. While rosette spectroscopic imaging has been attempted for 2D and 3D spectroscopic imaging, feasibility of undersampling the petals in rosette is not shown. In this study, we implemented a rosette 2D and 3D spectroscopic imaging sequence and shown the feasibility of acceleration factors up to 8x using compressed sensing reconstruction.Introduction
MR spectroscopy (MRS) is an efficient biochemical tool for non-invasively analyzing metabolite and lipid concentrations in human tissues (1-4). Limiting the total data acquisition time to a clinically feasible runtime has been a major challenge in MRS imaging (MRSI). Even though k-space-weighted and average-weighted schemes have been used to shorten the total duration of MRSI, echo-planar spectroscopic imaging (EPSI) showed further acceleration of the total acquisition duration (5,6). Recently rosette based non-cartesian encoding of k-space has been used for spectroscopic imaging due to their fast encoding speed and lower gradient/slew rate requirements (7-10). It has been further reported in MRI studies that the sampling pattern of the rosette trajectory has higher incoherence than that of the other non-Cartesian trajectories like spiral and radial, and can thus achieve higher compressed sensing (CS) reconstruction performance (11). Compressed sensing (CS) based reconstruction techniques are known to be capable of recovering the signal depending on the signal sparsity and incoherent sampling patterns (12). While rosette spectroscopic imaging has been attempted for two dimensional (2D) (2 spatial+1 spectral) and three dimensional (3D) (3 spatial+1 spectral) spectroscopic imaging (7-9), feasibility of undersampling the petals in rosette is not shown. In this study, we implemented a rosette spectroscopic imaging (ROS-SI) sequence and studied the feasibility of multiple acceleration factors.Materials and Methods
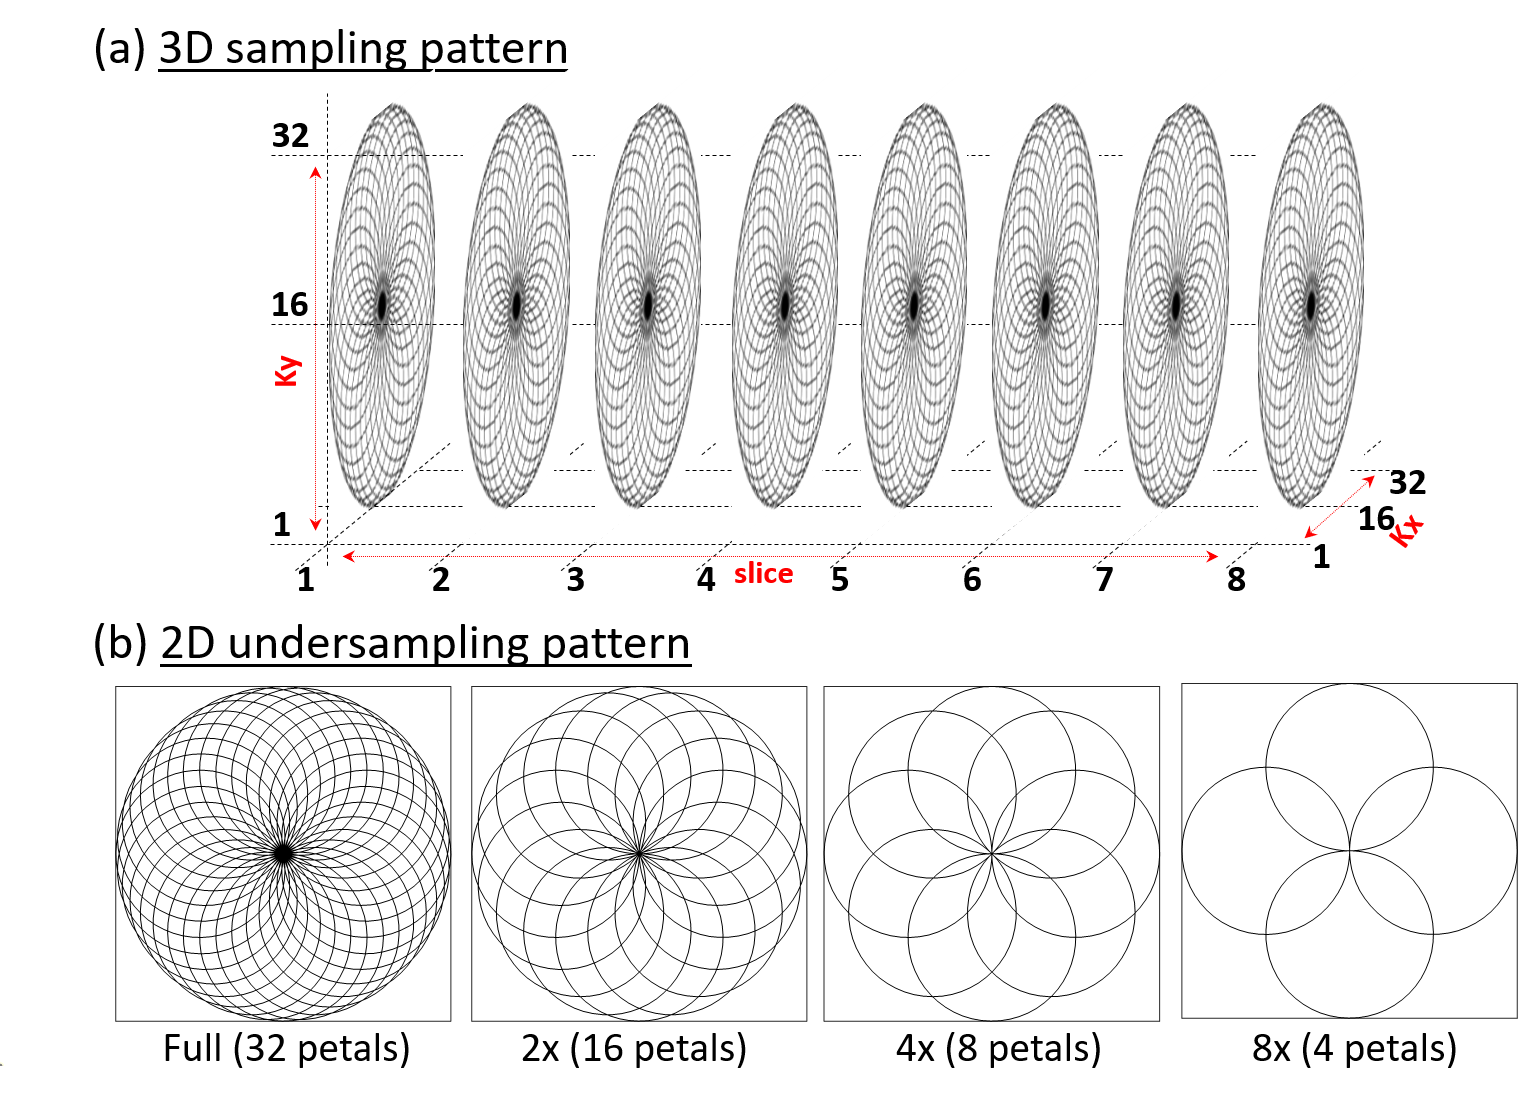
The 2D- and 3D-ROS-SI sequence was designed based on the rosette trajectory for two spatial dimensions (kx and ky) as described in (13) and was implemented on a Siemens 3T clinical scanner. Third spatial dimension (kz) in 3D-ROS-SI was phase encoded. Data from a brain phantom containing metabolites at physiological concentrations was acquired. A 68-year-old healthy volunteer was recruited with IRB approval for the acquisition of in vivo brain data. 2D-ROS-SI phantom scans were acquired with a 32 × 32 matrix size, a 24 × 24 × 2 cm3 slab using volumetric semi-LASER localization, TE = 28.6 ms, TR = 1.5 s, and a spectral width of 1250 Hz, spatially interleaved 32 petals, with 512 t2 points and 8 averages. 8 phase-encoded kz points were additionally acquired for 3D-ROS-SI. Even though (π*Nx)/2 ≈ 51 number of excitations are reported to be needed for full acquisition in (7) (where Nx is number of pixels in one dimension of reconstructed image), it has also been reported that number of petals = Nx is sufficient for adequate reconstruction in (14). Therefore, 32 petals instead of 51 is considered fully sampled for the purpose of this study. The phantom data were retrospectively undersampled at 2x (16 petals), 4x (8 petals) and 8x (4 petals) to study the effect of high undersampling and CS reconstruction. The 2D-ROS-SI volunteer scan was acquired with 8 petals and 8 averages, for 4x acceleration. All other parameters were kept the same as mentioned earlier. Time for one average was 18 seconds including 4 dummy preparation scans and 1 minutes, 42 seconds for 8 averages. CS reconstruction using Perona-Malik (14-17) and non-uniform FFT (nuFFT) (18) was used to estimate the missing samples of k-space. LCModel based quantitation was used to quantify the resulting spectra (19).Results
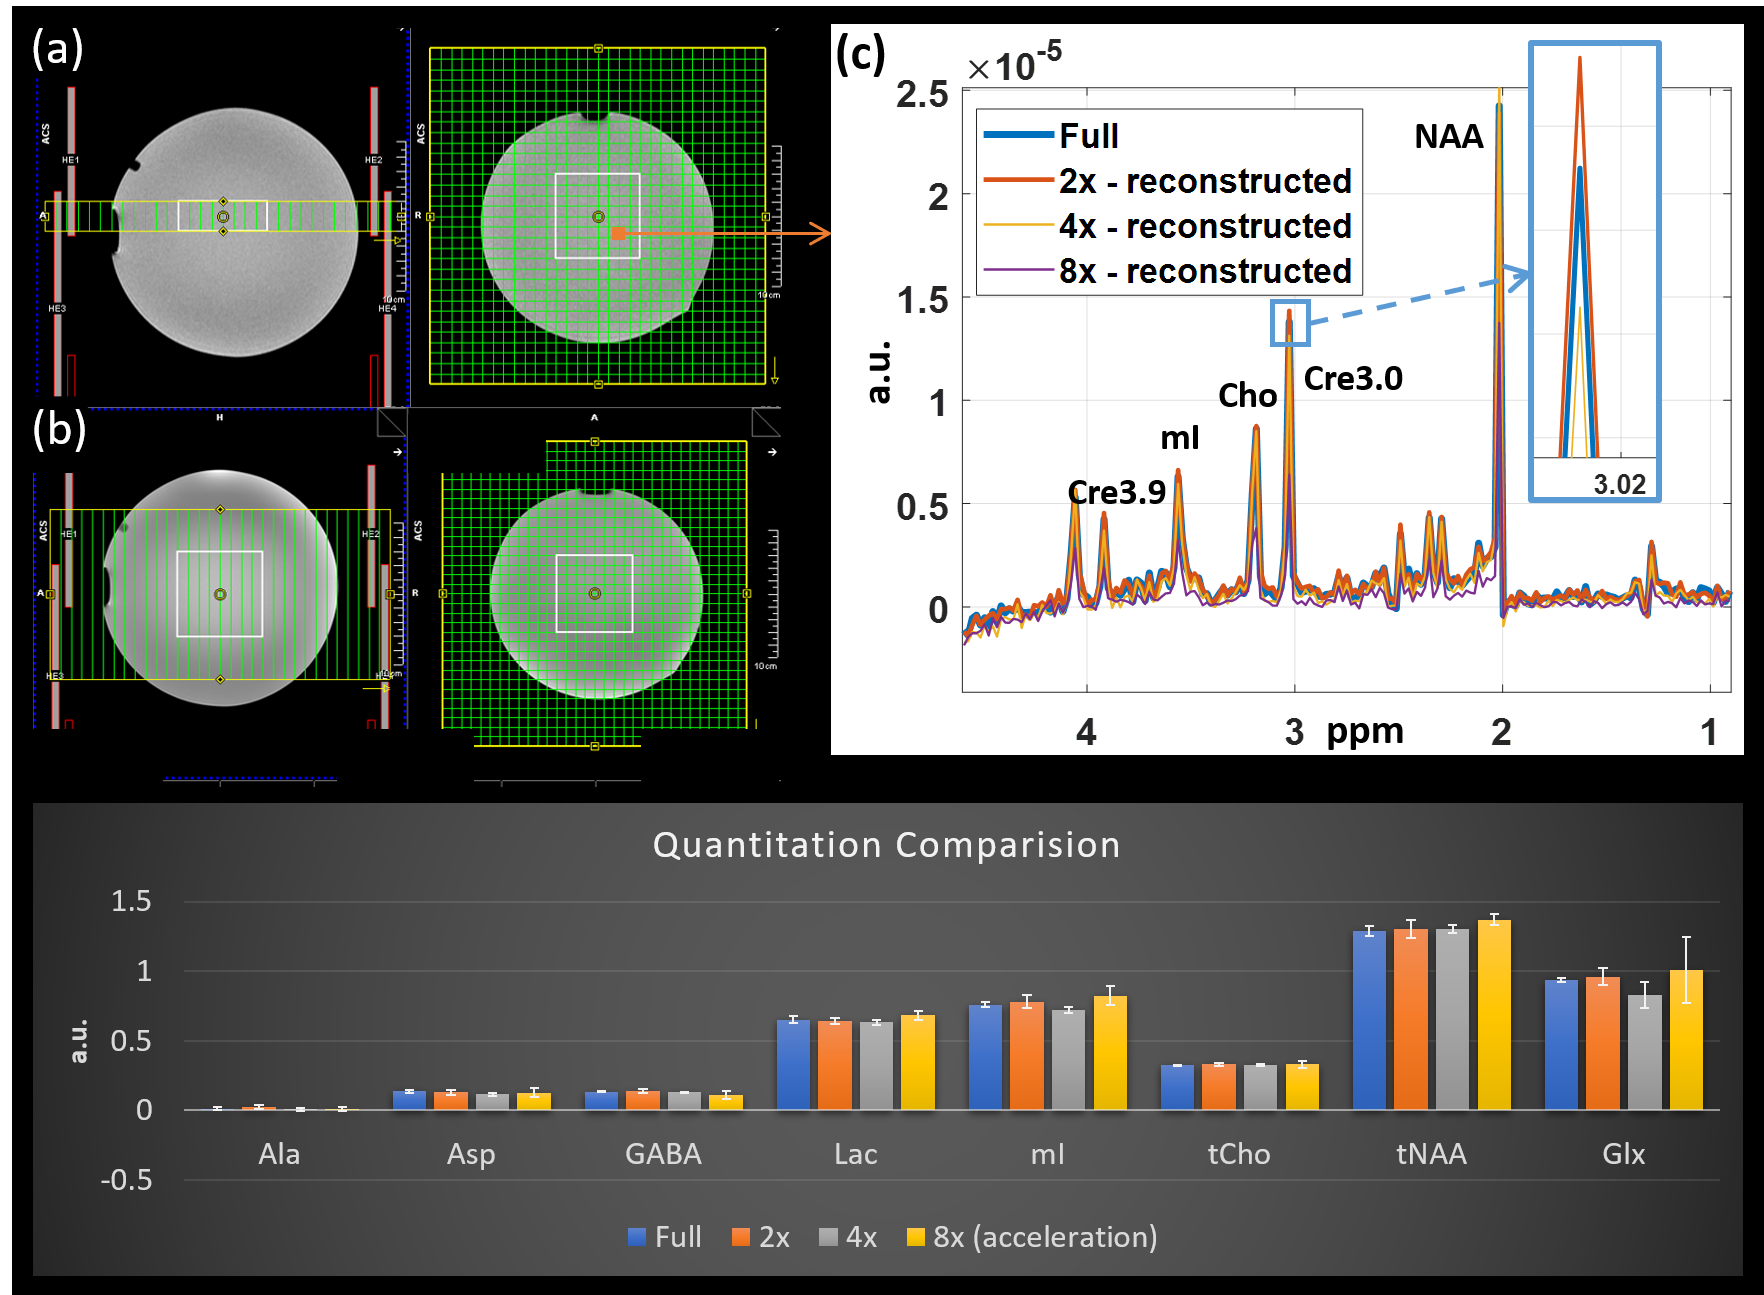
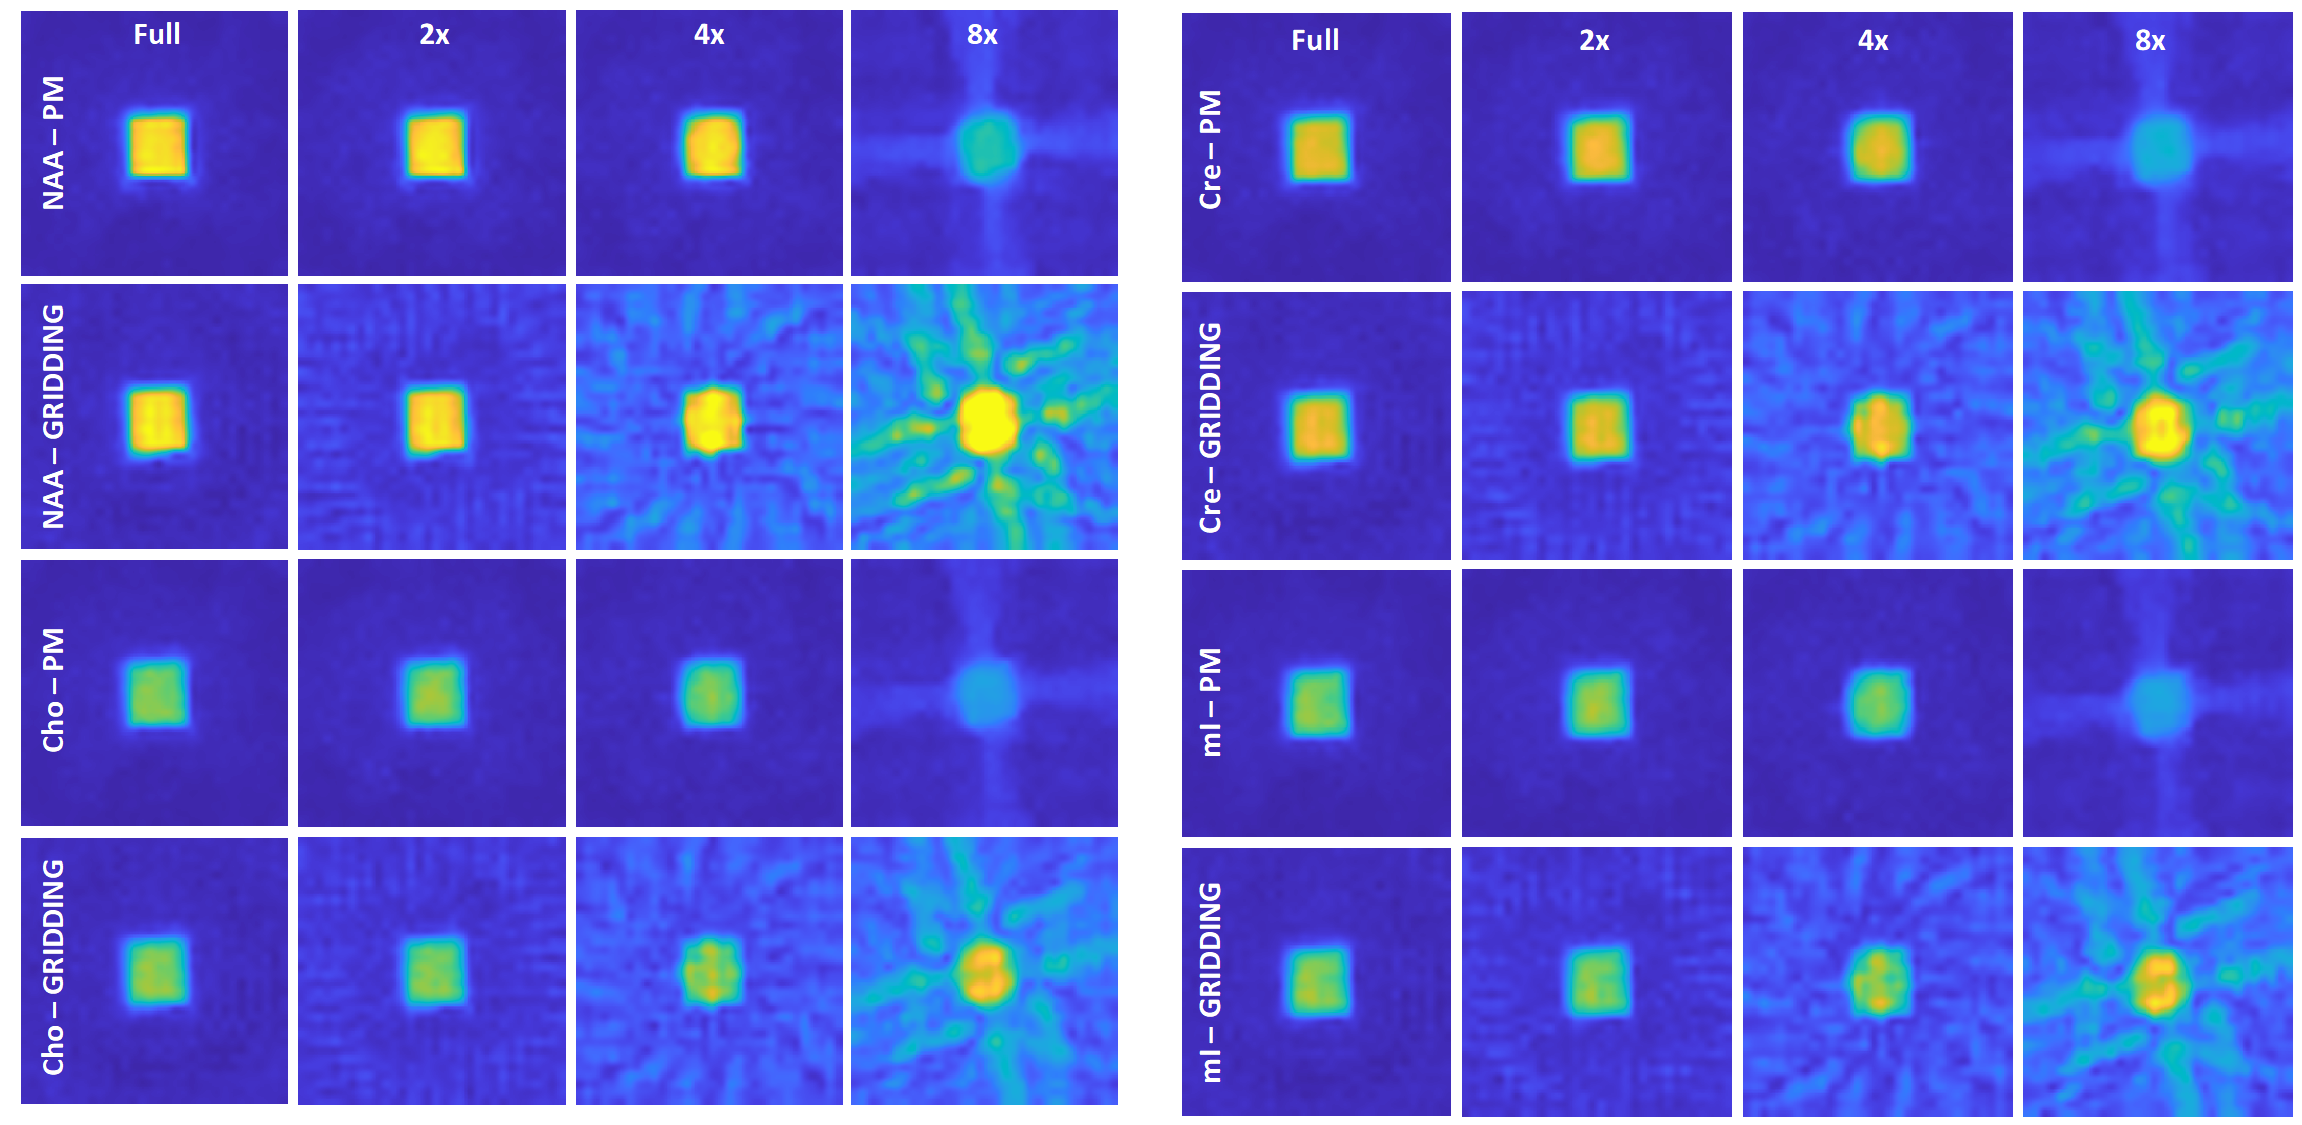
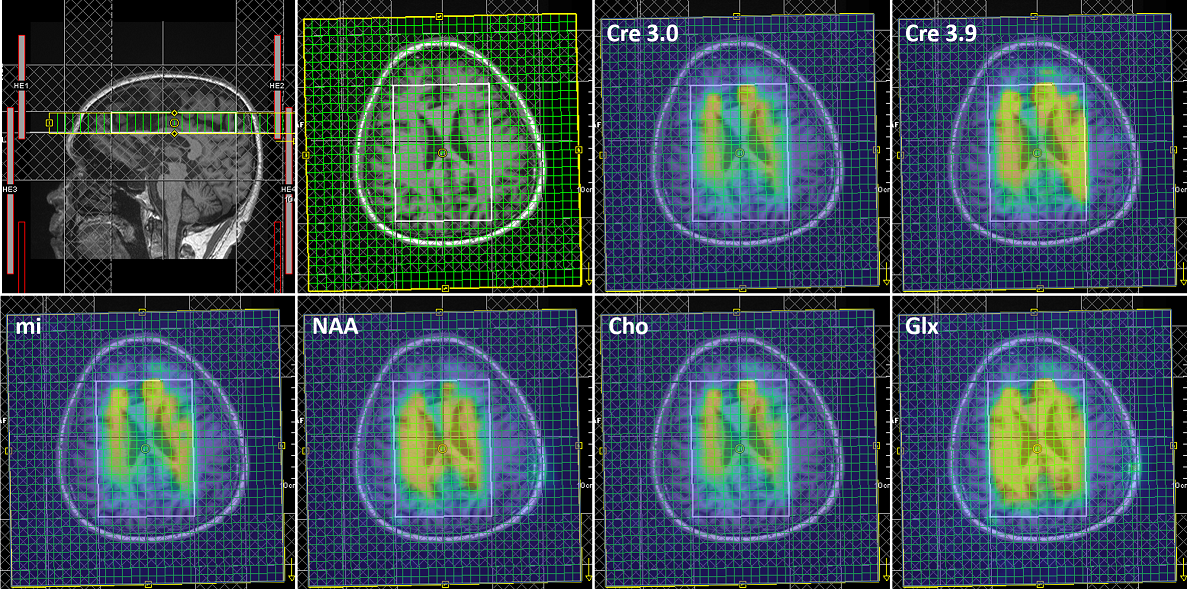
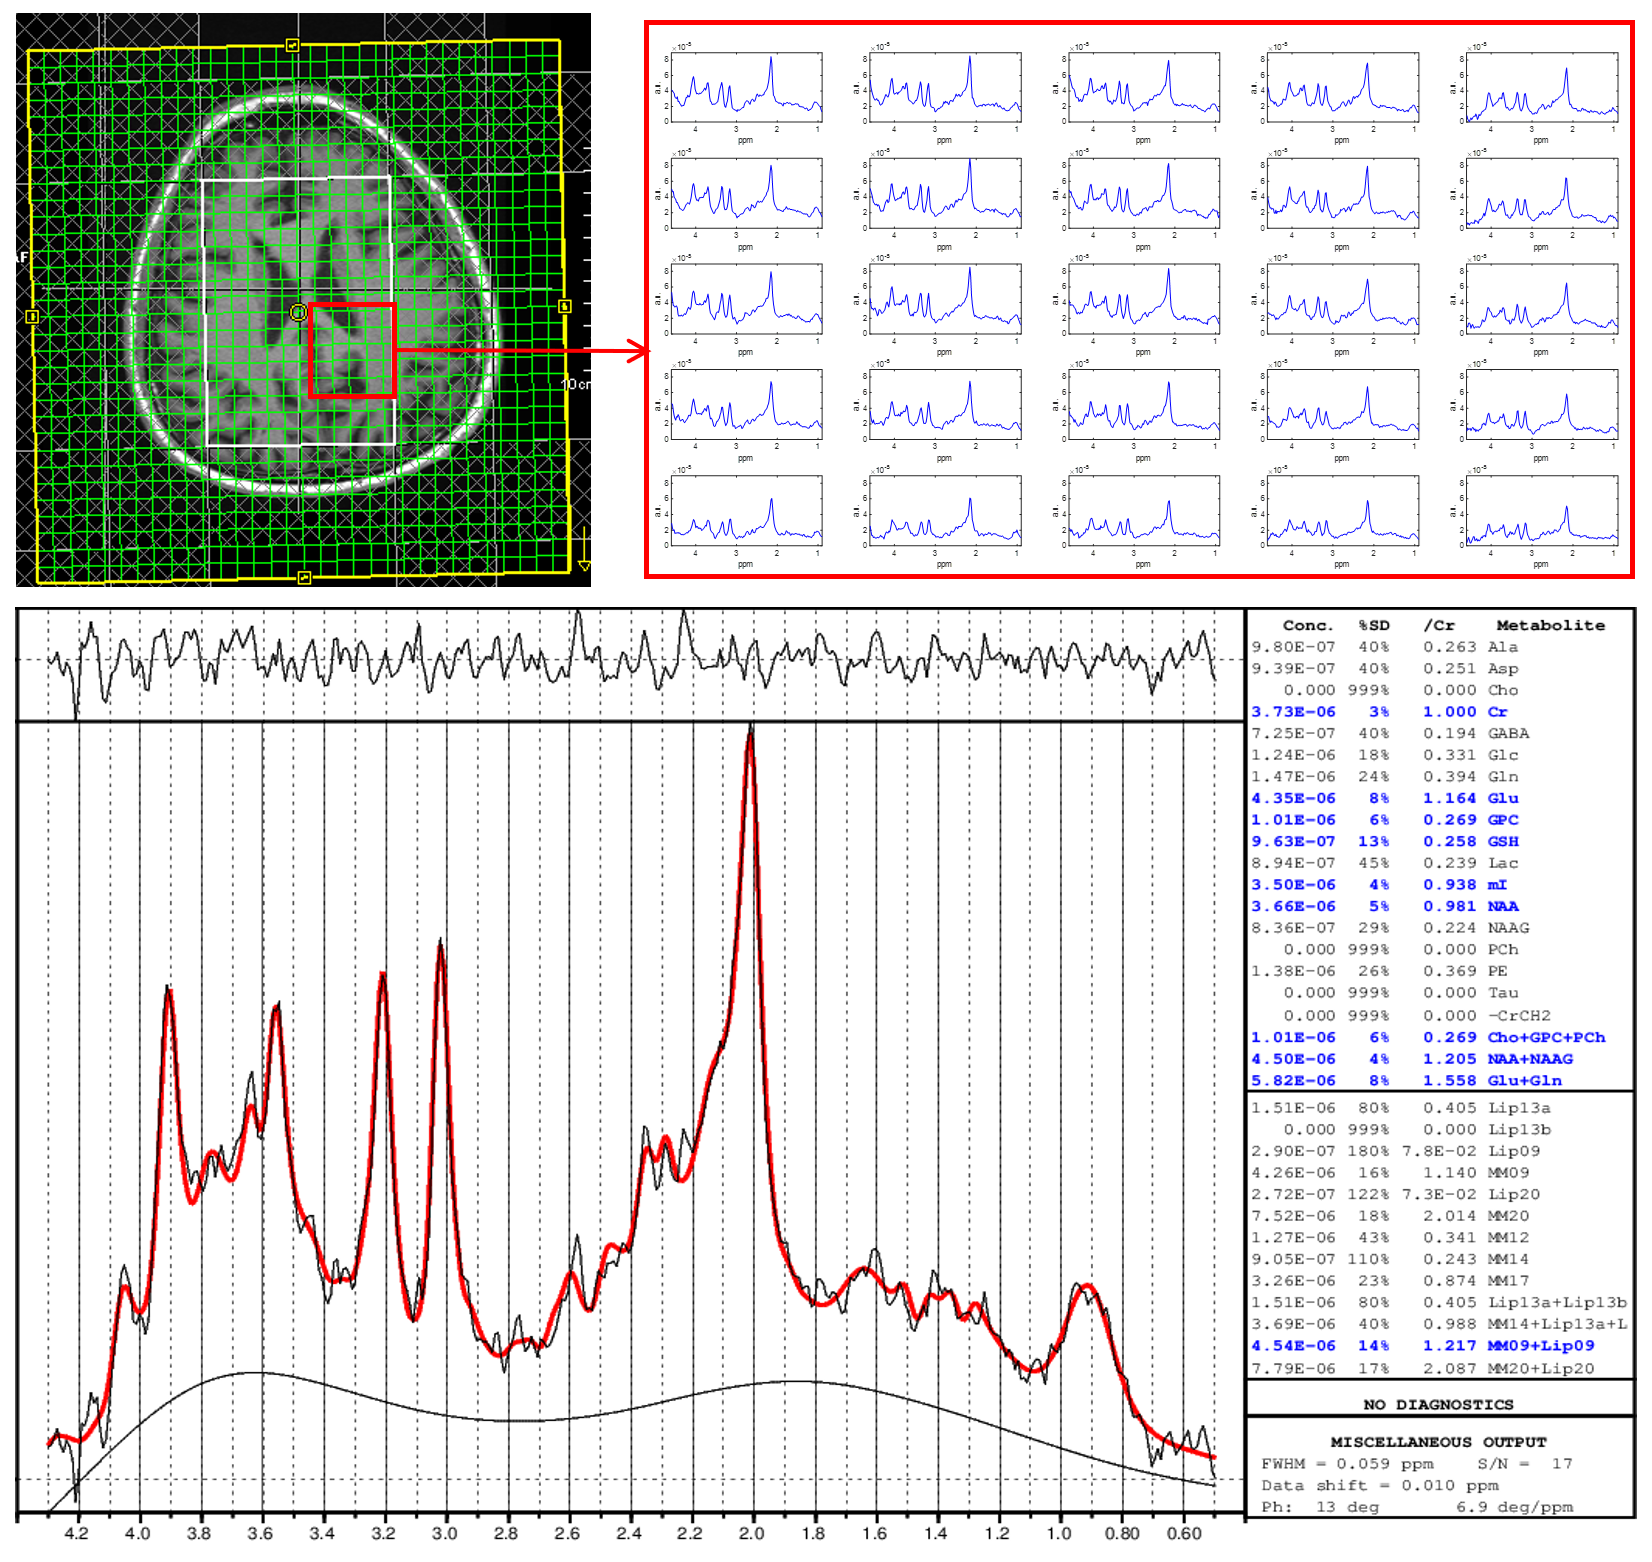
Figure 1 shows the localization images, extracted voxel from reconstructed data at 1x, 2x, 4x and 8x acceleration factors along with a bar chart showing comparison of metabolite ratios with respect to Creatine (Cre) across multiple voxels from different acceleration factors quantified using LCModel. Different sampling patterns used for this study are shown in Fig. 2. Figure 3 shows metabolite maps of Creatine 3.0 (Cre 3.0), myo-Inositol (mI), N-acetylaspartate (NAA) and choline (Cho) at multiple acceleration factors for both gridding and PM based CS reconstruction. In-vivo data was reconstructed using nuFFT based PM. Sagittal and axial localization images, as well as the reconstructed metabolite maps of Cre 3.0, Creatine 3.9 (Cre 3.9), mI, NAA, Cho and Glx (Glutamine + Glutamate) overlaid on the localization image are shown in Figure 4. Multi-voxel spectra covering multiple voxels within the VOI (white box in the localization image) and the LCModel fit of an extracted spectrum is shown in Figure 5.Discussion
Accelerated rosette based spectroscopic imaging was implemented and tested using phantom and in-vivo datasets. The metabolite maps in Fig 1 shows reconstructed maps devoid without visible undersampling artifacts for CS reconstruction until 4x acceleration (8 petals), while gridding shows visible aliasing artifacts even at 2x acceleration. Increasing acceleration to 8x tend to retain aliasing artifacts in the reconstructed data even with CS reconstruction. However most of the metabolite ratios stayed within relatively same range across different acceleration factors. While mI was marginally overestimated at 8x, Glx ratio was slightly reduced at 4x and slightly increased at 8x compared to ratios from fully sampled. Ratios of alanine (Ala), aspartate (Asp), GABA, lactate (Lac) and total choline (tCho) were stable across all acceleration factors considered in this study.Conclusion
Due to the higher incoherence level of sampling pattern, rosette trajectory based spectroscopic imaging sequence has the potential for highly accelerated acquisitions (11). A rosette based Spectroscopic Imaging sequence was implemented and the feasibly of acceleration upto Nx/8 petals is demonstrated in this work.Acknowledgements
Authors acknowledge grants support from National Institute of Health (5R21MH125349-02 and 5R01HL135562-04).References
1. Thomas MA, Ryner LN, Mehta MP, Turski PA, Sorenson JA. Localized 2D J‐resolved H MR spectroscopy of human brain tumors in vivo. Journal of Magnetic Resonance Imaging. 1996 May;6(3):453-9.
2. Thomas MA, Ryner LN, Mehta MP, Turski PA, Sorenson JA. Localized 2D J‐resolved H MR spectroscopy of human brain tumors in vivo. Journal of Magnetic Resonance Imaging. 1996 May;6(3):453-9.
3. Ludwig C, Viant MR. Two‐dimensional J‐resolved NMR spectroscopy: review of a key methodology in the metabolomics toolbox. Phytochemical Analysis: An International Journal of Plant Chemical and Biochemical Techniques. 2010 Jan;21(1):22-32.
4. Schulte RF, Lange T, Beck J, Meier D, Boesiger P. Improved two‐dimensional J‐resolved spectroscopy. NMR in Biomedicine: An International Journal Devoted to the Development and Application of Magnetic Resonance In vivo. 2006 Apr;19(2):264-70.
5. Mansfield P. Spatial mapping of the chemical shift in NMR. Magn Reson Med 1984;1(3):370-86.
6. Posse S, Otazo R, Caprihan A, Bustillo J, Chen H, Henry PG, et al. Proton echo‐planar spectroscopic imaging of J‐coupled resonances in human brain at 3 and 4 Tesla. Magn Reson Med 2007;58(2):236-44.
7. Schirda CV, Zhao T, Andronesi OC, Lee Y, Pan JW, Mountz JM, Hetherington HP, Boada FE. In vivo brain rosette spectroscopic imaging (RSI) with LASER excitation, constant gradient strength readout, and automated LCModel quantification for all voxels. Magnetic resonance in medicine. 2016 Aug;76(2):380-90.
8. Tal A, Zhao T, Schirda C, Hetherington HP, Pan JW, Gonen O. Fast, regional three‐dimensional hybrid (1D‐Hadamard 2D‐rosette) proton MR spectroscopic imaging in the human temporal lobes. NMR in Biomedicine. 2021 Jun;34(6):e4507.
9. Schirda CV, Zhao T, Yushmanov VE, Lee Y, Ghearing GR, Lieberman FS, Panigrahy A, Hetherington HP, Pan JW. Fast 3 D rosette spectroscopic imaging of neocortical abnormalities at 3 T: Assessment of spectral quality. Magnetic resonance in medicine. 2018 May;79(5):2470-80.
10. Bogner W, Otazo R, Henning A. Accelerated MR spectroscopic imaging—a review of current and emerging techniques. NMR in Biomedicine. 2021 May;34(5):e4314.
11. Li Y, Yang R, Zhang C, Zhang J, Jia S, Zhou Z. Analysis of generalized rosette trajectory for compressed sensing MRI. Medical physics. 2015 Sep;42(9):5530-44.
12. Furuyama JK, Wilson NE, Burns BL, Nagarajan R, Margolis DJ, Thomas MA. Application of compressed sensing to multidimensional spectroscopic imaging in human prostate. Magn Reson Med 2012;67(6):1499-505.
13. Shen X, Özen AC, Sunjar A, Ilbey S, Sawiak S, Shi R, Chiew M, Emir U. Ultra-short T2 components imaging of the whole brain using 3D dual-echo UTE MRI with rosette k-space pattern. Magnetic Resonance in Medicine. 2022 Sep 25.
14. Joy A, Paul JS. Multichannel compressed sensing MR image reconstruction using statistically optimized nonlinear diffusion. Magn Reson Med 2017;78(2):754-62.
15. Joy A, Paul JS. A mixed-order nonlinear diffusion compressed sensing MR image reconstruction. Magn Reson Med 2018;80(5):2215-22.
16. Joy A, Jacob M, Paul JS. Compressed sensing MRI using an interpolation‐free nonlinear diffusion model. Magn Reson Med 2021;85(3):1681-96.
17. Joy A, Jacob M, Paul JS. Directionality guided non linear diffusion compressed sensing MR image reconstruction. Magn Reson Med 2019;82(6):2326-42.
18. Fessler JA, Sutton BP. Nonuniform fast Fourier transforms using min-max interpolation. IEEE transactions on signal processing. 2003 Jan 22;51(2):560-74.
19. Provencher SW. Estimation of metabolite concentrations from localized in vivo proton NMR spectra. Magnetic resonance in medicine. 1993 Dec;30(6):672-9.
Figures